FOREX PRO Weekly October 31- November 04, 2011

EUR/USD Daily Update, Tue 01, November, 2011

Good morning,
Yesterday EUR has shown real plunge. Our proper reaction to this is to look at situation in big picture. First, we’ve lost Stop grabber pattern on monthly chart – if you correspond that with discussion of dollar index, then you’ll understand that probability to move right to 1.18 has increased significantly.

The way, how market has reversed and where (major 0.618 Fib resistance), tells that we probably will see significant medium-term downward trend on EUR. This is not the way how retracement usually happens. This looks more as reversal – thrusting bars in opposite direction usually shows about changing of momentum. Market has broken as weekly pivot as weekly pivot support 1 just during 1 day.

So, keeping in mind long-term bullish perspective on Dollar index, we will move gradually day-by-day on EUR/USD.
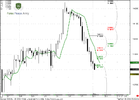
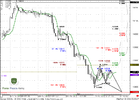
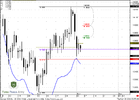
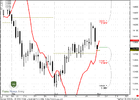
On daily chart we see that market is not at oversold but still at some support – November pivot and major 0.382 support level. This could lead to some pullback on intraday chart that could be used for short position entry. Also pay attention that market stands at trend breakeven point.

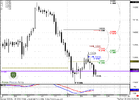
On 4-hour chart we see solid thrust up. Since we want to enter short, we need pullback and this could give us an excellent context for B&B sell. Scalpers may fix fast profit, others could move stop to b/e later and hope that market will continue down move. Personally I like 1.3930-1.3960 K-resistance area to search Sell patterns on 5-15 min charts.

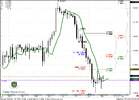
On hourly chart we see that some target stands below current market. There is some probability that market will hit them first and start retracement second. Anyway – today our major focus area is K-area on 4-hour chart where we have to search possibility to enter short.
 

Attachments

  • EUR_D_01_11_11.PNG
    EUR_D_01_11_11.PNG
    46.2 KB · Views: 358
  • EUR_4H_01_11_11.PNG
    EUR_4H_01_11_11.PNG
    41.6 KB · Views: 357
  • EUR_1H_01_11_11.PNG
    EUR_1H_01_11_11.PNG
    40.2 KB · Views: 351
Hi sive and thank you for your efforts in educating us (i'm trying to "absorb" all you tell us ;-) ).
From this analysis you've pointed out that we should expect a dollar appreciation in mid-long term, due to the quarterly stop grabber and gartley 222 buy. From the fundamental point of view this may happen by an increase of short-term US interest rates and because of the growth of US economy (please correct me if i've misunderstood).
Some weeks ago, in the "FOREX PRO Weekly September 05-09, 2011", you told us that you suspect that the dollar might depreciate due to the huge amount of dollar liquidity in monetary system. Do you still think this might appen? (if the answer is positive, how can these two scenarios happen together? If the answer is negative, what make you change opinion?).
Thank you in advance!
 
hi there where exactly the topic is?
have you explained about dollar index in your course?

Hi Hadi,
Search in my archieve thread.
There will be a chapter dedicated to dollar index... It will be released a bit later.

Thanks Sive as always whats been happening to this website??

Asif :)

Hi Asif,
this is the biggest Ddos attack, that we ever seen...
I'm also has a limited access, so, don't judge me strictly, if I will not be able to answer on some questions in time.
 
EUR/USD Daily Update, Wed 02, November 2011

Good morning,

As we've expected yesterday, market should hit some significant targets on 4-hour time frame before will show some hints of possible retracement. That has happened.

The odds of retracement currently are rather high for some reasons:
- this is first plunge after significant move up and market still has rest of upward momentum
- market stands near oversold and at some Fib supports on daily time frame;
- price has hit significant target on 4-hour chart.

Also, pay attention that daily trend has turned bearish. If market will close week as it is - then weekly trend also will be bearish. This is very significant event in medium term perspective.

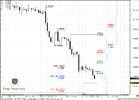
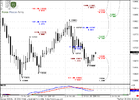
On 4-hour chart we see that market hit 1.618 target of major AB-CD pattern and now turns to forming some consolidation. Personally I will expect one of three scenarios:
1. B&B "sell" on 4-hour chart. Approx. level to watch to enter short between 1.38-1.3850;
2. DRPO "Buy" on 4-hour chart. If it will happen then retracement could be deeper - at least to K-resistance area 1.3850-1.3870, but since this is first pullback on daily - I can't exclude move even to 1.40 - 0.618 Fib resistance.
3. 1.27 Butterfly "Buy" on hourly chart. That is what I want to see most of all, since it gives solid confidence about retracement. Also it could coincide with DRPO on 4-hour chart. That will be absolutely perfect.

So, that's short-term trading plan. If you want to trade these patterns on the long side of the market - you may, but risk is much higher...

BTW, today will be ADP report and FOMC announcement, so be careful
 

Attachments

  • EUR_D_02_11_11.PNG
    EUR_D_02_11_11.PNG
    43 KB · Views: 294
  • EUR_4H_02_11_11.PNG
    EUR_4H_02_11_11.PNG
    44.6 KB · Views: 295
  • EUR_1H_02_11_11.PNG
    EUR_1H_02_11_11.PNG
    46 KB · Views: 296
Hi sive and thank you for your efforts in educating us (i'm trying to "absorb" all you tell us ;-) ).
From this analysis you've pointed out that we should expect a dollar appreciation in mid-long term, due to the quarterly stop grabber and gartley 222 buy. From the fundamental point of view this may happen by an increase of short-term US interest rates and because of the growth of US economy (please correct me if i've misunderstood).
Some weeks ago, in the "FOREX PRO Weekly September 05-09, 2011", you told us that you suspect that the dollar might depreciate due to the huge amount of dollar liquidity in monetary system. Do you still think this might appen? (if the answer is positive, how can these two scenarios happen together? If the answer is negative, what make you change opinion?).
Thank you in advance!

Hi Papao,
I've re-read the thread that you've appointed but have not found about "huge liquidity" there. If it is possible - could you please give me the precise quote.

I just remember that we've discussed not depreciation by liquidity but possible total collapse of dollar in long-term perspectives. This is just a theory, although popular. Are you speaking about this?

Speaking about current research - not exaclty. Technical tools do no tell us the reasons why it could happen - I mean dollar appreciation.
Fundamentally we can count on some appreciation not because of growth - since it's insufficient currently, unemployment is rather solid and house market is still anemic, but mostly because in current situation inflation is growing.

In normal economy cycle development inflation is a product of hyper growth. It means that growth comes first and inflation second.
But currently in US we see overlapping of two this factors, mostly due huge liquidity injections by different types of QE programms.
This could lead to situation, when unstable economy that has some positive momentum, but not strong enough to speak about growth correspond with growing inflation and Fed will have to rise rates.
Because if it will not do this - those people who even have job and wage - will
loose their earnings, due inflation and dollar devaluation. If the will hike rates - then probably they will have chance to safe real value of earnings at some level.
What will happen to economy - it's difficult to say. This is as stalemate in chess, you know. They can't rise and they can't leave them as it is.

No QE will help any more.
 
Thank you Sive for the reply.


Hi Papao,
I've re-read the thread that you've appointed but have not found about "huge liquidity" there. If it is possible - could you please give me the precise quote.

Well, you mentioned the "huge liquidity" not in the weekly review but in a reply:

Just think, why crisis in EU has happened right when US economy has fallen in deep pit and does not see an exit yet? Let's assume that this was a subprime crisis, that lead to lack of liquidity - but take a look at markets now - there is a huge liquidity here, and world does not know where to apply it - all that investors could do is to create a bubbles on Gold, for instance...

...but...

I just remember that we've discussed not depreciation by liquidity but possible total collapse of dollar in long-term perspectives. This is just a theory, although popular. Are you speaking about this?

...i think i misunderstood this point. I understood that the total collapse *had to* happen, so i couldn't arrange it with the down move to 1.18.

Speaking about current research - not exaclty. Technical tools do no tell us the reasons why it could happen - I mean dollar appreciation.
Fundamentally we can count on some appreciation not because of growth - since it's insufficient currently, unemployment is rather solid and house market is still anemic, but mostly because in current situation inflation is growing.

In normal economy cycle development inflation is a product of hyper growth. It means that growth comes first and inflation second.
But currently in US we see overlapping of two this factors, mostly due huge liquidity injections by different types of QE programms.
This could lead to situation, when unstable economy that has some positive momentum, but not strong enough to speak about growth correspond with growing inflation and Fed will have to rise rates.
Because if it will not do this - those people who even have job and wage - will
loose their earnings, due inflation and dollar devaluation. If the will hike rates - then probably they will have chance to safe real value of earnings at some level.
What will happen to economy - it's difficult to say. This is as stalemate in chess, you know. They can't rise and they can't leave them as it is.

No QE will help any more.

ok, now i got it (i hope! The inflation will compel the Fed to rise rates, so the dollar will appreciate. I'm feeling like pipcruit!).

PS: FPA website is still very slow (and, most of times, unavailable). Probably scammers shifted from praying ("that you don't join us today!") to making it impossible (attacking the site). Maybe this is also because your great and professional work in educating us, here and in the military school. Thank you very much, for the effort and your kindness!

Hi Papao -
after yesterday's FOMC statement about worse forecast on employment and GDP - reducing of 2-10 year spread, that we've dicsussed could be driven by growing demand for US Treasuries again..
We've appointed two reasons - rate hiking and further US economy decline. Well, after such statement I start to think, that second scenario may be is not so impossible now... Although initially I've thought that this is a question of inflation mostly.
 
EUR/USD Daily Update, Thu 03, November 2011

Good morning,
our yesterday's trading plan has been accomplished pretty well - that was an excellent, almost perfect B&B "Sell" trade on 4 hour time frame.

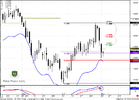
So, on daily time frame we see two side-by-side inside trading session. It tells us that market is building energy. Market is not at oversold, trend is bearish. I do not see any significant patterns currently on daily time frame.

4-hour trend turns bullish. It tells that market probably will show deeper upward retracement, that honestly speaking is absolutely logical, since previous thrust up was solid. But how it will happen?
First scenario is greater AB-CD pattern with target around 1.3880 in Agreement with 4 hour K-area.
Second is Butterfly "buy" on 4 hour time frame.
And, finally, third is if market just continue move down.

Still, let's discuss two first scenarios.
If you're bullish and want to enter scalp Buy trade on hourly chart - wait when hourly trend will turn bullish, then use nearest 0.382 Fib support level to enter. Your nearest target is 1.38 - 0.618 Fib extension of larger AB-CD.
Even if market will turn to Butterfly forming - it probably will reach 0.618 target.
Then you may act as you want - hold position with hope that it will reach 1.3880 and complete AB=CD, or take profit... Don't forget to move your stop at b/e...

If you're bearish, you also can act twofold:
First and more safe action - look for sell signals in 1.3860-1.3880 area. Even if you will be wrong - market probably respect this level and allow you to exit without loss.
Second scenario, if you want to anticipate Butterfly (although in theory this is not allowed). Then you may try to enter short from 1.38 area but place stop above 1.3880 - target of AB-CD. This is more risky so think twice before doing this. Probably you should have significant reasons to assume that market will definitely turn to Butterfly.
 

Attachments

  • EUR_D_03_11_11.PNG
    EUR_D_03_11_11.PNG
    43.6 KB · Views: 146
  • EUR_4H_03_11_11.PNG
    EUR_4H_03_11_11.PNG
    41 KB · Views: 144
  • EUR_1H_03_11_11.PNG
    EUR_1H_03_11_11.PNG
    46.3 KB · Views: 147
Back
Top