Sive Morten
Special Consultant to the FPA
- Messages
- 18,644
Monthly
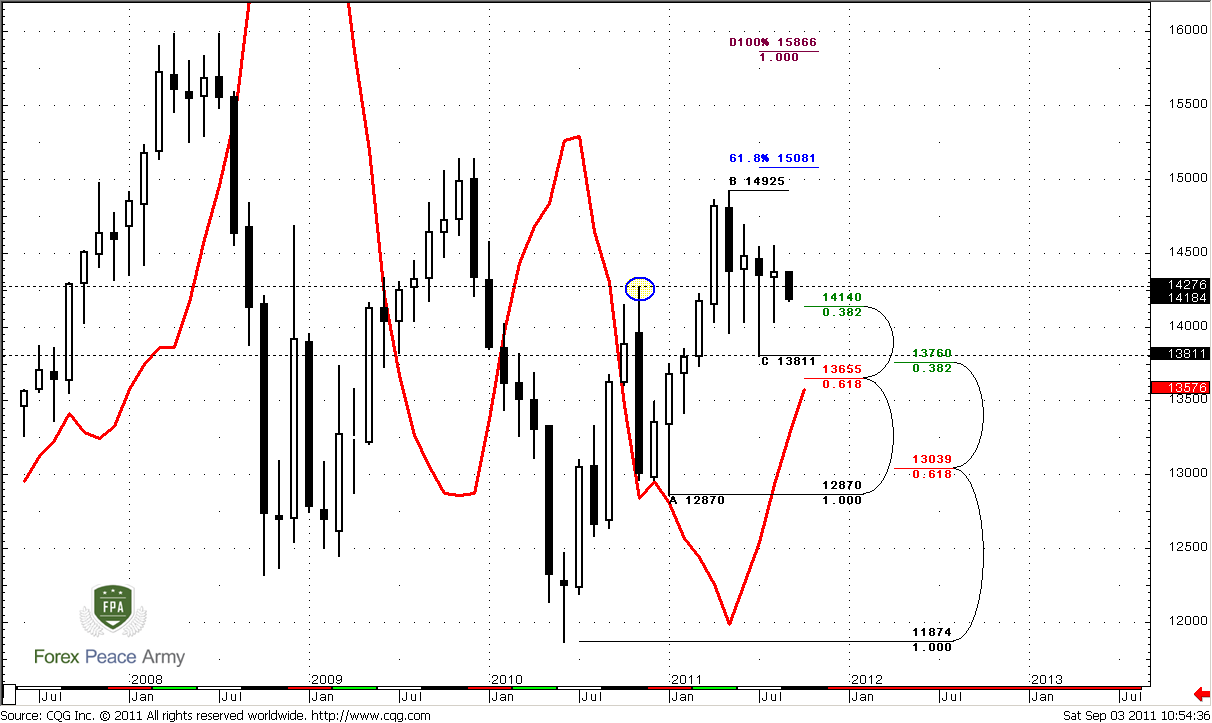
Today I offer you to look at monthly chart from a bit another angle and not just repeat previous thoughts about butterfly, flag or pennant and their targets. Still those issues are still valid – I just do not want to repeat them again. If you do not quite remember them, you may just re-read previous weekly research.
First I would like to discuss current consolidation. I do not see such kind of price action for a long time already. Something like that was in 2008 – but it was shorter in time. From the one point of view it tells about market indecision, but from the other - market is building energy. We see some inside months here – June was inside month, so as August also inside one.
Meantime officially monthly time frame has bullish bias – trend holds bullish, price action, in general, supports it. Yes, market has turned to some consolidation, but what’s the problem? No problems. But what we have to keep an eye on, to react in time on possible change in market bias?
I suspect that upward board is obvious – 1.50-1.51. Breakout of it could lead market right to previous highs around 1.60. But what’s about lower border? To my mind this is 1.36 level, because breakout of just previous low at 1.3811 could lead to just W&R, since there is a strong Confluence support just below it – 1.3655-1.3760. Also, take a look that MACDP comes very close to it. It means that we can hit two hares just with single bullet. Now it stands at 1.3576, but in October it will move a bit higher. So, if market will break 1.36 – we will get two in one – breakout of strong monthly support (that already will confirm bear strength) and shift the trend bearish. That will be reversal.
Currently, I again keep an eye on 1.4276 high. We can see that during four consecutive months market has tried to move lower and close below that level but failed every time. Currently we see next attempt to do that. And if this will happen in September – that will be the first bell to aware of downward reversal.
Upward targets stand the same, although it might happen that we will not need them in nearest future. Still, nearest target stands at 1.5081 – just above the previous highs – this is 0.618 extension from most recent AB-CD pattern. Next area to watch is 1.5272, but potentially it could turn to butterfly “Sell” pattern. The target of this pattern is 1.27 extension at 1.6027. Also it almost coincides with 1.27 target of bullish AB-CD at 1.5925 and with 1.0 Fib extension of most recent smaller AB-CD. From classical standpoint upward move should be equal to the mast of the pennant – that is 1.5866 area.
Weekly
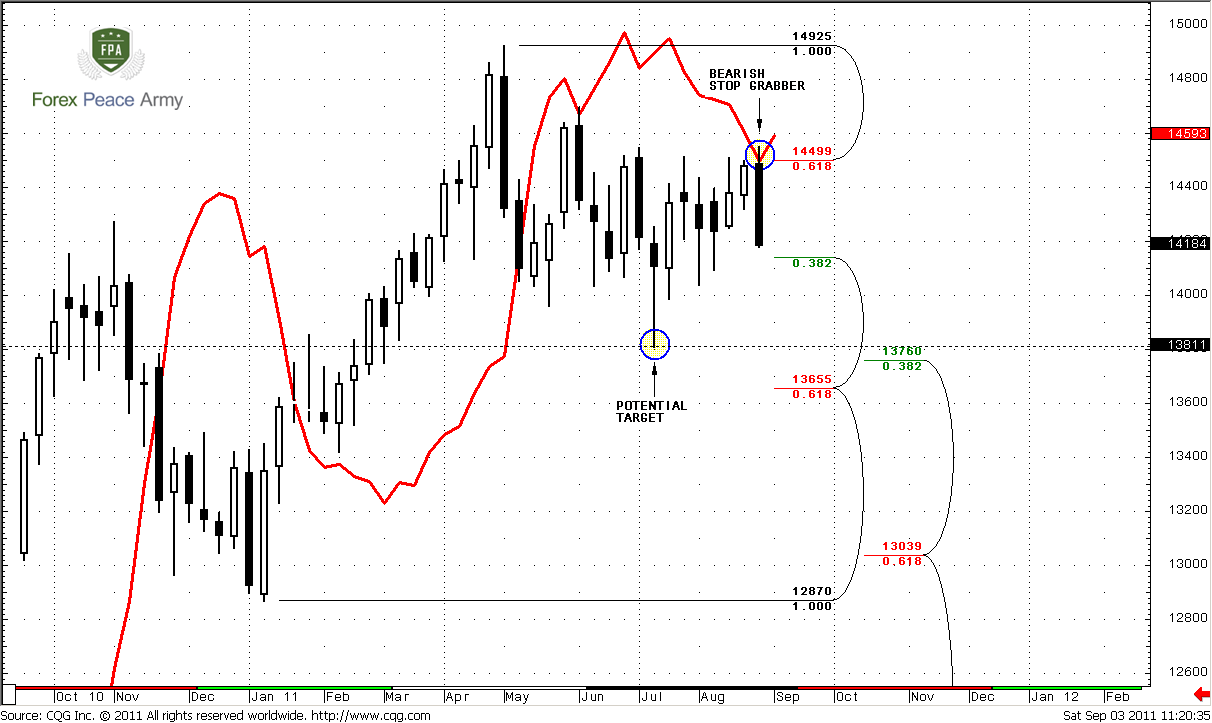
When you will take a look at weekly chart, you will understand why I’ve told much about important levels on monthly time frame. Also you will see amazing structure and logic that could give us technical analysis. Remember what we’ve discussed on previous week – right, potential bullish dynamic pressure, since market has formed consecutive higher lows and does not support bear trend. The logical finish of such pattern as bullish dynamic pressure is trend shifting to bullish side. Now let’s see what market has shown to us…
Right, quite opposite signal is – bearish stop grabber right at 0.618 Fib resistance and Agreement. Do you see outstanding structure and logic? Market gives you absolutely clear pattern right at the moment when you expect some solution, some clue. In fact, weekly chart helps us much, since it gives us context at least for the whole nearest week or may be two, and that context is “down”. Keeping this signal, we have to use daily and intraday charts just to estimate an area where we can enter “short”. That’s the real beauty… Additional bearishness comes from bearish W&R – we’ve discussed that in daily updates and videos. The point is that previous week’s high has cleared out all previous highs above 1.45. But then market has returned right below it. By the way, if you remember, that was due daily bullish stop grabber…
So, I just want to remind you, that minimum target of bearish Stop grabber is previous lows at 1.3811. Since market has to exceed it, probably it will reach confluence support at 1.3650-1.3760. 1.4140 is not a Fib support any more, since it has been broken already. Weekly chart is not at oversold, so this target is quite reachable. Situation becomes really hot. Couple weeks ago we already have traded stop grabber – you can find it by yourself, I suppose, and it has worked well. Particularly due to this pattern market renewed the lows and formed 1.3811 level.
The failure point is 1.4550 area – the high of Stop grabber’s bar. IF market will exceed it and close above it, then this pattern will be treated as failed.
Daily
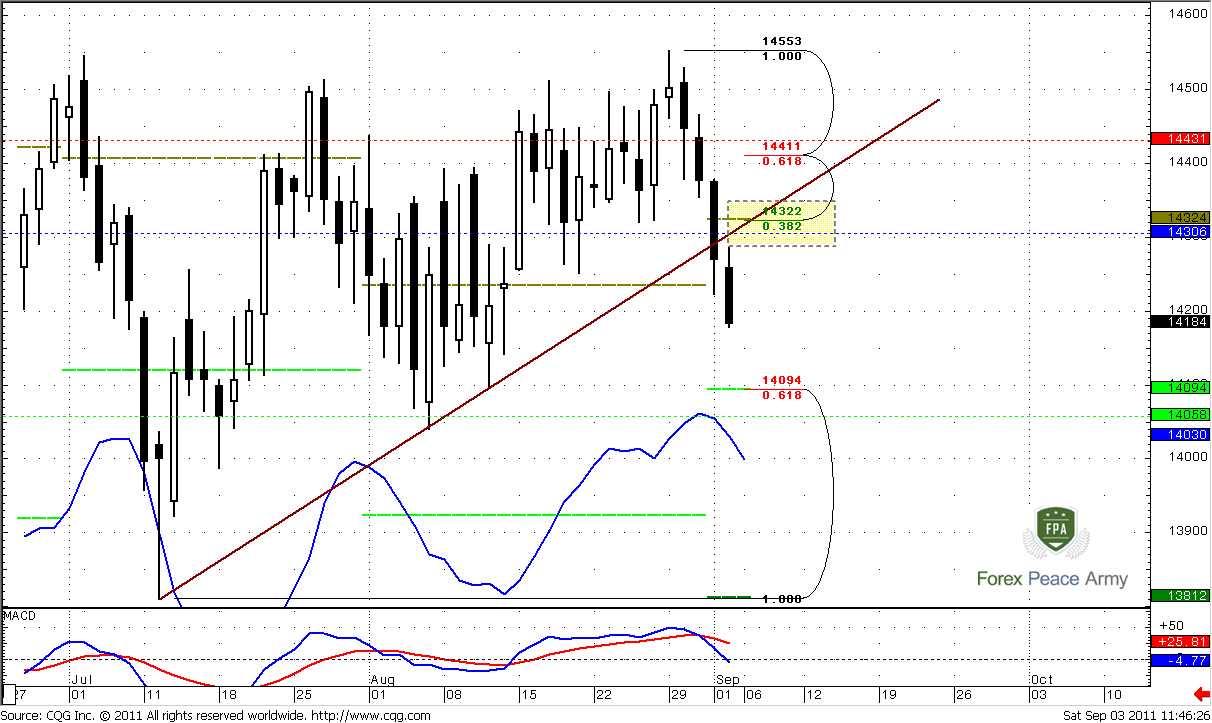
As we’ve said applying of this time frame is purely technical – just to estimate where we can enter short, since we already know our context for trading. So, what do we have here? Market has broken two consecutive daily confluence support areas one by one without any respect. This is the sign of real bears’ strength. Just below the market there are no strong supports. Next support stands at 1.41 – 0.618 major Fib support and monthly support1. Till that area market is relatively unlimited. Also it is not at oversold, so it gives us conclusion that down move will continue. So, where to enter?
Personally I like nearest Fib resistance 1.4320 area for many reasons. First, daily and weekly trends are bearish, market not at oversold as on daily as on weekly, market not at strong support – retracement, probably will be shallow, if it will be at all…
Second, this area also includes monthly pivot, trend line resistance and weekly pivot for coming week 1.4306. Also this area is very close to former daily Confluence resistance at 1.4270 – that will give additional protection.
Third, applying this area will give us excellent possibility to place stop. Safer stop should be placed above 1.4430 – 0.618 resistance and weekly pivot resistance. But, logically, market should not move above 1.4320. We see that bears are strong, so moving above that area will lead market above pivot and above trend line again – that is not support bearish bias. So, we can place stop even somewhere above 1.4350 I suppose. More precise we will say, when and If retracement will start.
4-hour
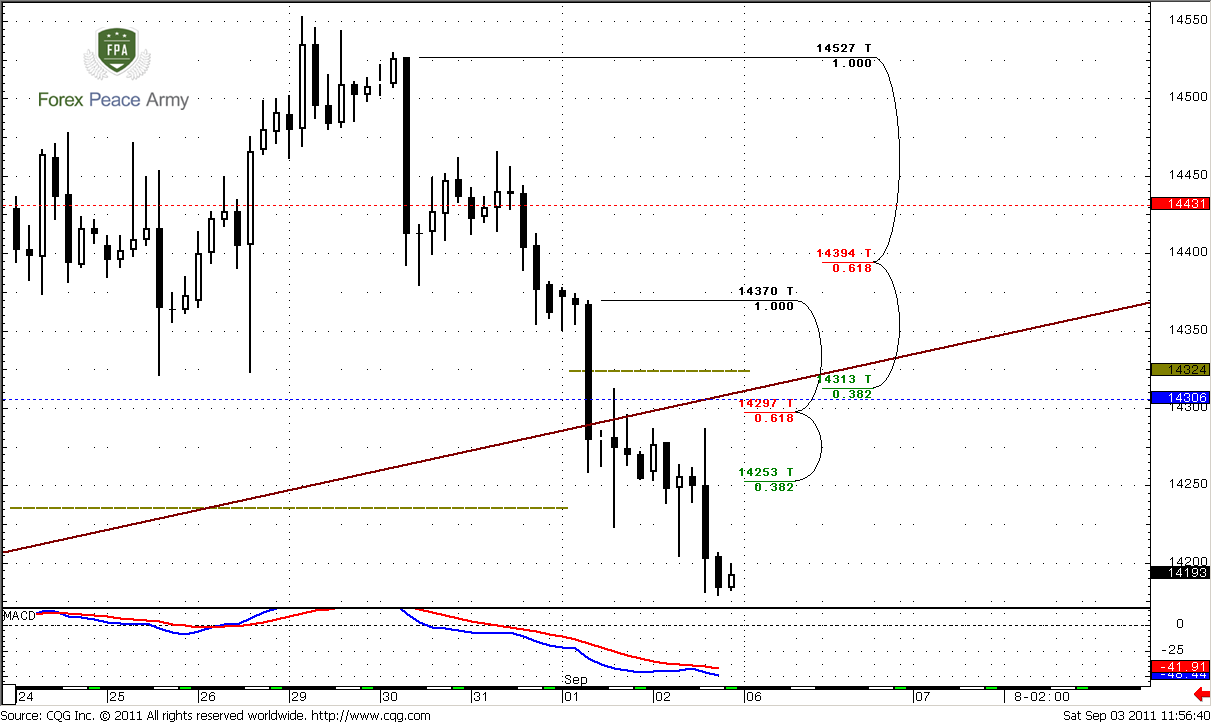
Here we see just some additional details. Trend holds bearish, that is in our favor. Also we can see that 1.4297-1.4313 is hidden Confluence resistance area, since it based on thrusting bars reaction points. That makes this area even more attractive.
1-hour
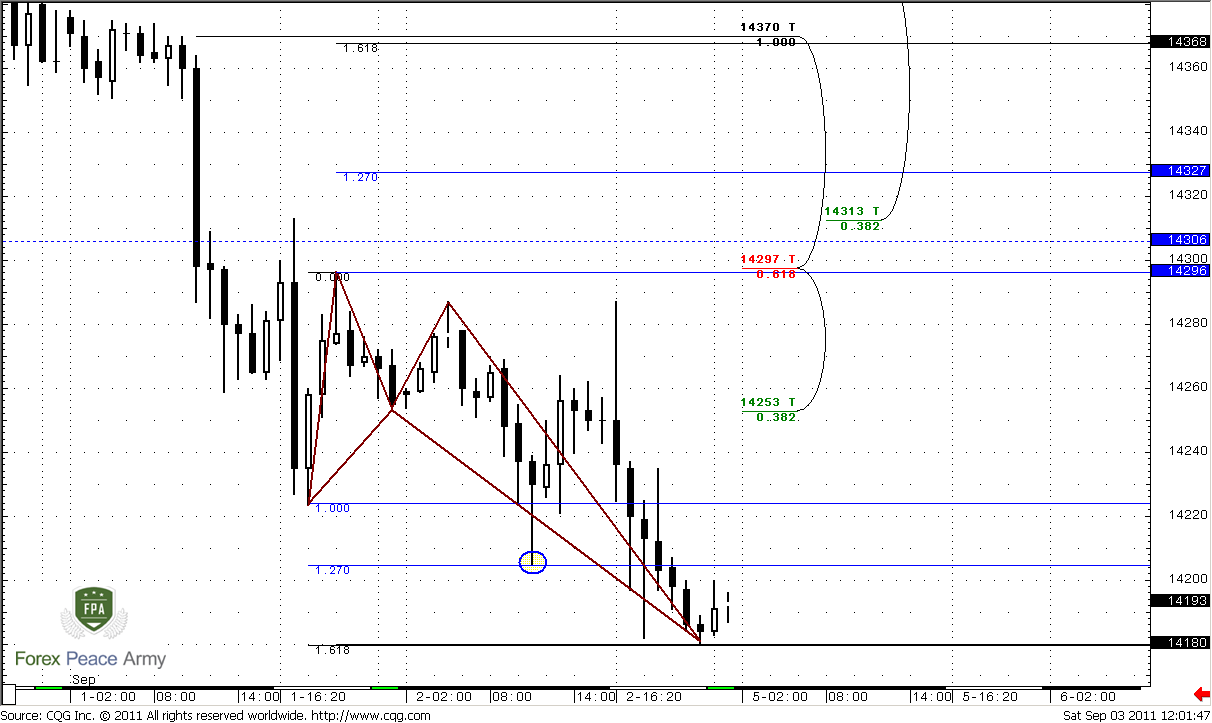
Hourly chart shows one of possible scenarios of retracement. The reason could be this Butterfly “Buy” pattern. Market has reached right 1.618 extension on Friday. The target of this butterfly is 1.27 at 1.4327 – 4 pips higher than our daily 3/8 Fib resistance or 1.618 at 1.4368. Still, probably market will stop at 1.4327… If market will not start retracement up, it will tell that this butterfly has failed – market will have to pass down 40-50 pips more, before we can confirm that. In this case, probably market will continue move down without any retracement. In this case, you can try to enter short with nearest Fib resistance at shallow retracement on hourly time frame.
Conclusion:
Context for nearest week is down, and very probable that market could reach 1.3650-1.3760 Confluence support. So, on Monday keep an eye on - will retracement up start or not. If it will, then wait for 1.4320 area and look for Sell signals on 5-15 min chart to enter short. If it will not – be sure that butterfly fails (market should pass down 40-50 pips more) then try to enter short on nearest Fib resistance on hourly chart.
The technical portion of Sive's analysis owes a great deal to Joe DiNapoli's methods, and uses a number of Joe's proprietary indicators. Please note that Sive's analysis is his own view of the market and is not endorsed by Joe DiNapoli or any related companies.
Today I offer you to look at monthly chart from a bit another angle and not just repeat previous thoughts about butterfly, flag or pennant and their targets. Still those issues are still valid – I just do not want to repeat them again. If you do not quite remember them, you may just re-read previous weekly research.
First I would like to discuss current consolidation. I do not see such kind of price action for a long time already. Something like that was in 2008 – but it was shorter in time. From the one point of view it tells about market indecision, but from the other - market is building energy. We see some inside months here – June was inside month, so as August also inside one.
Meantime officially monthly time frame has bullish bias – trend holds bullish, price action, in general, supports it. Yes, market has turned to some consolidation, but what’s the problem? No problems. But what we have to keep an eye on, to react in time on possible change in market bias?
I suspect that upward board is obvious – 1.50-1.51. Breakout of it could lead market right to previous highs around 1.60. But what’s about lower border? To my mind this is 1.36 level, because breakout of just previous low at 1.3811 could lead to just W&R, since there is a strong Confluence support just below it – 1.3655-1.3760. Also, take a look that MACDP comes very close to it. It means that we can hit two hares just with single bullet. Now it stands at 1.3576, but in October it will move a bit higher. So, if market will break 1.36 – we will get two in one – breakout of strong monthly support (that already will confirm bear strength) and shift the trend bearish. That will be reversal.
Currently, I again keep an eye on 1.4276 high. We can see that during four consecutive months market has tried to move lower and close below that level but failed every time. Currently we see next attempt to do that. And if this will happen in September – that will be the first bell to aware of downward reversal.
Upward targets stand the same, although it might happen that we will not need them in nearest future. Still, nearest target stands at 1.5081 – just above the previous highs – this is 0.618 extension from most recent AB-CD pattern. Next area to watch is 1.5272, but potentially it could turn to butterfly “Sell” pattern. The target of this pattern is 1.27 extension at 1.6027. Also it almost coincides with 1.27 target of bullish AB-CD at 1.5925 and with 1.0 Fib extension of most recent smaller AB-CD. From classical standpoint upward move should be equal to the mast of the pennant – that is 1.5866 area.
Weekly
When you will take a look at weekly chart, you will understand why I’ve told much about important levels on monthly time frame. Also you will see amazing structure and logic that could give us technical analysis. Remember what we’ve discussed on previous week – right, potential bullish dynamic pressure, since market has formed consecutive higher lows and does not support bear trend. The logical finish of such pattern as bullish dynamic pressure is trend shifting to bullish side. Now let’s see what market has shown to us…
Right, quite opposite signal is – bearish stop grabber right at 0.618 Fib resistance and Agreement. Do you see outstanding structure and logic? Market gives you absolutely clear pattern right at the moment when you expect some solution, some clue. In fact, weekly chart helps us much, since it gives us context at least for the whole nearest week or may be two, and that context is “down”. Keeping this signal, we have to use daily and intraday charts just to estimate an area where we can enter “short”. That’s the real beauty… Additional bearishness comes from bearish W&R – we’ve discussed that in daily updates and videos. The point is that previous week’s high has cleared out all previous highs above 1.45. But then market has returned right below it. By the way, if you remember, that was due daily bullish stop grabber…
So, I just want to remind you, that minimum target of bearish Stop grabber is previous lows at 1.3811. Since market has to exceed it, probably it will reach confluence support at 1.3650-1.3760. 1.4140 is not a Fib support any more, since it has been broken already. Weekly chart is not at oversold, so this target is quite reachable. Situation becomes really hot. Couple weeks ago we already have traded stop grabber – you can find it by yourself, I suppose, and it has worked well. Particularly due to this pattern market renewed the lows and formed 1.3811 level.
The failure point is 1.4550 area – the high of Stop grabber’s bar. IF market will exceed it and close above it, then this pattern will be treated as failed.
Daily
As we’ve said applying of this time frame is purely technical – just to estimate where we can enter short, since we already know our context for trading. So, what do we have here? Market has broken two consecutive daily confluence support areas one by one without any respect. This is the sign of real bears’ strength. Just below the market there are no strong supports. Next support stands at 1.41 – 0.618 major Fib support and monthly support1. Till that area market is relatively unlimited. Also it is not at oversold, so it gives us conclusion that down move will continue. So, where to enter?
Personally I like nearest Fib resistance 1.4320 area for many reasons. First, daily and weekly trends are bearish, market not at oversold as on daily as on weekly, market not at strong support – retracement, probably will be shallow, if it will be at all…
Second, this area also includes monthly pivot, trend line resistance and weekly pivot for coming week 1.4306. Also this area is very close to former daily Confluence resistance at 1.4270 – that will give additional protection.
Third, applying this area will give us excellent possibility to place stop. Safer stop should be placed above 1.4430 – 0.618 resistance and weekly pivot resistance. But, logically, market should not move above 1.4320. We see that bears are strong, so moving above that area will lead market above pivot and above trend line again – that is not support bearish bias. So, we can place stop even somewhere above 1.4350 I suppose. More precise we will say, when and If retracement will start.
4-hour
Here we see just some additional details. Trend holds bearish, that is in our favor. Also we can see that 1.4297-1.4313 is hidden Confluence resistance area, since it based on thrusting bars reaction points. That makes this area even more attractive.
1-hour
Hourly chart shows one of possible scenarios of retracement. The reason could be this Butterfly “Buy” pattern. Market has reached right 1.618 extension on Friday. The target of this butterfly is 1.27 at 1.4327 – 4 pips higher than our daily 3/8 Fib resistance or 1.618 at 1.4368. Still, probably market will stop at 1.4327… If market will not start retracement up, it will tell that this butterfly has failed – market will have to pass down 40-50 pips more, before we can confirm that. In this case, probably market will continue move down without any retracement. In this case, you can try to enter short with nearest Fib resistance at shallow retracement on hourly time frame.
Conclusion:
Context for nearest week is down, and very probable that market could reach 1.3650-1.3760 Confluence support. So, on Monday keep an eye on - will retracement up start or not. If it will, then wait for 1.4320 area and look for Sell signals on 5-15 min chart to enter short. If it will not – be sure that butterfly fails (market should pass down 40-50 pips more) then try to enter short on nearest Fib resistance on hourly chart.
The technical portion of Sive's analysis owes a great deal to Joe DiNapoli's methods, and uses a number of Joe's proprietary indicators. Please note that Sive's analysis is his own view of the market and is not endorsed by Joe DiNapoli or any related companies.
")