Sive Morten
Special Consultant to the FPA
- Messages
- 18,617
same with me. . Although the double top was evident loss of opportunity is better than loss of capital as Master Dinapoli says. When in doubt stay out and for sure I was in doubt.
You know, guys, such events as today don't stop to surprise me.
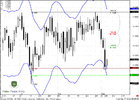
How could I know about SNB and all this stuff. But take a look - our trading plan has worked! Market has hit 1.42 and really continue move down. THis is stunning...
Of cause I also very often stay aside, even when I have detailed trading plan. If somehow you have not entered yet and just want to do it, then you get something like today's SNB action - you decide to sit on your hand, since it's a bit scared and it seems that there is too much risk...
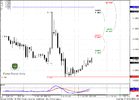
But technical analysis very often could predict some fundamental events. That is what surprise me again and again, especially if we will think about it from a bit longer-term view. For instance from weekly chart. We have clear short signal (stop grabber) during week end already! Is it not amazing?