Sive Morten
Special Consultant to the FPA
- Messages
- 18,648
Since we’ve discussed ECB and Fed QE-type programms in previous research, here I would like to add just few comment on M. Draghi speech. In fact, investors have got “aggresive” variant that is supportive for EUR. ECB has held rate and announce unlimited buyback of Spain and Italy sovereign debt. On the eve of ECB meeting we’ve said that if these two points will be announced that EUR could show significant appreciation and that is happening. Due to this, let’s call it hawkish decision, I can’t exclude EUR upward trend continuation in medium term perspective. But this appreciation is a bit fregile right now, because there is a significant difference in overall macroeconomic situation in US and EU, especially in terms of inflation. Take a look, while US has anemic inflation after injection of 2.3 Trln USD, EU already has inflation above 2% on the eve of starting QE. If inflation will increase pace it will become huge problem. Second, EUR/USD dynamic could become really sophisticated if Fed after current pause will decide to start QE III. But this is a farer future.
Monthly
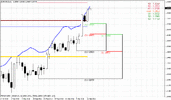
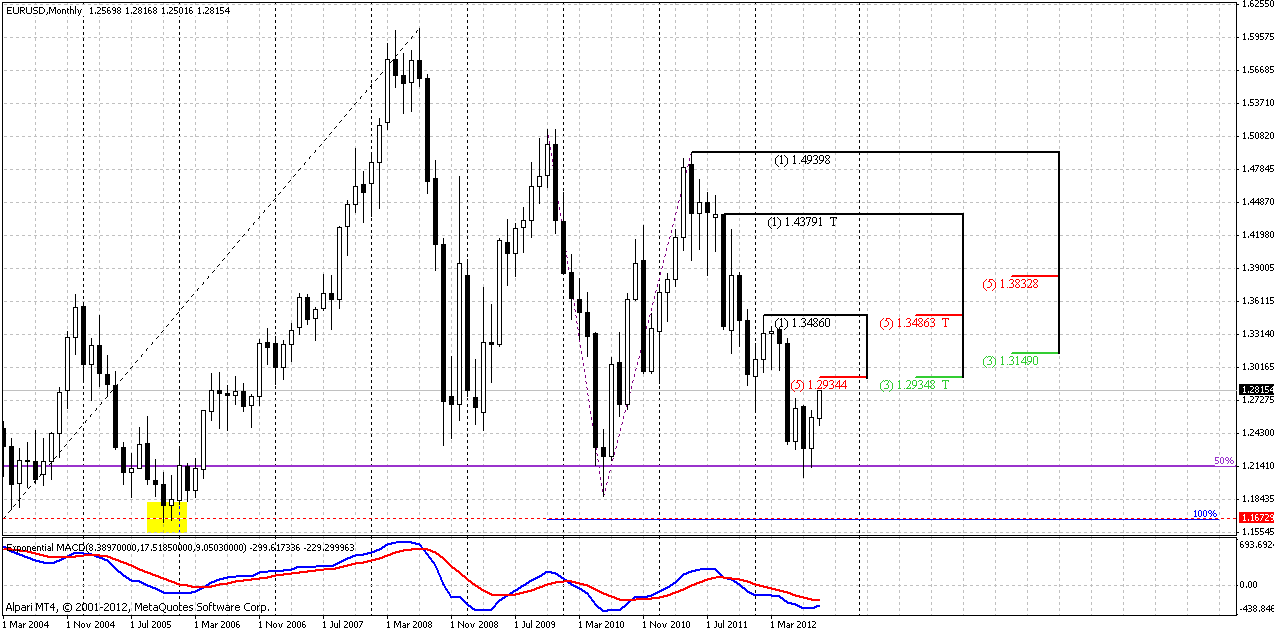
Monthly trend holds bearish and market has passed through first Fib resistance level – 1.26 (I do not have it on this chart). As we’ve said previously, next significant resistance level is 1.2930-1.3150 Confluence resistance. Still, if even market will reach it – it will not erase bearish context, since trend will remain bearish. But if upward move will continue – that probably could force as to review long-term targets of 1.16. Again, as it was in 2008 and 2010 market has bounced from all-time 50% support level. For us important is that we see nice recovery from monthly support and next resistance is 200 pips higher. So, market has no barriers from monthly time frame right now.
Weekly
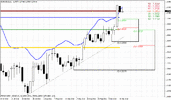
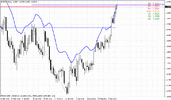
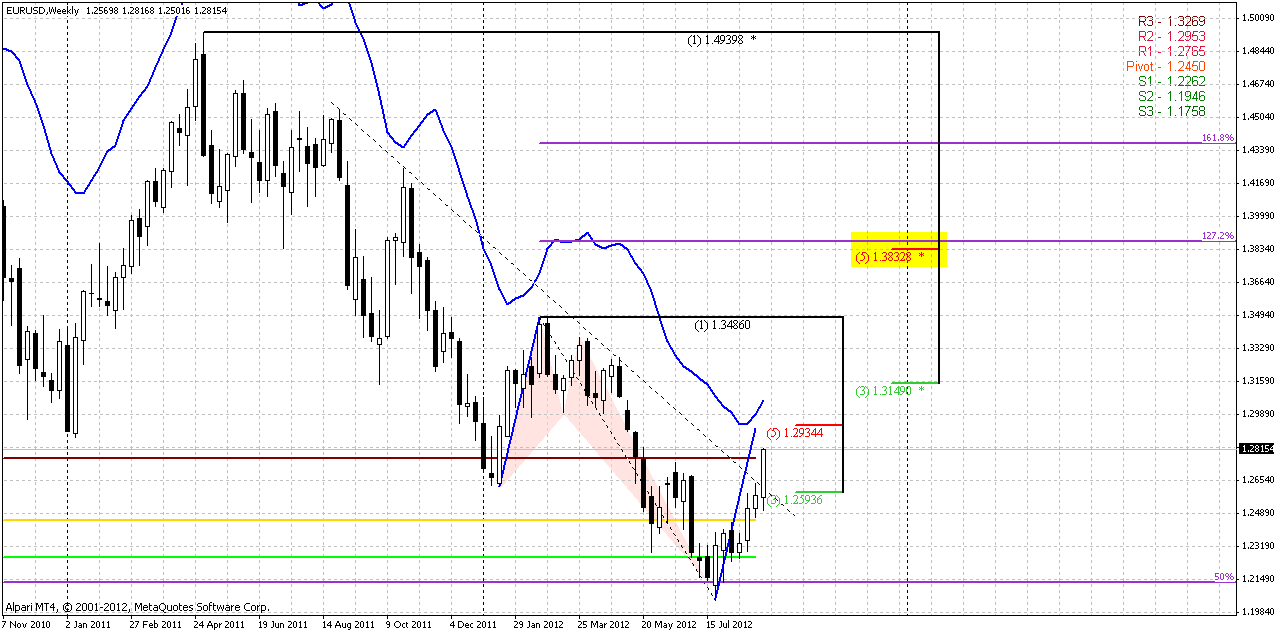
Here we have a lot of bullish signs. Trend is bullish as well. First is take a look that market has moved above Monthly Pivot Resistance 1. This could be a first bell of medium term reversal, since retracements usually holds by pivot resistance 1. Second, market has broken through long-term channel upper border. But what is most important – current swing up exceeds previous move down and breaks above previous low. All this stuff has been anticipated by butterfly “Buy” pattern.
So, we have bullish reversal that confirmed by multiple factors. What about targets? Nearest target, as we’ve said is K-resistance area 1.2930-1.3150, that is also weekly overbought. Also if we will take into consideration harmonic swings, then we will see, that previous retracement depth, dragged to current moment points on the same K-area.
In longer term perspecive, I would like to offer you a bit brave look at potential target. What if it will be 1.27 ultimate butterfly target? It stands in agreement with major 0.618 Fib resistance at 1.3833. Still for coming week, or may be for two weeks nearest area to watch is K-resistance.
Daily
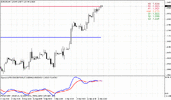
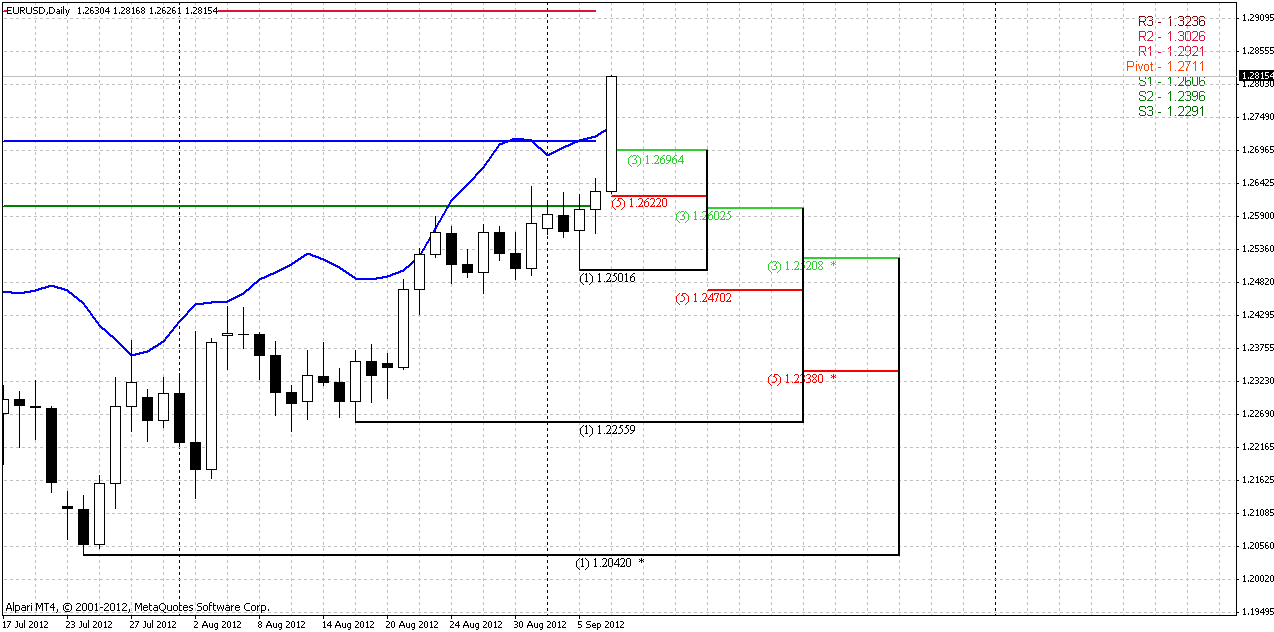
Although on Friday I’ve said that EUR should show smooth upward continuation, but non farm payrolls release has done its deed and pair has skyrocketed above 1.28. So, no doubt that we see strong bullish context that also is confirmed by upper time frames. We do not have any bearish directional patterns here, so our context is bullish and we should search possibility for long entry here.
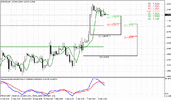
Still, as you can see market has pierced significantly an overbought line. In such circumstances I always recommend to wait a pullback and buy a deep. There are two levels that are suitable for that purpose. First is a fib support at 1.2696 that is also a WPP and a bit deeper Confluence support 1.2605-1.2622 that is also a WPS1=1.2606. Usually, when trend develops either WPP or WPS1 should hold it. If not – then it usually leads to deeper retracement or reversal. What particular level to take will depend on lower time frames, where we should get some signs or patterns of retracement first.
Take a look at WPR1=1.2921 - it stands very close to nearest K-resistance lower border.
4-hours
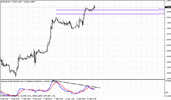
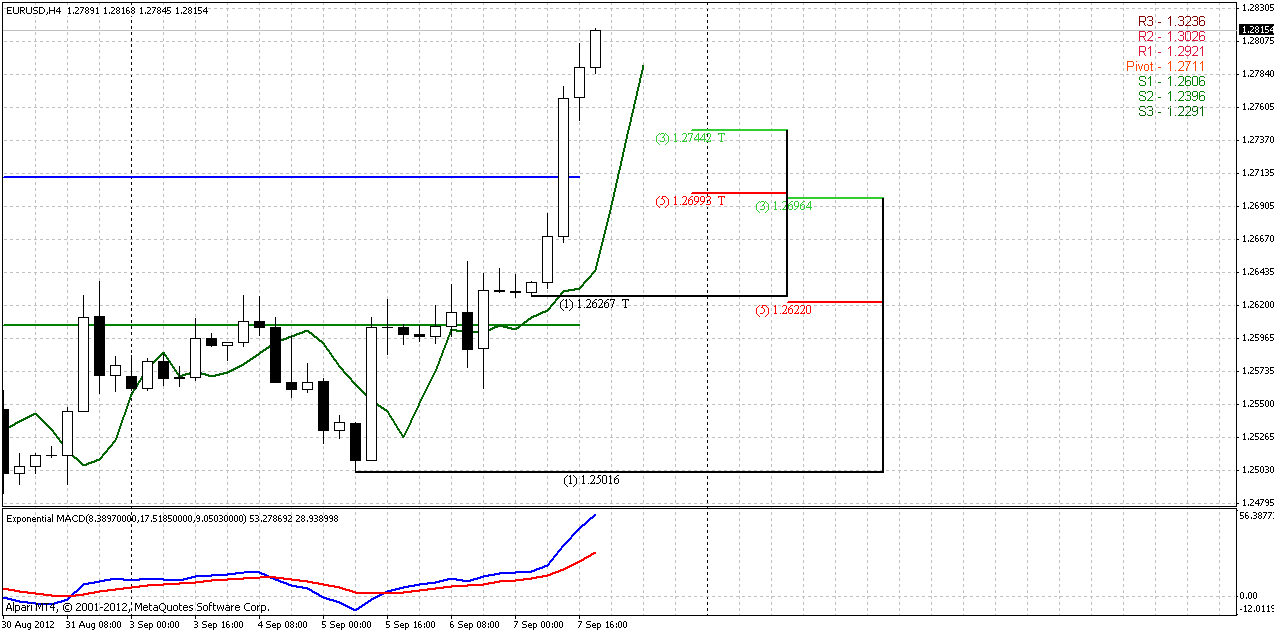
Trend here is strongly bullish as well as thrust up. Here we also can see that WPP is also a 4-hour Confluence support. Well at this chart we could get bullish B&B. Although thrust is not perfect in terms of shape, but it is supported by strong fundamental data and has minimum required number of bars. Retracement to 1.27 will give us bullish B&B. That is the first pattern to watch.
1-hour
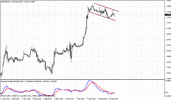
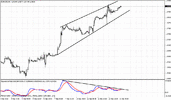
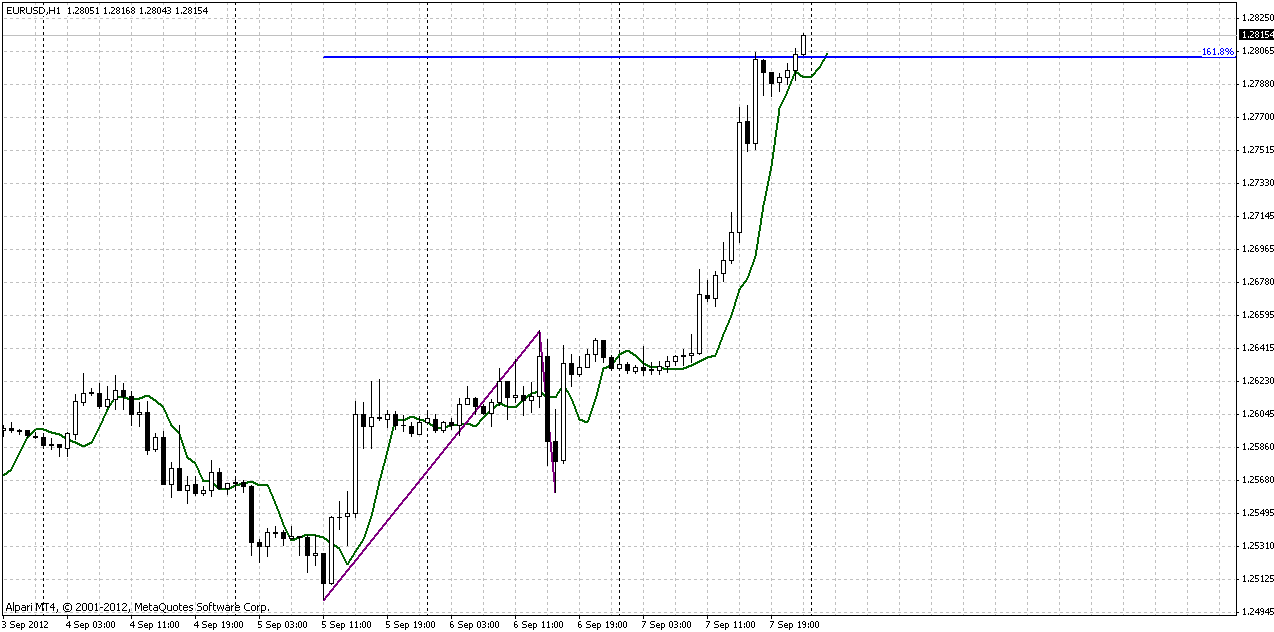
Here, on hourly chart market has hit 1.618 extension target of pre-ECB meeting AB=CD. That also could a context for DRPO “Sell”. Still, I do not see any reversal patterns yet, that could put a foundation for downward retracement. Probably they should appear on Monday.
Conclusion:
Long-term bearish sentiment still holds. Pullback that now in progress on monthly chart should not surprise us, if we take into consideration the level importance where this bounce has started. From long-term perspective, even move to 1.30 will not erase bearish context. But now this is more political and fundamental picture rather than pure technical one. Since long-term sentiment on EUR/USD will mostly be depend on ECB and Fed QE programs equilibrium, as well as macro statistic data – inflation for EU and employment for US.
Short-term perspective is bullish. Since market stands at overbought it’s better to use clear patterns to enter long and buy deeps. Nearest target is 1.2930-1.3150 resistance area.
The technical portion of Sive's analysis owes a great deal to Joe DiNapoli's methods, and uses a number of Joe's proprietary indicators. Please note that Sive's analysis is his own view of the market and is not endorsed by Joe DiNapoli or any related companies.
Monthly
Monthly trend holds bearish and market has passed through first Fib resistance level – 1.26 (I do not have it on this chart). As we’ve said previously, next significant resistance level is 1.2930-1.3150 Confluence resistance. Still, if even market will reach it – it will not erase bearish context, since trend will remain bearish. But if upward move will continue – that probably could force as to review long-term targets of 1.16. Again, as it was in 2008 and 2010 market has bounced from all-time 50% support level. For us important is that we see nice recovery from monthly support and next resistance is 200 pips higher. So, market has no barriers from monthly time frame right now.

Weekly
Here we have a lot of bullish signs. Trend is bullish as well. First is take a look that market has moved above Monthly Pivot Resistance 1. This could be a first bell of medium term reversal, since retracements usually holds by pivot resistance 1. Second, market has broken through long-term channel upper border. But what is most important – current swing up exceeds previous move down and breaks above previous low. All this stuff has been anticipated by butterfly “Buy” pattern.
So, we have bullish reversal that confirmed by multiple factors. What about targets? Nearest target, as we’ve said is K-resistance area 1.2930-1.3150, that is also weekly overbought. Also if we will take into consideration harmonic swings, then we will see, that previous retracement depth, dragged to current moment points on the same K-area.
In longer term perspecive, I would like to offer you a bit brave look at potential target. What if it will be 1.27 ultimate butterfly target? It stands in agreement with major 0.618 Fib resistance at 1.3833. Still for coming week, or may be for two weeks nearest area to watch is K-resistance.

Daily
Although on Friday I’ve said that EUR should show smooth upward continuation, but non farm payrolls release has done its deed and pair has skyrocketed above 1.28. So, no doubt that we see strong bullish context that also is confirmed by upper time frames. We do not have any bearish directional patterns here, so our context is bullish and we should search possibility for long entry here.
Still, as you can see market has pierced significantly an overbought line. In such circumstances I always recommend to wait a pullback and buy a deep. There are two levels that are suitable for that purpose. First is a fib support at 1.2696 that is also a WPP and a bit deeper Confluence support 1.2605-1.2622 that is also a WPS1=1.2606. Usually, when trend develops either WPP or WPS1 should hold it. If not – then it usually leads to deeper retracement or reversal. What particular level to take will depend on lower time frames, where we should get some signs or patterns of retracement first.
Take a look at WPR1=1.2921 - it stands very close to nearest K-resistance lower border.

4-hours
Trend here is strongly bullish as well as thrust up. Here we also can see that WPP is also a 4-hour Confluence support. Well at this chart we could get bullish B&B. Although thrust is not perfect in terms of shape, but it is supported by strong fundamental data and has minimum required number of bars. Retracement to 1.27 will give us bullish B&B. That is the first pattern to watch.

1-hour
Here, on hourly chart market has hit 1.618 extension target of pre-ECB meeting AB=CD. That also could a context for DRPO “Sell”. Still, I do not see any reversal patterns yet, that could put a foundation for downward retracement. Probably they should appear on Monday.

Conclusion:
Long-term bearish sentiment still holds. Pullback that now in progress on monthly chart should not surprise us, if we take into consideration the level importance where this bounce has started. From long-term perspective, even move to 1.30 will not erase bearish context. But now this is more political and fundamental picture rather than pure technical one. Since long-term sentiment on EUR/USD will mostly be depend on ECB and Fed QE programs equilibrium, as well as macro statistic data – inflation for EU and employment for US.
Short-term perspective is bullish. Since market stands at overbought it’s better to use clear patterns to enter long and buy deeps. Nearest target is 1.2930-1.3150 resistance area.
The technical portion of Sive's analysis owes a great deal to Joe DiNapoli's methods, and uses a number of Joe's proprietary indicators. Please note that Sive's analysis is his own view of the market and is not endorsed by Joe DiNapoli or any related companies.
