Sive Morten
Special Consultant to the FPA
- Messages
- 18,654
Hi Sive,
thanks as usual for ur analysis. pls i have these questions for you.
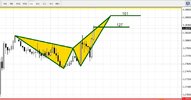
1.If patterns (harmonic & charts) are in contrast with a shift in trend by MACD, will you consider patterns to overrule trend shift?
2.If K-Area ranges between 100-150pips in higher time frame e.g. monthly, weekly & daily. will you still consider the range as K-Area? because after I analyse GBP/USD I discover the above questions. thanks.
Hi Ochills,
1. Lower time frame patterns are likely will be opposite to trend, since they are the first sign of retracement/reversal. Step sequence is as follows:
a) find a solid area of support/resistance with or w/o overbought/oversold, that you intends to use as entry level;
b) Monitor it. If you will get patterns that signal the same direction as you've suggested you may try to enter. Here you can either wait when intraday trend will confirm the pattern or stick to pattern per se. This is a bit different risk, different risk/reward ratio etc.
c) Be sure that daily trend will confirm your entry.
That is if you want to trade trend combining with entry based on patterns.
But you also could trade just patterns. In this case you act as it was described in Forex Military School.
2. IF you mean how to combine say monthly K-area and daily trading, then you can use higher time frame K-areas as directional pattern (DiNapoli tells about it in his book BTW). Hence, you should be ready that some daily reversal pattern should appear somewhere around or inside monthly or weekly K-area.

