Sive Morten
Special Consultant to the FPA
- Messages
- 18,664
Monthly
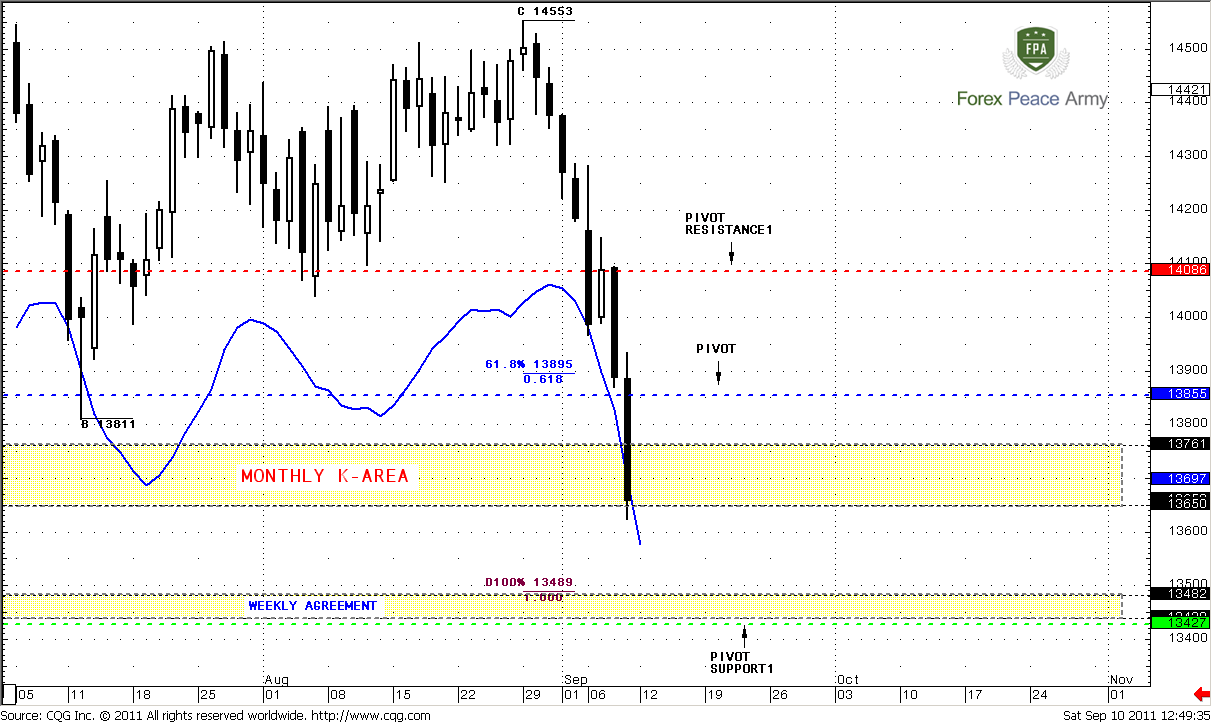
Our suspicions that we are shared with you during previous month finally have had some force and com to life. Particularly I was worried that market couldn’t continue move up forming the flag pattern and showing very shallow retracement down. Market freezing at same place for a long time made me thinks that something is wrong. 100% confirmation we’ve got by previous week stop grabber. Here I want to mark importance of high time frame analysis – it really could give you context for a whole week!
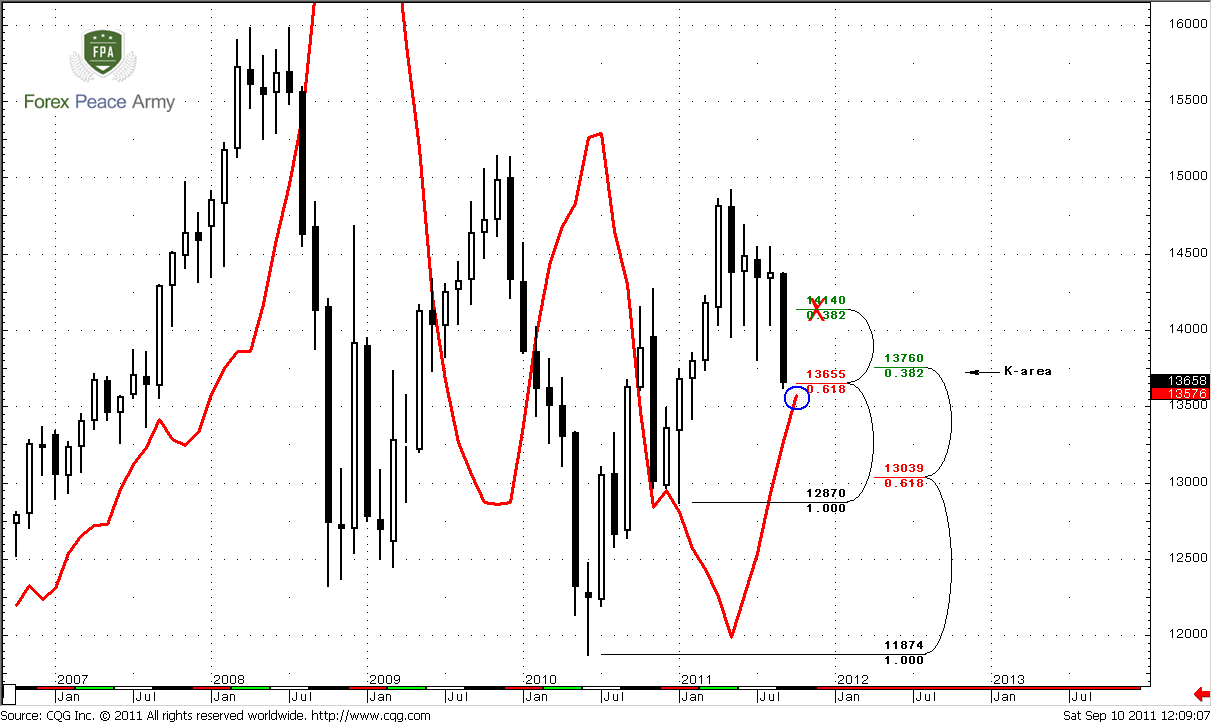
Ok, let’s take a look what we have now. First is solid plunge down – that’s obvious. Monthly trend still stands bullish, market not at oversold. There are two significant moments that I would like to discuss today. One of them is not so crucial currently - I suppose it will be important in medium term, probably in October. This is MACDP indicator (red line) that comes in play and moves very close to current price action. Currently market stands a bit far from it, but in October there will raise the real possibility of monthly trend shifting. We will keep a close eye on it definitely.
Second thing is extremely important for nearest 1-2 weeks. This is monthly Confluence support 1.3650-1.3760, or as it calls sometimes K-area. You may ask what a big deal with it? Answer is “monthly K-area”. Since this is monthly strong support it could be some kind of directional indicator for lower time frames, such as weekly or daily. Existing of support such kind of strength could lead to solid bouncing on daily time frame, even if on monthly chart it will remain invisible. Also do not forget that monthly levels are rather wide, they are not just 1.3650 pips-to pips but more as some area. And this gives us huge advance for week ahead. We know particularly where to search for Buy signals.
We will not speak about upward targets again, since they are not so important right now on monthly chart. Still, I just want to remind that probably we should treat 1.3550-1.36 area as crucial point for this time frame. If market will move below it then our long-term context will turn bearish. 1.4140 is no more the Fib support. Next fib support below K-area is major 1.3039 level.
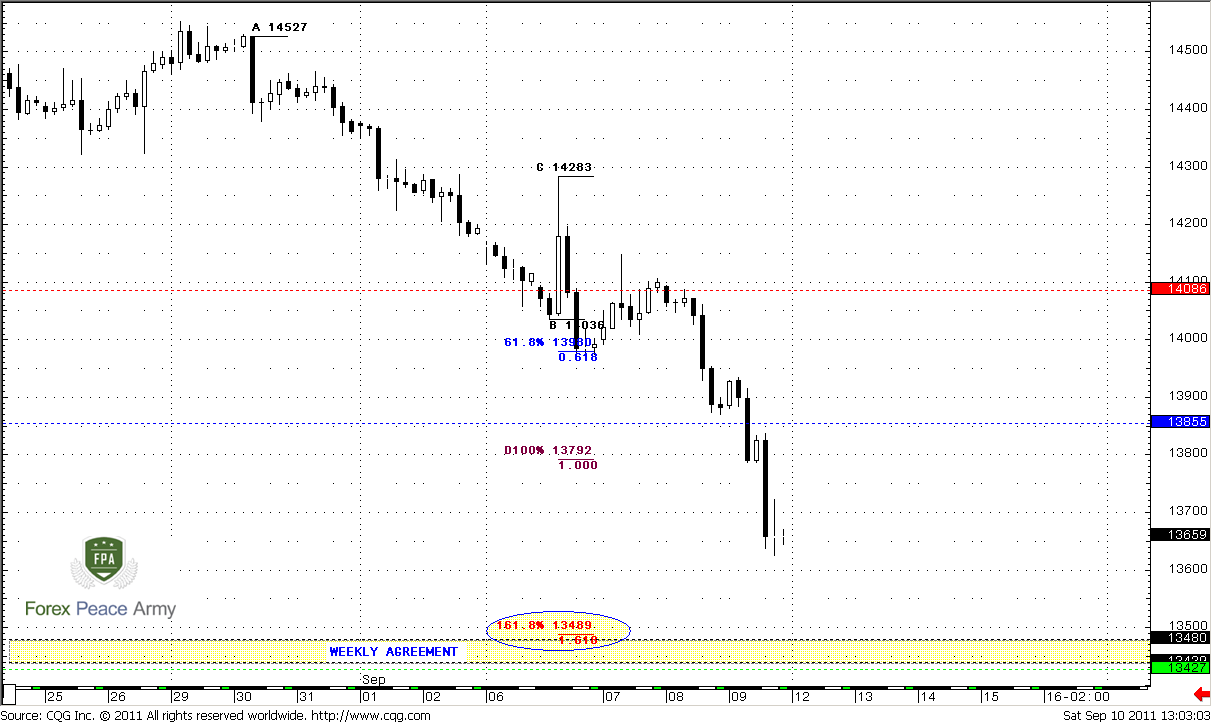
Weekly
Trend here is bearish, so as price action. You can see the result of Stop grabber acting – our target has been successfully reached. So, the question is what to do next…
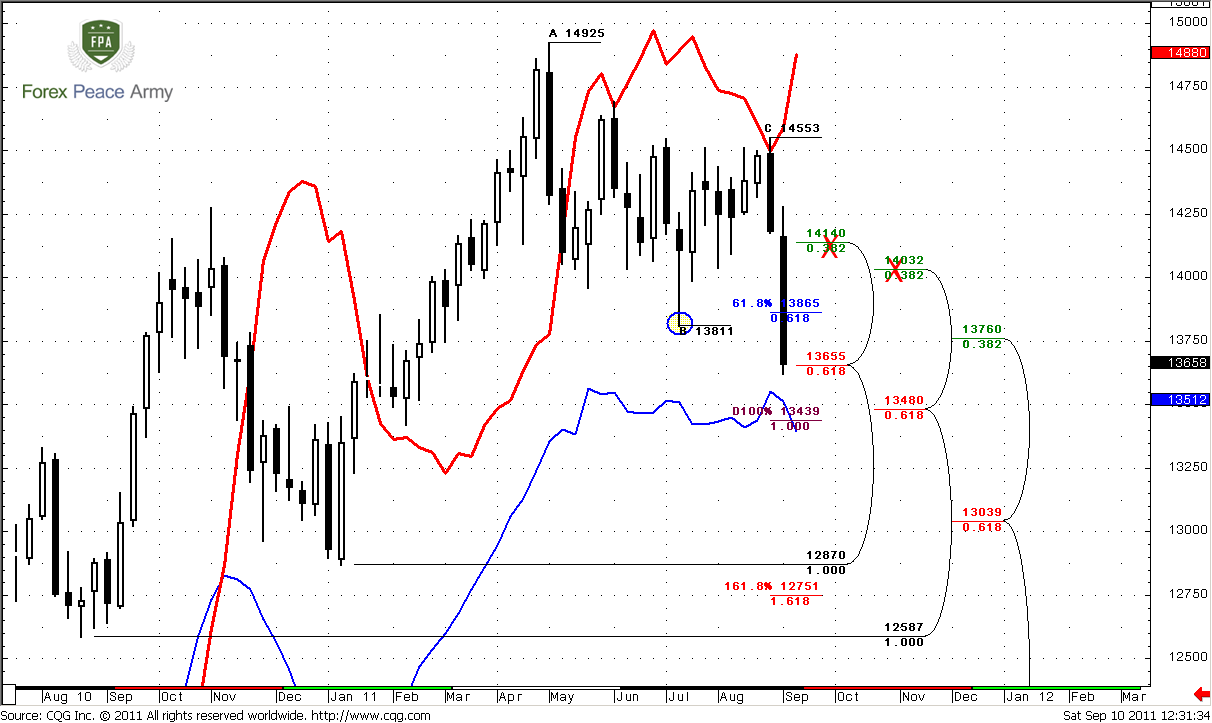
Here you can see why I speak about monthly K-area as of wide range. Just under 1.3650-1.3760 level stands minor 0.618 Fib support 1.3480 that we can’t see on monthly chart. But particularly this support will become a key to our analysis. Take a look at ABC-top pattern – market has totally disrespected 0.618 target and is moving right 1.0 Fib extension at 1.3439. This level creates at Agreement with 1.4380 Fib support. Also this level is very close to weekly oversold that is 1.34 for coming week. The conclusion is that despite the fact that this 1.34-1.3480 area stands below monthly K-area, it should be treated as single support range, since breakout of K-area just for 100 pips on monthly chart is nothing. Still weekly chart gives us information where particularly we should expect appearing of support, and where is the most probable starting point of retracement stands.
That’s being said, reaching of 1.34-1.35 area will not mean that monthly K-area does not influence the market anymore, this is just some kind of specification – where specifically around K-area we should expect support. The answer is – 1.3440-1.3480 area.
Daily
Daily trend is extremely bearish. We see that market stands at oversold right inside monthly K-area. It’s very difficult to make prediction at what particular moment the spring of oversold will become stronger and push market back. It could happen earlier or later. For as the major question is: will market reach Agreement area before pullback or it will show some small bouncing first? So we need twofold plan. Let’s see…
Our advantage here is that market has not reached the 1.0 target yet. So it has passed 0.618 extension, but not quite reach 1.0. This tells us that if even market will start some bouncing due oversold condition, this bouncing should not be too deep, like it was 2 days ago – see single white candle during this black down move? Market also has hit oversold, but shown quite shallow retracement. This could happen again. So, my preferable area to watch in that case is range between previous low and pivot point 1.3811-1.3855. If this retracement will take place – it will be temporary and shallow anyway, since market is tending to 1.0 target. This retracement probably could be used to enter short again.
If market will not show it and continue move right to 1.3440-1.3480 that will be our area to watch for buy signals and patterns and close short positions.
4-hour
Trend is bearish, no sign of retracement yet. Still here is additional important detail. Look at AB-CD pattern. Market has passed 1.0 extension already, but keep attention where 1.618 stands – right at the area of weekly Agreement. This gives us more confidence to search for Buy signals there.
Conclusion:
Although market shows really strong move down, it has reach significant support level. Area to watch for medium term reversal is 1.3440-1.3480. If suddenly market will show upward bouncing on daily time frame to 1.38-1.3850 area probably we may use to enter short.
The technical portion of Sive's analysis owes a great deal to Joe DiNapoli's methods, and uses a number of Joe's proprietary indicators. Please note that Sive's analysis is his own view of the market and is not endorsed by Joe DiNapoli or any related companies.
Our suspicions that we are shared with you during previous month finally have had some force and com to life. Particularly I was worried that market couldn’t continue move up forming the flag pattern and showing very shallow retracement down. Market freezing at same place for a long time made me thinks that something is wrong. 100% confirmation we’ve got by previous week stop grabber. Here I want to mark importance of high time frame analysis – it really could give you context for a whole week!
Ok, let’s take a look what we have now. First is solid plunge down – that’s obvious. Monthly trend still stands bullish, market not at oversold. There are two significant moments that I would like to discuss today. One of them is not so crucial currently - I suppose it will be important in medium term, probably in October. This is MACDP indicator (red line) that comes in play and moves very close to current price action. Currently market stands a bit far from it, but in October there will raise the real possibility of monthly trend shifting. We will keep a close eye on it definitely.
Second thing is extremely important for nearest 1-2 weeks. This is monthly Confluence support 1.3650-1.3760, or as it calls sometimes K-area. You may ask what a big deal with it? Answer is “monthly K-area”. Since this is monthly strong support it could be some kind of directional indicator for lower time frames, such as weekly or daily. Existing of support such kind of strength could lead to solid bouncing on daily time frame, even if on monthly chart it will remain invisible. Also do not forget that monthly levels are rather wide, they are not just 1.3650 pips-to pips but more as some area. And this gives us huge advance for week ahead. We know particularly where to search for Buy signals.
We will not speak about upward targets again, since they are not so important right now on monthly chart. Still, I just want to remind that probably we should treat 1.3550-1.36 area as crucial point for this time frame. If market will move below it then our long-term context will turn bearish. 1.4140 is no more the Fib support. Next fib support below K-area is major 1.3039 level.
Weekly
Trend here is bearish, so as price action. You can see the result of Stop grabber acting – our target has been successfully reached. So, the question is what to do next…
Here you can see why I speak about monthly K-area as of wide range. Just under 1.3650-1.3760 level stands minor 0.618 Fib support 1.3480 that we can’t see on monthly chart. But particularly this support will become a key to our analysis. Take a look at ABC-top pattern – market has totally disrespected 0.618 target and is moving right 1.0 Fib extension at 1.3439. This level creates at Agreement with 1.4380 Fib support. Also this level is very close to weekly oversold that is 1.34 for coming week. The conclusion is that despite the fact that this 1.34-1.3480 area stands below monthly K-area, it should be treated as single support range, since breakout of K-area just for 100 pips on monthly chart is nothing. Still weekly chart gives us information where particularly we should expect appearing of support, and where is the most probable starting point of retracement stands.
That’s being said, reaching of 1.34-1.35 area will not mean that monthly K-area does not influence the market anymore, this is just some kind of specification – where specifically around K-area we should expect support. The answer is – 1.3440-1.3480 area.
Daily
Daily trend is extremely bearish. We see that market stands at oversold right inside monthly K-area. It’s very difficult to make prediction at what particular moment the spring of oversold will become stronger and push market back. It could happen earlier or later. For as the major question is: will market reach Agreement area before pullback or it will show some small bouncing first? So we need twofold plan. Let’s see…
Our advantage here is that market has not reached the 1.0 target yet. So it has passed 0.618 extension, but not quite reach 1.0. This tells us that if even market will start some bouncing due oversold condition, this bouncing should not be too deep, like it was 2 days ago – see single white candle during this black down move? Market also has hit oversold, but shown quite shallow retracement. This could happen again. So, my preferable area to watch in that case is range between previous low and pivot point 1.3811-1.3855. If this retracement will take place – it will be temporary and shallow anyway, since market is tending to 1.0 target. This retracement probably could be used to enter short again.
If market will not show it and continue move right to 1.3440-1.3480 that will be our area to watch for buy signals and patterns and close short positions.
4-hour
Trend is bearish, no sign of retracement yet. Still here is additional important detail. Look at AB-CD pattern. Market has passed 1.0 extension already, but keep attention where 1.618 stands – right at the area of weekly Agreement. This gives us more confidence to search for Buy signals there.
Conclusion:
Although market shows really strong move down, it has reach significant support level. Area to watch for medium term reversal is 1.3440-1.3480. If suddenly market will show upward bouncing on daily time frame to 1.38-1.3850 area probably we may use to enter short.
The technical portion of Sive's analysis owes a great deal to Joe DiNapoli's methods, and uses a number of Joe's proprietary indicators. Please note that Sive's analysis is his own view of the market and is not endorsed by Joe DiNapoli or any related companies.
Last edited by a moderator: