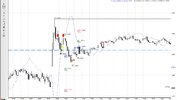
I have pretty much the same question that georgeta. If my guess is correct,she is talking about the candle that made W&R with a top around 1,3936 on the attached chart. .618 retracement should be, once again if i'm not wrong, point C in the chart at 1,3896.
The red arrows pointing down are the two shorts I've entered yesterday. the first once I took a small profit since I've realized I hadn't made any analisys at all to enter short and the second one I saw this AB CD possible pattern at a price level I considered too high for the current context. I took 50% profit at 1,3840 and moved stop to BE. then , unfortunately I've closed it at the price level of the last arrow pointing to the left.
Lucklyly I had the opportunity to re enter short today at 1,3820 , almost .382 retracement after touching K area at 1,38.
Edit: I want to add, it is not the context you used to enter at 1,3880 that I'm interested in, since you've shared it on daily update...BUT the particular SELL signal you used to enter short...was it the W&R we are talking about?
")