Sive Morten
Special Consultant to the FPA
- Messages
- 18,648
Monthly
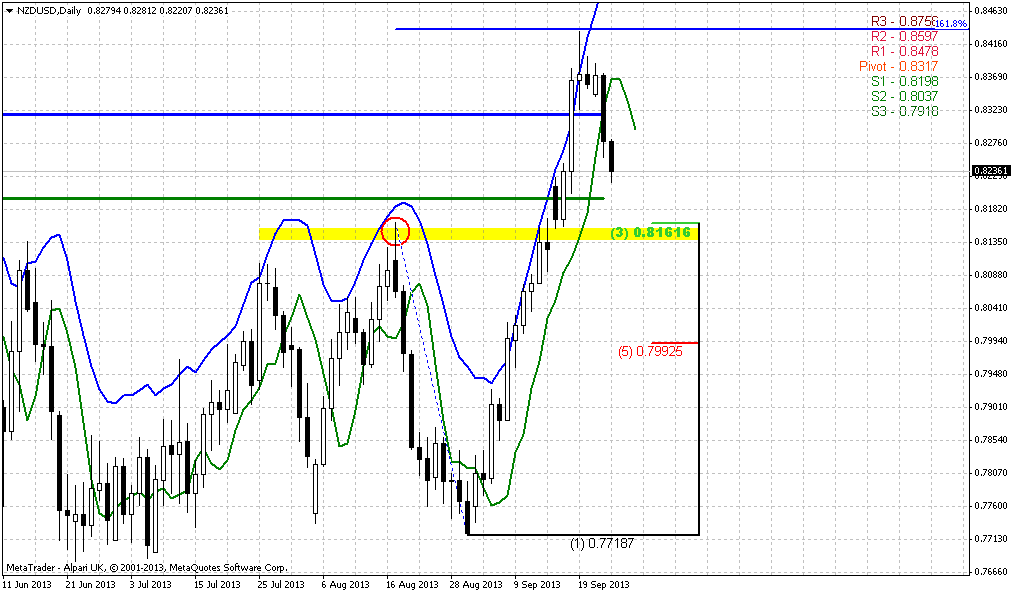
Well, as our medium target has been hit, now we again have to think what to do next. I’ve taken a look across the board on different pairs and didn’t find something significantly better than EUR. All pairs just has finished corresponding action and situation is very similar across them. NZD is still interesting, really huge upside potential and our long-term picture that we’ve discussed on previous week is still valid and now in progress. But, NZD at weekly overbought and some retracement is very probable. I do not exclude that we will take a look at kiwi with one of our daily updates, as soon as it will give us clear setup.
Now let’s go back to EUR. On passed week I’ve heard two intriguing comments. First is from FOMC about supporting of QE. Yes, in recent time we saw mostly moderate data rather than some good and really growing numbers, but still, as FOMC has spoken within a half of a year that it a bit worries for future inflation and that inflation could come out of controls, since now nobody knows how monthly 85 Bln inflow could impact on USD in the future – they has started to prepare market participants for gradual easing of QE program and that it’s contraction should started soon. But as they’ve said on Wed – “Hey, we will not start contraction and do not care about inflation, may be it will be strong and uncontrolled, but we do not know exaclty how it will be. At least currently we will continue our money printing”. It means that bubble on stock market will continue to grow and splash on gold market (although it could erased) confirms that this was a bit out of market expectation. Gold is dropping mostly due to anemic inflation and mostly due abscence of signs that inflation starts to alive. But this statement has awoke even this kind of gold market, some fears on possible inflation pressure have appeared even there.
Second comment concerns US debt ceil. Obama said that he has tired to bargain with Congress on Obamacare and debt ceil. Republicans said – “we will agree on debt ceil if we will see contraction of spending on obamacare”. Here is an article in FT Obama stands firm on refusal to negotiate over US debt ceiling - FT.com. All in all debt ceil rising is not a Obama’s whim, this is absolutely neccesary issue for country, at least in short term, but looks like senators do not understand this, they just continue to live and think by category of old hassle between republicans and democrates. Thus, Obama said – you do not want to rise debt ceil? No problem, I do not care about and why I should care. And in general, he’s right. He has not to explain cogressmen why it is important. Ceil will be reached by mid October and any nervousness will not stand in favor of USD. Besides, as I understand America does not show big success yet with budget savings. The plan was to reduce deficit for ~1.5 Bln by the end of this year (if I do not mess someting). Tax benefit period has ended, Health care reform demands a lot of money and Fed Reserve has confirmed of money printing. All these moments fundamentally are not positive for USD. But it’s a bit long-term picture.
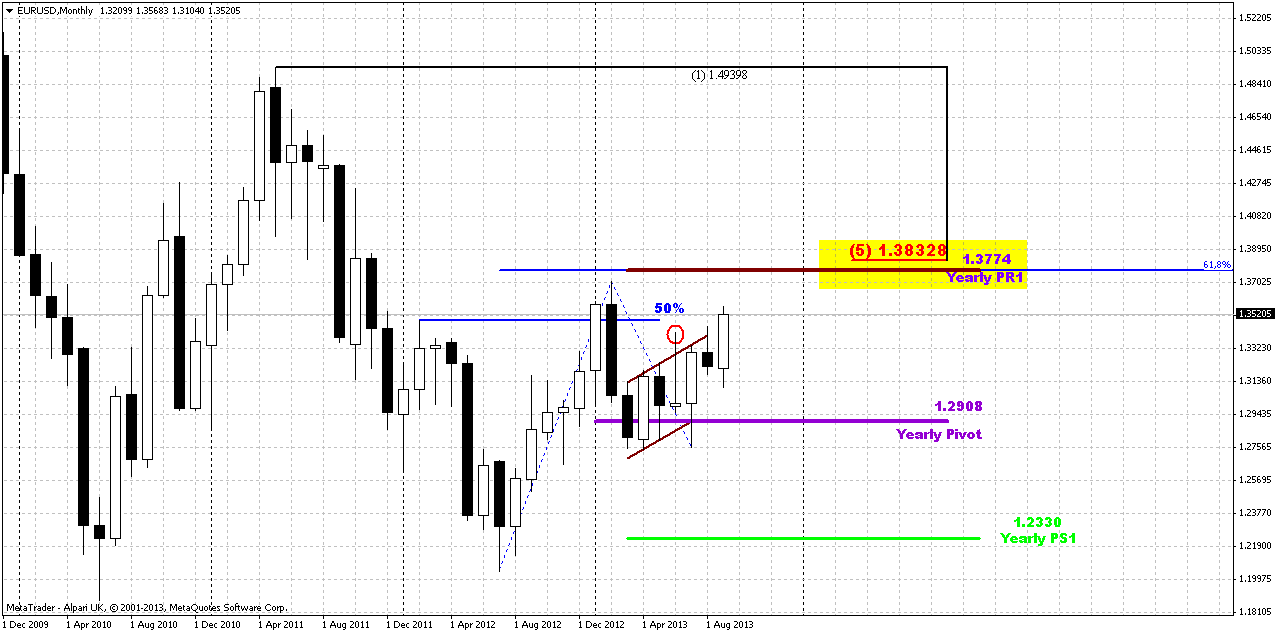
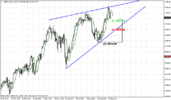
Now let’s shift to pure technical moments. Our riddle with flag consolidation stands very close to its resolving probably. On monthly chart we have two major moments. First is market has moved above previous high (in red circle). This is important not only because this is high per se, but also because this was a previous failure upward breakout of consolidation. And as market has move right back above it – this tells that this probably is real move at this time. Second – market stands above 50% resistance level that has stopped move up early. I do not know how it will turn, but at least now picture looks bullish. Next monthly target is 1.3775-1.3830 area. It includes yearly pivot resistance1, 5/8 Fib resistance and minor 0.618 extension target of current AB-CD up. Other words, we have an Agreement around YPR1. Trend holds bullish here.
Weekly
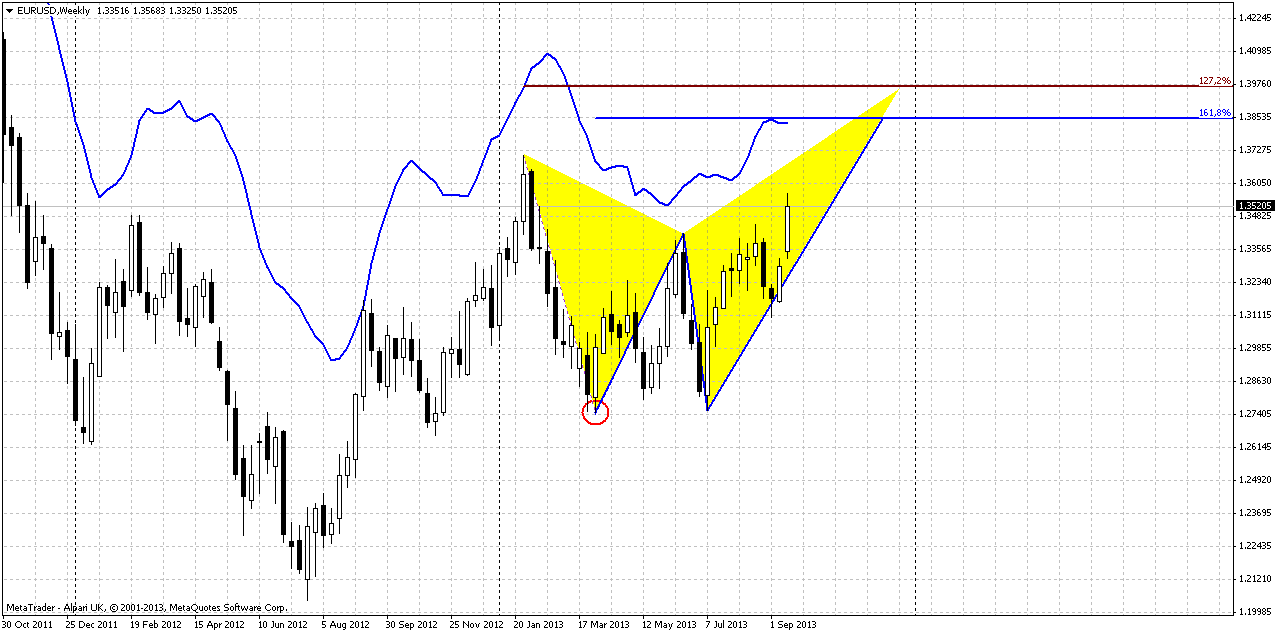
As market has completed our grabbers, let’s take a look at a bit broader picture that I’ve shown you previously. Currently we have the only pattern here and this is butterfly “sell”. Also I’ve thought about larger reverse H&S, but probably it is not perfect enough – too much difference between shoulders. Besides, we still use this AB=CD extension on monthly chart. Trend is bullish here. As market has passed through as MPR1 as MPR2 it solid challenge on continuation and it looks like that we will see it. Long term invalidation point is a low of butterlfy (in red circle). If market will move below it – it will not only erase butterfly but also put under question our monthly AB=CD. Trend also will shif bearish probably around this level. Take a look that we have really huge resistance cluster at 1.38-1.39 area. Recall monthly target and Fib level and now add 1.27 butterfly target, weekly overbought and inner 1.618 AB=CD target. But fortunately we have pretty a lot of room till this area. Second, butterfly pattern could be a long-play one. May be there will be some retracement around 1.27 extension, but who says that it can’t proceed to 1.618? And guys, I have suspicious that this will be the case.
Recall how 2 weeks ago we’ve talked about EUR swings on weekly chart. EUR usually shows AB=CD with very small BC leg. When it completes 100% of this AB=CD it shows significant and wide retracement/consolidations. That is where we stand now and later it usually skyrockets to 1.618 of initial AB-CD. That is an area where 1.618 of our butterfly stands – around 1.42-1.43 This stands beyond a bit of our weekly analysis cycle and overbought but this is really thrilling perspective....
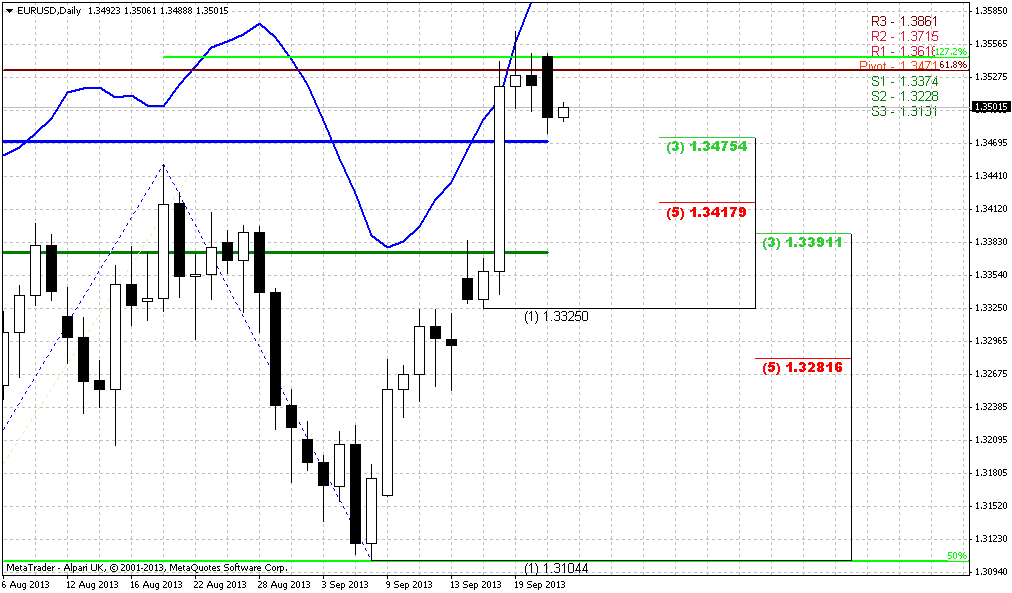
Daily
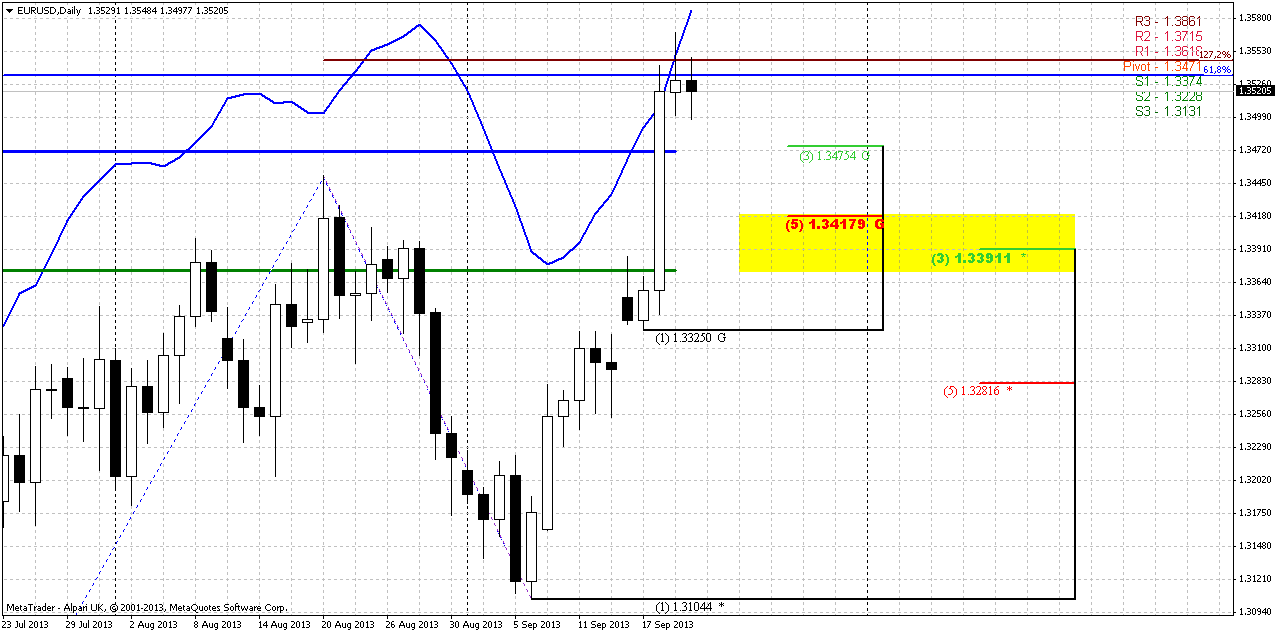
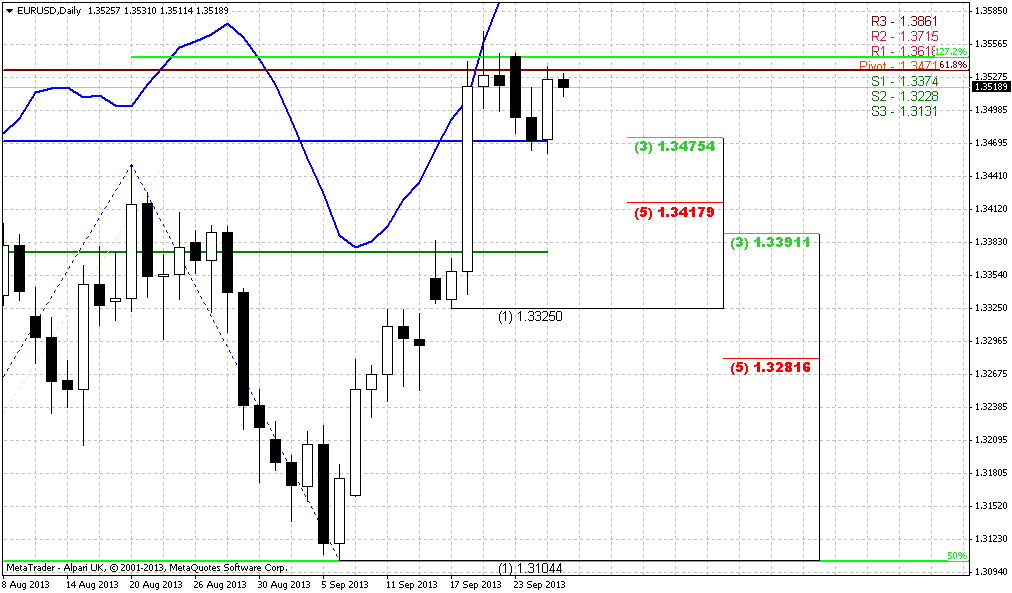
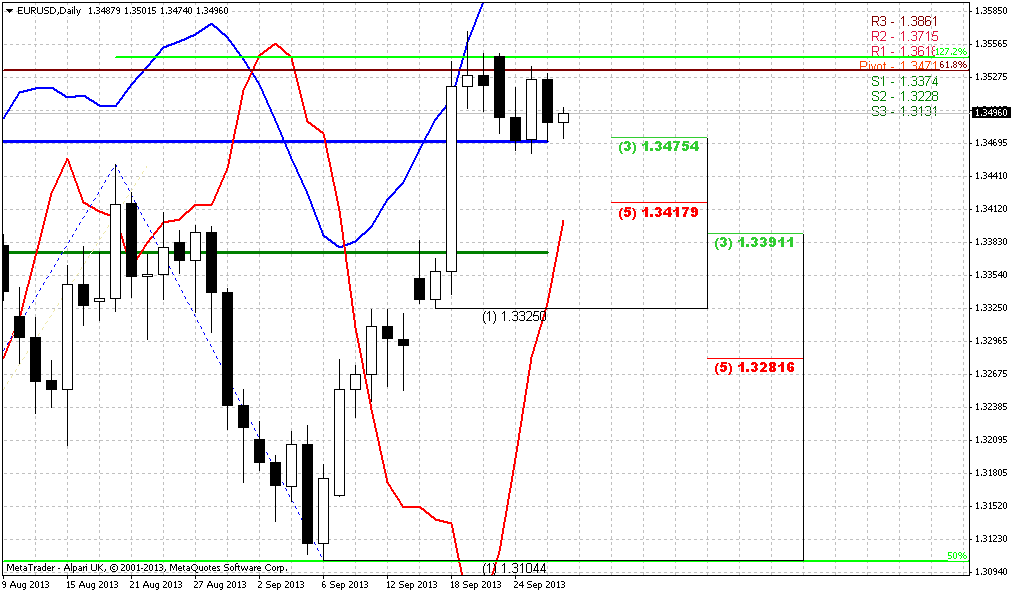
Now time has come to decide where we can take long position and how we can do this. Daily time frame could give us great assistance with it. Trend is bullish here, but market stands at overbought and minor 0.618 AB-CD target and 1.27 extension of previous retracement. By DiNapoli framework combination of objective point and overbought calls as “Kibby trade” and has some similar to Stretch pattern properties but trades a bit differently. This is information for scalpers and we will take about it in hourly chart analysis. For others, who trades on daily frame, this just means that market should show some pullback. As price stands at overbought it is reasonable to suggest some deeper retracement. I can’t exclude that market could continue move up even from 1.3475 level, since it is accompanied by WPP by the way, but common sense and probability tells that we should count on deeper retracement and it seems that 1.3390-13415 K-support is suitable for that. This level also includes WPS1 and we know that as market turns to retracement on long-term bull trend – WPS1 should hold it.
And the last one but not least – I’m not sure but I somehow thought – could we get B&B buy here? Yes, we have not quite sufficient thrust – just 7 bars although minimum requirement is 8, but these bars are solid, especially the last one and we have unclosed gap here. So, let’s do not take it as a primary context, I mean B&B, but still, will take a look at it.
That’s being said, here we probably should be ready for some retracement that should be deeper than just nearest 3/8 support. Daily K-support level accompanied by WPS1 seems suitable for that purpose.
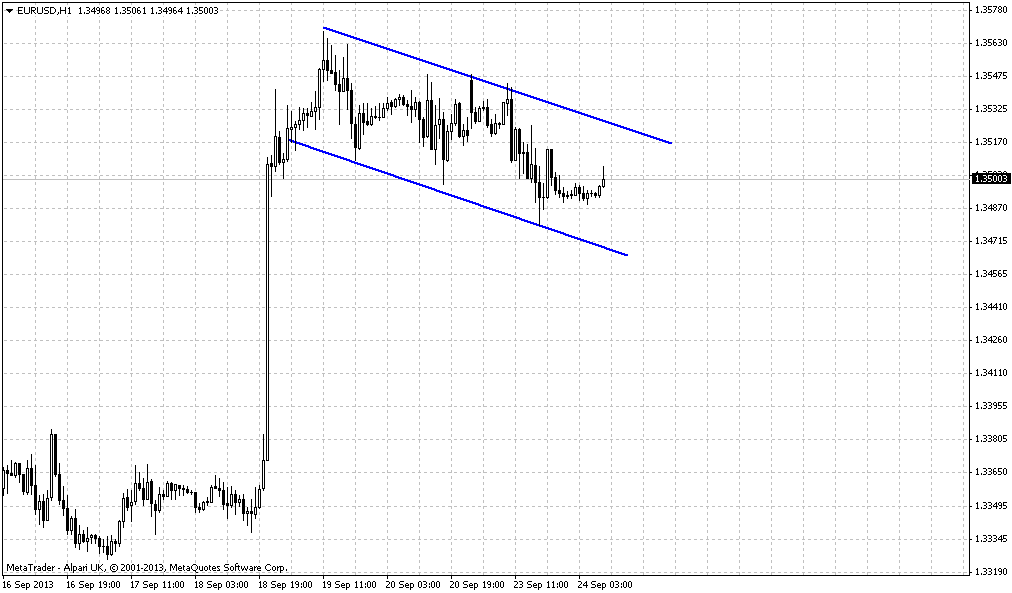
60-min
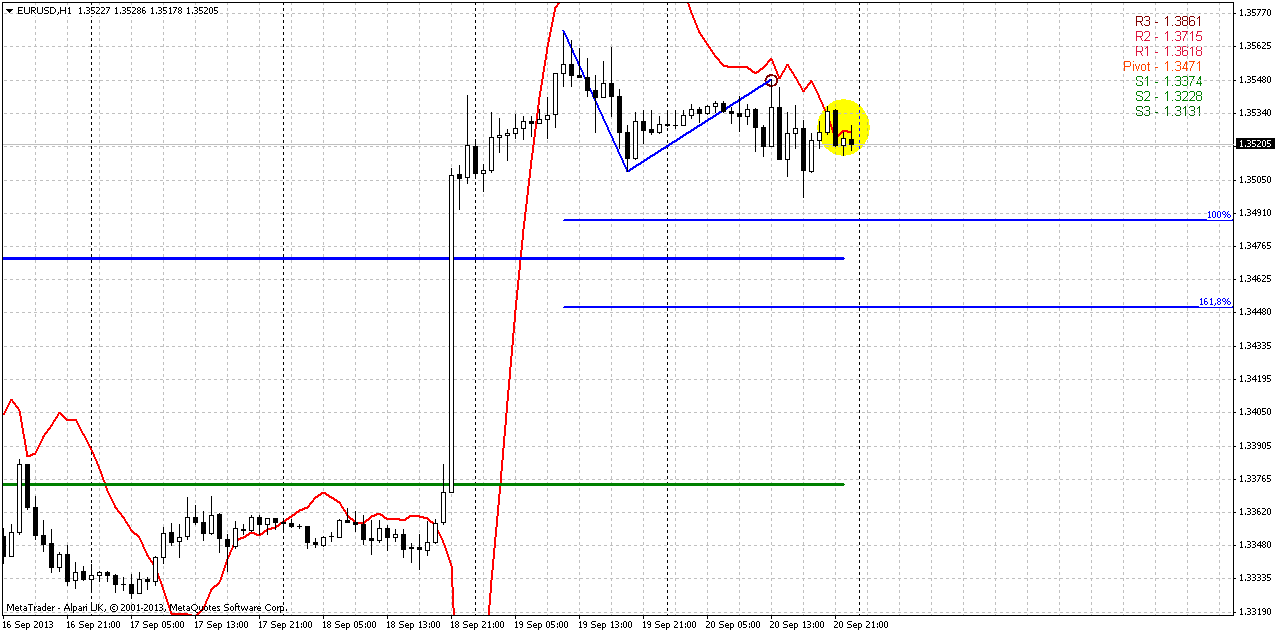
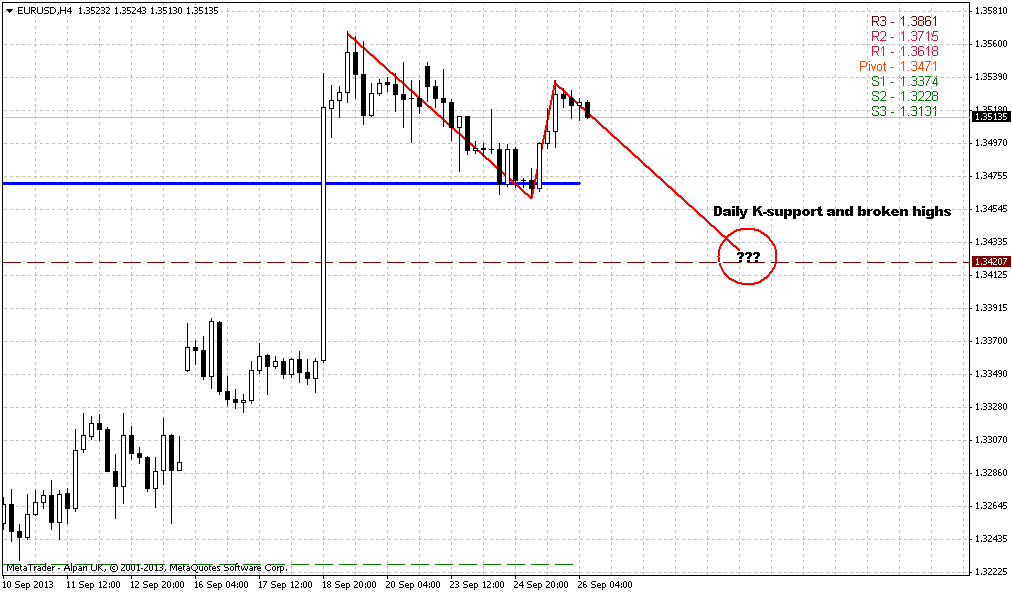
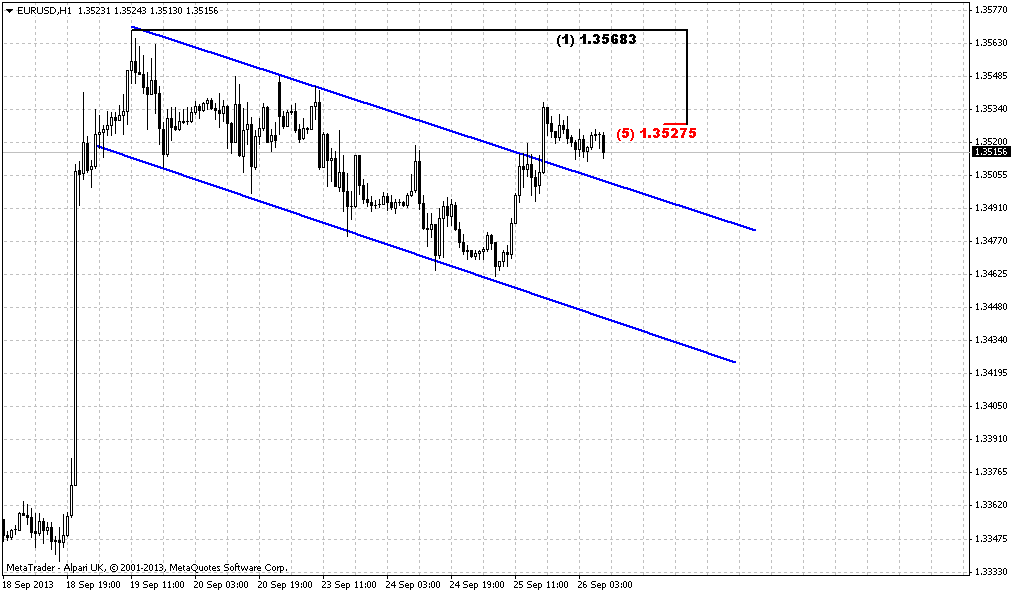
Now let’s talk a bit about Kibby trade. This speech mostly for intraday traders. Since this trade is also counter trend one, and similar to Stretch from this point of view – price action within it usually choppy and looks like retracement mostly.
I’m not a big expert with making Kibby trades, but theoretical rule suggests – when market has shown “Kibby” setup on daily (we have it – combination of target and overbought), drop your time frame (done), wait when trend will shift bearish (done), enter at first retracement up (should be done on bar that marked by small circle) and use as target some extension down or some other target, such as strong support, etc.
Although we missed enter at retracement, now we have even better oportunity – we have 2 bearish stop grabbers that let us to place very tight stop. Possible targets are 1.3490 and 1.3450. As market at overbought and WPP stands around 1.3470, then it’s logical to choose second one probably.
Also, I have to say that I’m not a big fan of such counter trend trades, because although they are based on solid context, they still carry higher risk of loss mostly due unexpected ocasional spikes, splashes that typical for retracement. I just cover this material because research should be interesting for different wide groups of traders, as for positional as for scalpers. Hope this will help you somehow and you will done well with this.
Conclusion:
On big picture market stands at the eve of opening solid bullish perspectives initially to 1.38 area and ultimately up to 1.42-1.43. At least, currently it looks so.
On daily chart market is overbought although overall bullish context holds. Thus, we probably should wait for retracement down and then start to search pattern around support area that will let us to take position. If we will still get some kind of B&B LAL on daily – that will make our task simpler.
The technical portion of Sive's analysis owes a great deal to Joe DiNapoli's methods, and uses a number of Joe's proprietary indicators. Please note that Sive's analysis is his own view of the market and is not endorsed by Joe DiNapoli or any related companies.
Well, as our medium target has been hit, now we again have to think what to do next. I’ve taken a look across the board on different pairs and didn’t find something significantly better than EUR. All pairs just has finished corresponding action and situation is very similar across them. NZD is still interesting, really huge upside potential and our long-term picture that we’ve discussed on previous week is still valid and now in progress. But, NZD at weekly overbought and some retracement is very probable. I do not exclude that we will take a look at kiwi with one of our daily updates, as soon as it will give us clear setup.
Now let’s go back to EUR. On passed week I’ve heard two intriguing comments. First is from FOMC about supporting of QE. Yes, in recent time we saw mostly moderate data rather than some good and really growing numbers, but still, as FOMC has spoken within a half of a year that it a bit worries for future inflation and that inflation could come out of controls, since now nobody knows how monthly 85 Bln inflow could impact on USD in the future – they has started to prepare market participants for gradual easing of QE program and that it’s contraction should started soon. But as they’ve said on Wed – “Hey, we will not start contraction and do not care about inflation, may be it will be strong and uncontrolled, but we do not know exaclty how it will be. At least currently we will continue our money printing”. It means that bubble on stock market will continue to grow and splash on gold market (although it could erased) confirms that this was a bit out of market expectation. Gold is dropping mostly due to anemic inflation and mostly due abscence of signs that inflation starts to alive. But this statement has awoke even this kind of gold market, some fears on possible inflation pressure have appeared even there.
Second comment concerns US debt ceil. Obama said that he has tired to bargain with Congress on Obamacare and debt ceil. Republicans said – “we will agree on debt ceil if we will see contraction of spending on obamacare”. Here is an article in FT Obama stands firm on refusal to negotiate over US debt ceiling - FT.com. All in all debt ceil rising is not a Obama’s whim, this is absolutely neccesary issue for country, at least in short term, but looks like senators do not understand this, they just continue to live and think by category of old hassle between republicans and democrates. Thus, Obama said – you do not want to rise debt ceil? No problem, I do not care about and why I should care. And in general, he’s right. He has not to explain cogressmen why it is important. Ceil will be reached by mid October and any nervousness will not stand in favor of USD. Besides, as I understand America does not show big success yet with budget savings. The plan was to reduce deficit for ~1.5 Bln by the end of this year (if I do not mess someting). Tax benefit period has ended, Health care reform demands a lot of money and Fed Reserve has confirmed of money printing. All these moments fundamentally are not positive for USD. But it’s a bit long-term picture.
Now let’s shift to pure technical moments. Our riddle with flag consolidation stands very close to its resolving probably. On monthly chart we have two major moments. First is market has moved above previous high (in red circle). This is important not only because this is high per se, but also because this was a previous failure upward breakout of consolidation. And as market has move right back above it – this tells that this probably is real move at this time. Second – market stands above 50% resistance level that has stopped move up early. I do not know how it will turn, but at least now picture looks bullish. Next monthly target is 1.3775-1.3830 area. It includes yearly pivot resistance1, 5/8 Fib resistance and minor 0.618 extension target of current AB-CD up. Other words, we have an Agreement around YPR1. Trend holds bullish here.
Weekly
As market has completed our grabbers, let’s take a look at a bit broader picture that I’ve shown you previously. Currently we have the only pattern here and this is butterfly “sell”. Also I’ve thought about larger reverse H&S, but probably it is not perfect enough – too much difference between shoulders. Besides, we still use this AB=CD extension on monthly chart. Trend is bullish here. As market has passed through as MPR1 as MPR2 it solid challenge on continuation and it looks like that we will see it. Long term invalidation point is a low of butterlfy (in red circle). If market will move below it – it will not only erase butterfly but also put under question our monthly AB=CD. Trend also will shif bearish probably around this level. Take a look that we have really huge resistance cluster at 1.38-1.39 area. Recall monthly target and Fib level and now add 1.27 butterfly target, weekly overbought and inner 1.618 AB=CD target. But fortunately we have pretty a lot of room till this area. Second, butterfly pattern could be a long-play one. May be there will be some retracement around 1.27 extension, but who says that it can’t proceed to 1.618? And guys, I have suspicious that this will be the case.
Recall how 2 weeks ago we’ve talked about EUR swings on weekly chart. EUR usually shows AB=CD with very small BC leg. When it completes 100% of this AB=CD it shows significant and wide retracement/consolidations. That is where we stand now and later it usually skyrockets to 1.618 of initial AB-CD. That is an area where 1.618 of our butterfly stands – around 1.42-1.43 This stands beyond a bit of our weekly analysis cycle and overbought but this is really thrilling perspective....
Daily
Now time has come to decide where we can take long position and how we can do this. Daily time frame could give us great assistance with it. Trend is bullish here, but market stands at overbought and minor 0.618 AB-CD target and 1.27 extension of previous retracement. By DiNapoli framework combination of objective point and overbought calls as “Kibby trade” and has some similar to Stretch pattern properties but trades a bit differently. This is information for scalpers and we will take about it in hourly chart analysis. For others, who trades on daily frame, this just means that market should show some pullback. As price stands at overbought it is reasonable to suggest some deeper retracement. I can’t exclude that market could continue move up even from 1.3475 level, since it is accompanied by WPP by the way, but common sense and probability tells that we should count on deeper retracement and it seems that 1.3390-13415 K-support is suitable for that. This level also includes WPS1 and we know that as market turns to retracement on long-term bull trend – WPS1 should hold it.
And the last one but not least – I’m not sure but I somehow thought – could we get B&B buy here? Yes, we have not quite sufficient thrust – just 7 bars although minimum requirement is 8, but these bars are solid, especially the last one and we have unclosed gap here. So, let’s do not take it as a primary context, I mean B&B, but still, will take a look at it.
That’s being said, here we probably should be ready for some retracement that should be deeper than just nearest 3/8 support. Daily K-support level accompanied by WPS1 seems suitable for that purpose.
60-min
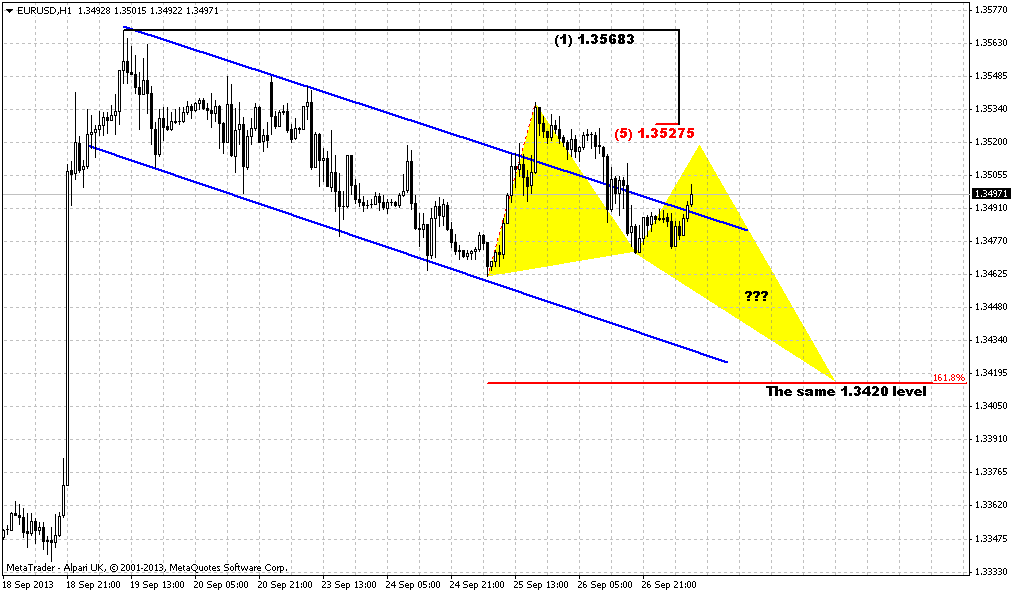
Now let’s talk a bit about Kibby trade. This speech mostly for intraday traders. Since this trade is also counter trend one, and similar to Stretch from this point of view – price action within it usually choppy and looks like retracement mostly.
I’m not a big expert with making Kibby trades, but theoretical rule suggests – when market has shown “Kibby” setup on daily (we have it – combination of target and overbought), drop your time frame (done), wait when trend will shift bearish (done), enter at first retracement up (should be done on bar that marked by small circle) and use as target some extension down or some other target, such as strong support, etc.
Although we missed enter at retracement, now we have even better oportunity – we have 2 bearish stop grabbers that let us to place very tight stop. Possible targets are 1.3490 and 1.3450. As market at overbought and WPP stands around 1.3470, then it’s logical to choose second one probably.
Also, I have to say that I’m not a big fan of such counter trend trades, because although they are based on solid context, they still carry higher risk of loss mostly due unexpected ocasional spikes, splashes that typical for retracement. I just cover this material because research should be interesting for different wide groups of traders, as for positional as for scalpers. Hope this will help you somehow and you will done well with this.
Conclusion:
On big picture market stands at the eve of opening solid bullish perspectives initially to 1.38 area and ultimately up to 1.42-1.43. At least, currently it looks so.
On daily chart market is overbought although overall bullish context holds. Thus, we probably should wait for retracement down and then start to search pattern around support area that will let us to take position. If we will still get some kind of B&B LAL on daily – that will make our task simpler.
The technical portion of Sive's analysis owes a great deal to Joe DiNapoli's methods, and uses a number of Joe's proprietary indicators. Please note that Sive's analysis is his own view of the market and is not endorsed by Joe DiNapoli or any related companies.

") Also I will be watching Daily DOSC(yours custom) to reach 0 and where the price will be at that moment-maybe Strech will be in play?! Also I enclose Daily chart on Alpari UK and I can count 10 bars with very nice thrust so BnB buy or DRPO sell could form!
Also I will be watching Daily DOSC(yours custom) to reach 0 and where the price will be at that moment-maybe Strech will be in play?! Also I enclose Daily chart on Alpari UK and I can count 10 bars with very nice thrust so BnB buy or DRPO sell could form!