FOREX PRO Weekly September 24-28, 2012

Retracement

Dear Sive,
I will continue to thank you for your generosity. there some term i am yet to know what they mean: B&B and K

Forgive my naive - you often use retracement freely but it can be BULLISH RETRACEMENT or BEARISH RETRACEMENT.
I would appreciate Sir - if you would kindly make it easier for rookies to understand - upward retracement or downward retracement. (or if you state it as Bullish retracement or Bearish retracement). This would greatly assist my understanding.

I am your fan and read your advice everyday.

Thank you Sir

Samy
 
Sive is always right...

"anticipate price to drop to 100% expansion and put SL below it."

Although price has not touched 100% expansion it but it has once again 161.8 extension.......

Sive, do you think it is now safe to say that B&B has failed since it is taking much longer than 3 periods to move up? I mean, we can't even say its a LAL now.... right?

Best,
Brandon
 
Last edited:
Sive is always right...

"anticipate price to drop to 100% expansion and put SL below it."

Although price has not touched 100% expansion it but it has once again 161.8 extension.......

Sive, do you think it is now safe to say that B&B has failed since it is taking much longer than 3 periods to move up? I mean, we can't even say its a LAL now.... right?

Best,
Brandon

Hi Brandon,
Probably it is not quite correct to use B&B term right now, since it suggests defined price action by DiNapoli framework. Now probably we could think only about momentum and whether it will it work or not. I suppose that we underestimate weekly overbought a bit, although We've discussed it every time.
 
Hi Sive thanks for eply
My fault, I meant to write the chart in post 48. I cannot reproduce this in more clarity as FXCM dont let me run platform over the weekend, but in future i will make charts clearer than before.

The pattern i have noted in post 48:

fpa100.PNG
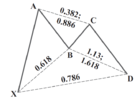
AB retracement of XA at 0.5 (red line)
BC retracement of AB at 0.886 ( blue dotted line)
Confluence of 1.618 of AB and 0.886 of XA at yellow circle
conflunce of 1.27 of AB and 1.618 BC expansion in yellow oval
My first question was if this even was a valid pattern, does the wash and rinse you described in your video invalidate the pattern. I am guessing it does as going below c point is a strong rule not to break.
You remarked to Brandon you look for sell patterns at tops. By sell i thing you mean "bearish Butterfly" As this is a bottom, does this mean i should be looking for bullish patterns at this level?
I think this is important point to clear up as it deals with the crowd psychology aspect of these waves.
AS AN EXAMPLE:
h11.PNG
Is this explanation below ok?
I would look for a "M" shape at bottoms because the "D" point represents a final failed attempt to make a new low
This could also be seen as the second part of a "double bottom" pattern. It is exhaustive
the XA is the inital thrust up from a new low.
AB and CD represents a another attempt at a futher new low, which fails (or not) at "D"
------------------------------------------------------------
Originally, looking at the shpare in last attachment, i would have looked for this shapes at tops because:
we have a thrust up XA, TO a new high
Then a quick profit taking move which is AB
BC is a failure to make a new high
Cd is the reaction to that BC new high attempt.
then we have the potential reversal at D for another attempt

I hope i have described these two possible understandings accurately.
Please help with this, as it would advance my understanding immeasureably!!
 
Back
Top