Sive Morten
Special Consultant to the FPA
- Messages
- 18,648
Monthly
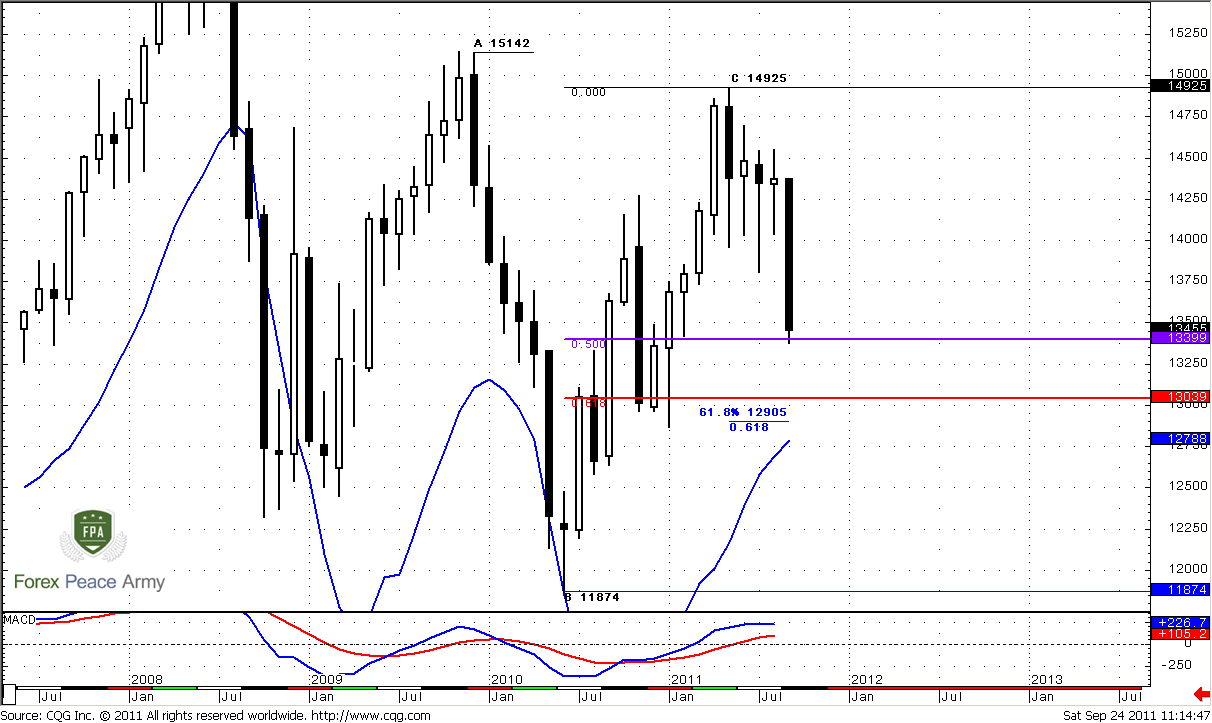
Monthly trend still stands bullish, market not at oversold. September motion continues to show downward direction and currently it looks impressive. Although September bar has not been closed yet, it has pierced 1.3650-1.3760 or even 1.3515-1.3760 K-area significantly, and currently very difficult to say was it been broken or not. If market by the end of the month will be pushed back a bit and close above 1.3650 then, probably this area is still hold the market. IF we will see close of the month lower, than it stands currently, then probably we can’t take it in consideration any more.
Still, market now stands at next support level – 50% at 1.34 from whole move up. As we will see later this is also weekly Agreement area. We will not currently focus on fundamentals, because current situation on markets so unstable that even Bernanke’s sneeze could lead to significant rally on EUR/USD and try to deal with technical only.
Standing at monthly and weekly support tells that on lower time frames market could show some respect of it, even you will not see it in terms on high time frames. That’s why, if this respect will appear at all, it should appear at nearest 1-2 weeks. That is what we will keep an eye on. Simultaneously we have to have mind open for opposite price action, if bears are really strong – we should not be too surprised if market will break all supports and accelerates down further. Nearest target on monthly chart stands at 1.2905 from large AB-CD pattern – near major 0.618 Fib support 1.3039, so we might say that this is also an monthly Agreement.
Weekly
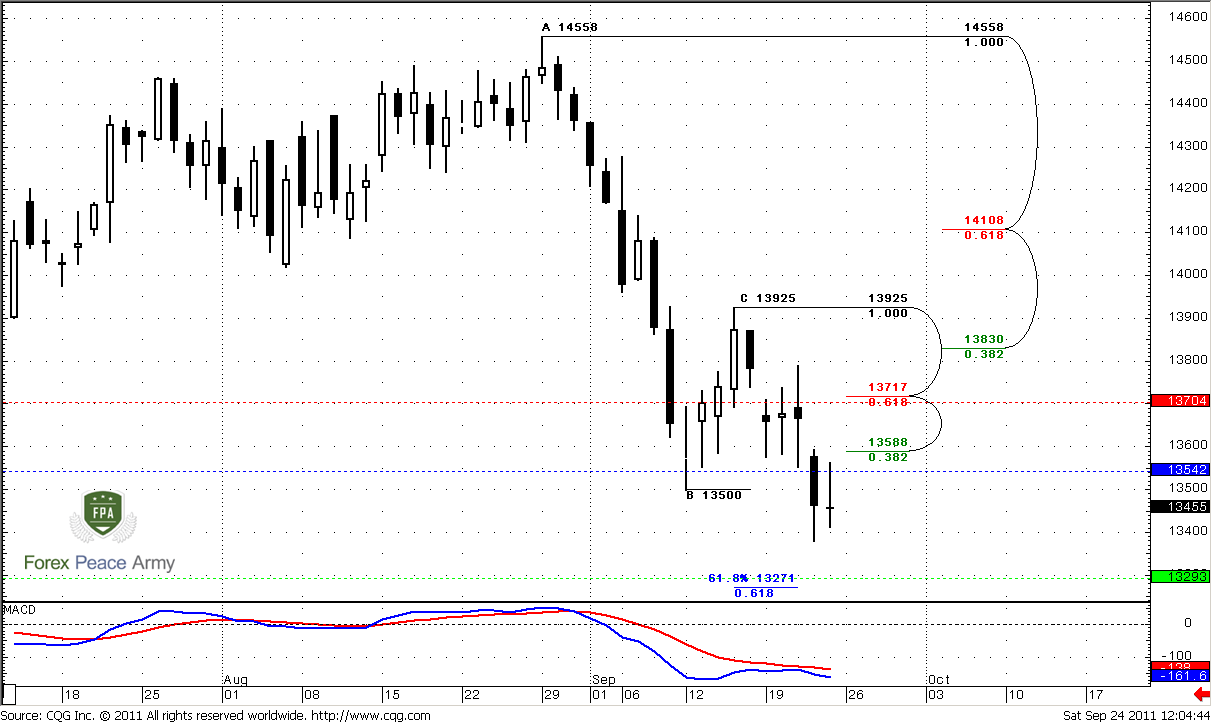
On this time frame there are no much changes. Trend is strongly bearish. In previous research we’ve said that market probably should renew the low and finally hit 1.0 target at 1.3439, so that has happened. Still, market stands in the same range – right near strong support that includes monthly 50%, minor 0.618 Fib support at 1.3480 and Agreement. Also market is very close to weekly oversold, but not quite reaches it. Oversold level for coming week stands around 1.3180 level. Conclusion that we can make is almost the same as on monthly time frame – we have to be aware of some pullback on daily chart.

Daily
Daily trend is bearish, market is not at oversold. Here is our assumption that if market will respect current monthly/weekly support, it will probably show some reversal pattern on daily time frame. Now it looks like that it should be butterfly “Buy” either 1.27 (reached already) or 1.618. Potential upside target could be twofold. First, very often, when market disrespect some significant support (now I’m speaking about monthly K-area), later it retests it from another side. From that standpoint, retracement could be to 1.3717-1.3830 area of support. That is also pivot resistance 1 for coming week.
Second – it could be the upward target of potential butterfly “Buy” pattern. We will talk about it in 4-hour analysis.
Just below the market stands 0.618 target of AB-CD daily move 1.3271 that coincides with pivot support 1.
4-hour
So, here is our butterfly. Market has reached 1.272 extension target already – that is also AB-CD target. 1.618 level stands in agreement with 1.618 of AB-CD, daily AB-CD and weekly support 1 – 1.3230-1.3270 area. The major question is will market continue move down or not – or it will start retracement right from here. My personal view is that this is just AB-CD retracement after hitting of 1.0 AB-CD target. At least currently I do not see impressive reversal and impulse price action. Move is very gradual, that is more typical for retracement. The target of upward move due butterfly is 1.41 level.
here is another view also – we see nice bullish divergence right at some significant targets.
1-hour
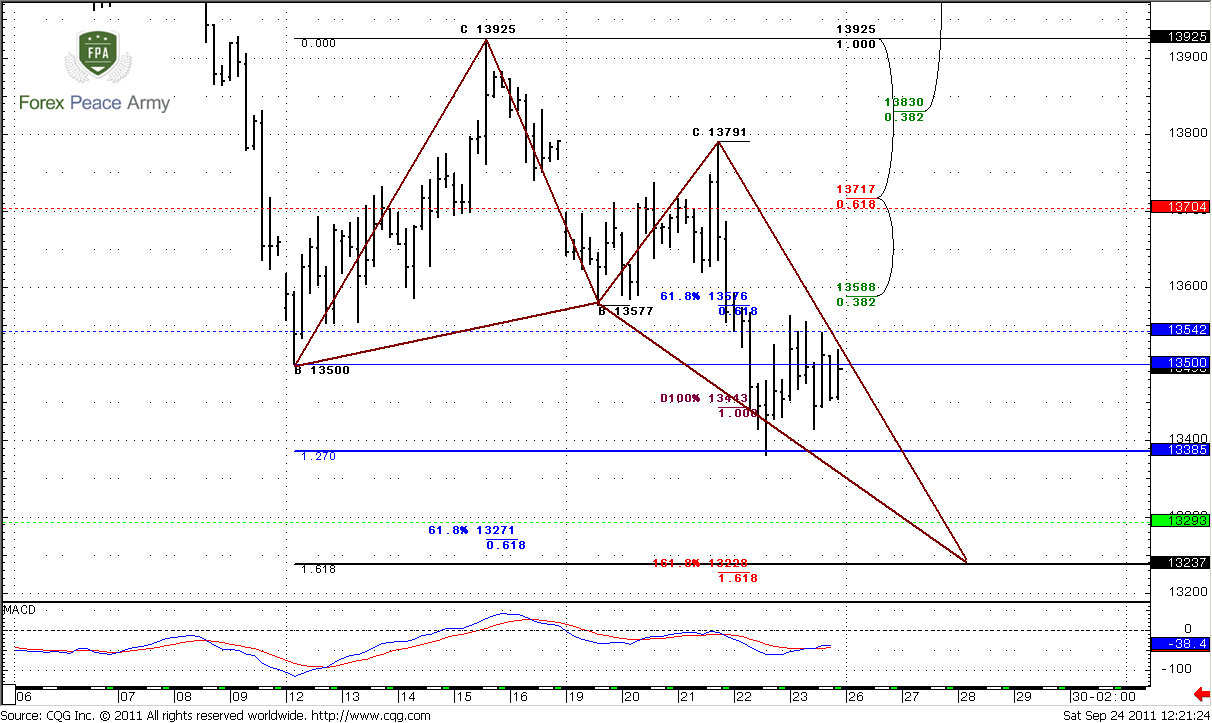
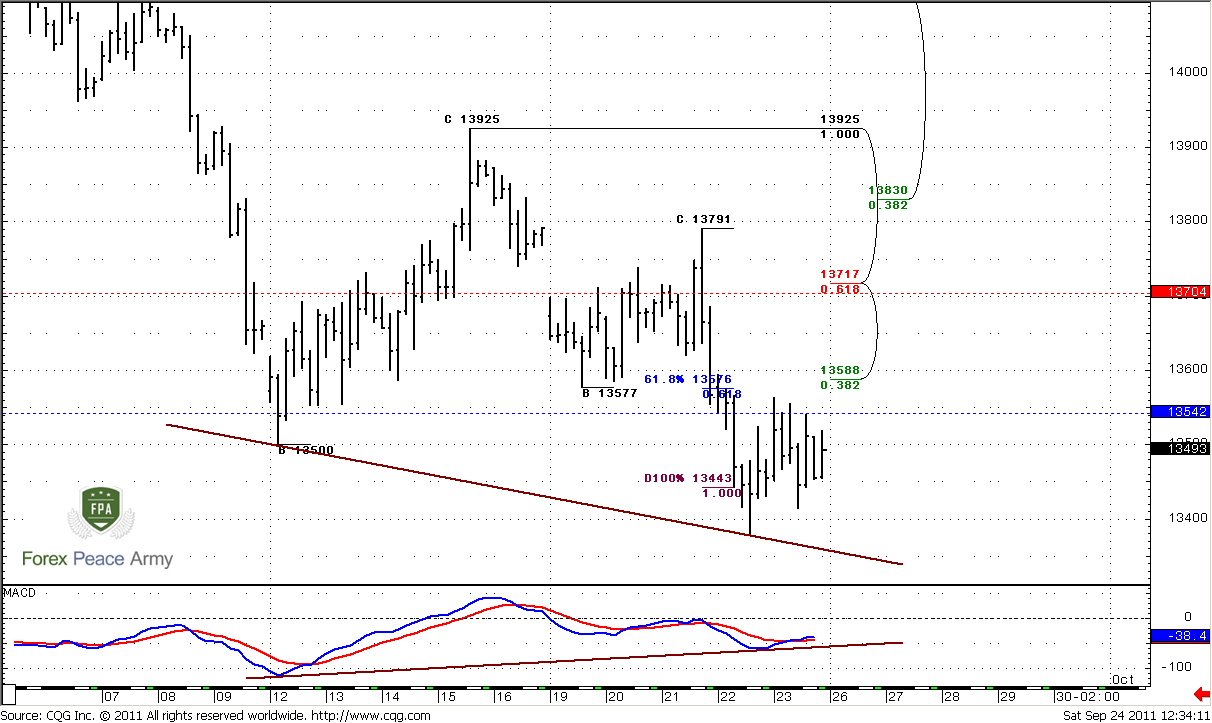
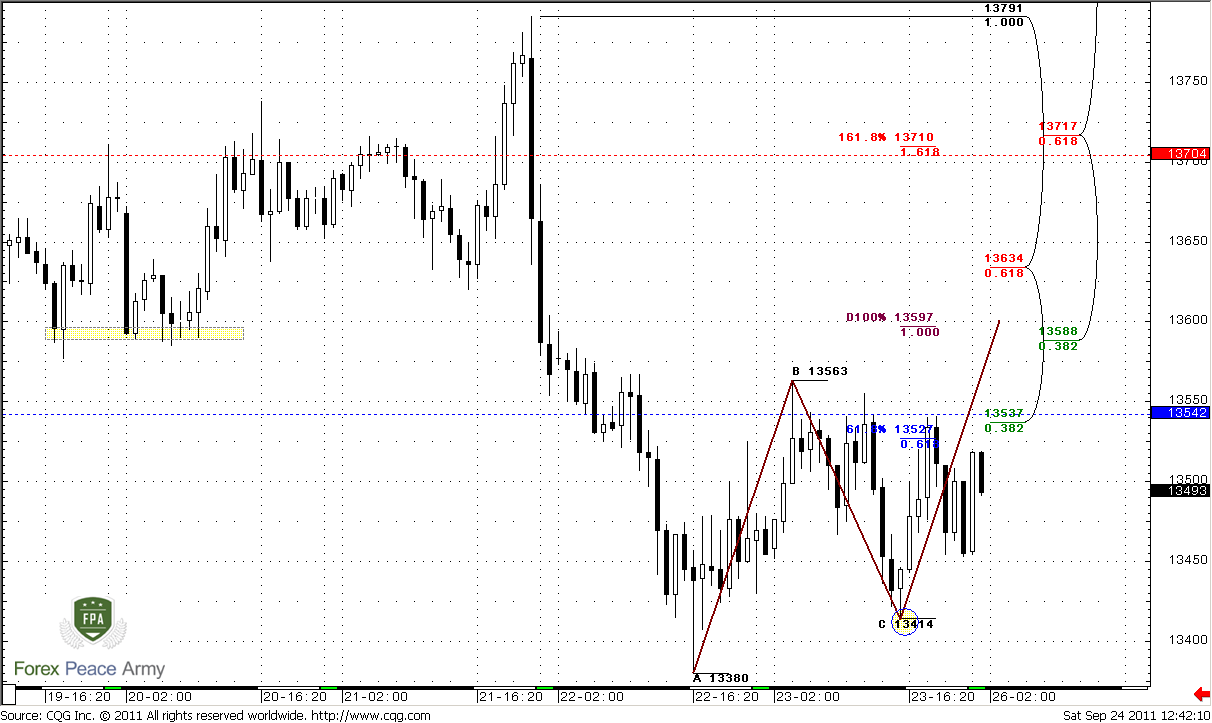
Here is the time frame where all solutions appear. Let’s start from assumption that market is strongly bearish and it will continue to move down. In this case two things could happen. First and most simple is reversal right from here and moving below C point at 1.3414. This will be strong bear sign, since market will not able to complete AB-CD pattern and will reverse down from just 0.618 target, take out C-point and erase AB-CD move. 1.3542 is also a weekly point.
Second scenario is a bit more complicated, but I suppose that it is more probable. Just above the market stands strong resistance area – hourly K-resistance 1.3588-1.3634 and Agreement with AB-CD target. Also here is a previous low. If market is really bearish and intends to continue move to 1.3230-1.3270 area it should not break this level to upside. This is the level where we should watch for sell signals.
If market will break it, then probably Butterfly has started to work just from 1.27 target and market will show deeper retracement.
Conclusion:
The start of coming week forces us to keep an eye on potential AB-CD pattern on hourly chart. Particularly two levels – breakout of 1.3414 right from current level, or completing of AB-CD and watch for 1.3588-1.3634 level (this will be potential “222” Sell pattern). If either first or second will happen, it will mean that market will continue move to 1.3230-1.3270 area.
In general there could be two upside targets: either retest of monthly K-area now from downside or deeper 1.41 level. Later we could estimate it with more precise.
The technical portion of Sive's analysis owes a great deal to Joe DiNapoli's methods, and uses a number of Joe's proprietary indicators. Please note that Sive's analysis is his own view of the market and is not endorsed by Joe DiNapoli or any related companies.
Monthly trend still stands bullish, market not at oversold. September motion continues to show downward direction and currently it looks impressive. Although September bar has not been closed yet, it has pierced 1.3650-1.3760 or even 1.3515-1.3760 K-area significantly, and currently very difficult to say was it been broken or not. If market by the end of the month will be pushed back a bit and close above 1.3650 then, probably this area is still hold the market. IF we will see close of the month lower, than it stands currently, then probably we can’t take it in consideration any more.
Still, market now stands at next support level – 50% at 1.34 from whole move up. As we will see later this is also weekly Agreement area. We will not currently focus on fundamentals, because current situation on markets so unstable that even Bernanke’s sneeze could lead to significant rally on EUR/USD and try to deal with technical only.
Standing at monthly and weekly support tells that on lower time frames market could show some respect of it, even you will not see it in terms on high time frames. That’s why, if this respect will appear at all, it should appear at nearest 1-2 weeks. That is what we will keep an eye on. Simultaneously we have to have mind open for opposite price action, if bears are really strong – we should not be too surprised if market will break all supports and accelerates down further. Nearest target on monthly chart stands at 1.2905 from large AB-CD pattern – near major 0.618 Fib support 1.3039, so we might say that this is also an monthly Agreement.
Weekly
On this time frame there are no much changes. Trend is strongly bearish. In previous research we’ve said that market probably should renew the low and finally hit 1.0 target at 1.3439, so that has happened. Still, market stands in the same range – right near strong support that includes monthly 50%, minor 0.618 Fib support at 1.3480 and Agreement. Also market is very close to weekly oversold, but not quite reaches it. Oversold level for coming week stands around 1.3180 level. Conclusion that we can make is almost the same as on monthly time frame – we have to be aware of some pullback on daily chart.
Daily
Daily trend is bearish, market is not at oversold. Here is our assumption that if market will respect current monthly/weekly support, it will probably show some reversal pattern on daily time frame. Now it looks like that it should be butterfly “Buy” either 1.27 (reached already) or 1.618. Potential upside target could be twofold. First, very often, when market disrespect some significant support (now I’m speaking about monthly K-area), later it retests it from another side. From that standpoint, retracement could be to 1.3717-1.3830 area of support. That is also pivot resistance 1 for coming week.
Second – it could be the upward target of potential butterfly “Buy” pattern. We will talk about it in 4-hour analysis.
Just below the market stands 0.618 target of AB-CD daily move 1.3271 that coincides with pivot support 1.
4-hour
So, here is our butterfly. Market has reached 1.272 extension target already – that is also AB-CD target. 1.618 level stands in agreement with 1.618 of AB-CD, daily AB-CD and weekly support 1 – 1.3230-1.3270 area. The major question is will market continue move down or not – or it will start retracement right from here. My personal view is that this is just AB-CD retracement after hitting of 1.0 AB-CD target. At least currently I do not see impressive reversal and impulse price action. Move is very gradual, that is more typical for retracement. The target of upward move due butterfly is 1.41 level.
here is another view also – we see nice bullish divergence right at some significant targets.
1-hour
Here is the time frame where all solutions appear. Let’s start from assumption that market is strongly bearish and it will continue to move down. In this case two things could happen. First and most simple is reversal right from here and moving below C point at 1.3414. This will be strong bear sign, since market will not able to complete AB-CD pattern and will reverse down from just 0.618 target, take out C-point and erase AB-CD move. 1.3542 is also a weekly point.
Second scenario is a bit more complicated, but I suppose that it is more probable. Just above the market stands strong resistance area – hourly K-resistance 1.3588-1.3634 and Agreement with AB-CD target. Also here is a previous low. If market is really bearish and intends to continue move to 1.3230-1.3270 area it should not break this level to upside. This is the level where we should watch for sell signals.
If market will break it, then probably Butterfly has started to work just from 1.27 target and market will show deeper retracement.
Conclusion:
The start of coming week forces us to keep an eye on potential AB-CD pattern on hourly chart. Particularly two levels – breakout of 1.3414 right from current level, or completing of AB-CD and watch for 1.3588-1.3634 level (this will be potential “222” Sell pattern). If either first or second will happen, it will mean that market will continue move to 1.3230-1.3270 area.
In general there could be two upside targets: either retest of monthly K-area now from downside or deeper 1.41 level. Later we could estimate it with more precise.
The technical portion of Sive's analysis owes a great deal to Joe DiNapoli's methods, and uses a number of Joe's proprietary indicators. Please note that Sive's analysis is his own view of the market and is not endorsed by Joe DiNapoli or any related companies.
")