FOREX PRO Weekly September 26-30, 2011

...to Sive

Sive, your posts here are extremelly usefull, are imprescindible for all of us, and indeed we are very lucky and pleaseful to read your vision and insights of the market. Nobody here could think in trading following exclusevily your ideas, everybody here have to trade as you said with own ideas and method and own discipline, learned by everything studied from you and from other mentors!I´m affortunate to have your picture and sentiment of the market and hoppefully can have it for long long time!! Thank you Sive, you´re da best!!!
 
hey sive.

hey sive, double top and wash&rinse on hour 1, eur/usd, around the 13600 k area,

time for short?

yousuf
 

Attachments

  • Screen shot 2011-09-27 at 21.26.07.jpg
    Screen shot 2011-09-27 at 21.26.07.jpg
    281 KB · Views: 176
EUR/USD Daily Update, Wed 28, September 2011

Hi there,
although major question is still open - does current move is a "deeper" retracement to 1.41 or just small pullback, more and more bullish signs are appeared on the market. What are they?
1. Daily trend has turned bullish;
2. Market has closed above pivot for the first time since August;
3. Market shows bullish MACD divergence right at weekly Agreement support;
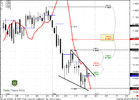
4. Market is forming bullish wedge and has formed already 1.27 Butterfly Buy.

That's impressive patterns, right? So, what the possible target? This is 1.41 level - 1.27 target of Butterfly and 0.618 resistance. But nearest level is 1.3814-1.3844 - daily overbought and Fib resistance.

So, what we can do today?

First, yesterday we've said that market will probably reach 1.3574-1.3625, since this is solid resistance and respect it. That has happened. But today, to enter either short or long you need more than just a strong area. you need some solid patterns that give you sufficient confidence to pull the trigger.

So, if you're bearish, you need:
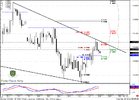
Wedge upward fake breakout. Market could reach Agreement at 1.3702-1.3708 and then return right back inside the wedge body. This could not neccesary lead to deep move down, but at least you will be safe and will not loose money, since market should show some deeper move in this case.

Second, it will be better if market will combine it with Butterfly Sell pattern on hourly chart. The 1.27 target of it stands precisely at the same 1.37 area.

If you're bullish -
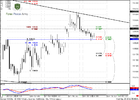
look at hourly chart. Trend is bearish. this is tells us that market probably could show deeper retracement. Your level to watch is 1.3474 Fib support. Be sure that this level will hold and 4-hour trend will hold that retracement and remain bullish. This will be classical hint on potential upward breakout of the wedge.

That's all. Watch for clear confirmation. Market is very unstable and sensitive to news currently.
 

Attachments

  • EUR_D_28_09_11.PNG
    EUR_D_28_09_11.PNG
    46.9 KB · Views: 168
  • EUR_4H_28_09_11.PNG
    EUR_4H_28_09_11.PNG
    43.7 KB · Views: 168
  • EUR_1H_28_09_11.PNG
    EUR_1H_28_09_11.PNG
    45.8 KB · Views: 169
hey sive, would you consider the following attached picture to be B&B sell on gbp/usd daily time frame?

Hi Yousuf. Yes, this is nice potential B&B - thrust is perfect.

sorry to bother again but..."its own specific"...rules? indicators? patterns?

lol, thx Sive!.

No, mostly some nuances of behavior, market mechanics. For instance, Commodities could stand for a long time in overbought or oversold condition, compares to financial markets that do not.

Second, there are a lot of cycle markets, depending from crop etc. Such as Corn, Wheat, Soybeans, Soybean oil etc.

Pattern are OK...

hey sive, double top and wash&rinse on hour 1, eur/usd, around the 13600 k area,

time for short?

yousuf

Well, my comment is a bit late, we see some respect to that level. You may use it as context only if you're scalp trader. To trade it in larger scale - we need still some more confirmation. See my update.
 
watching u.

Hey Sive, I usually dont comment, but am really impressed by your analysis. Though, I dont understand more than half of what you saying cos am new to forex trading. But on behalf of those that benefited from your analysis, Thanks.
 
Drpo Lal?

Hi Sive and thank you for your daily analysis.

On daily chart we have a potential close above the 3x3 DMA. Can we treat this as DRPO "buy" LAL? (or the first penetration was too deep? And/or the difference between bottoms is too big?).

Thank you in advance
 
B&B Sell on Daily?

Hi Sive,

I'm not so sure but for me, we have a probability of B&B sell on daily timeframe.:confused:

Thanks and Best Regards.
 
Back
Top