FXCM/DailyFX Signals and Analysis

I think Crude is playing a part in CAD weakness..

That's right, AliKhan

Below is a chart showing the inverse correlation between USD/CAD and USOil.

USDCAD-Sentiment-Volume-August-3_body_Picture_5.png.full.png
 
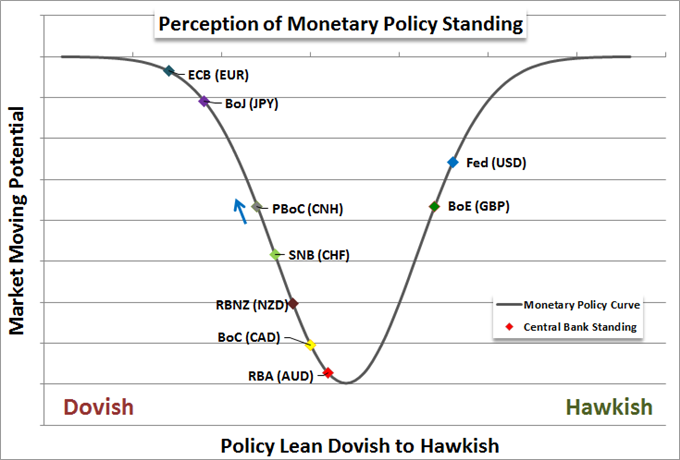
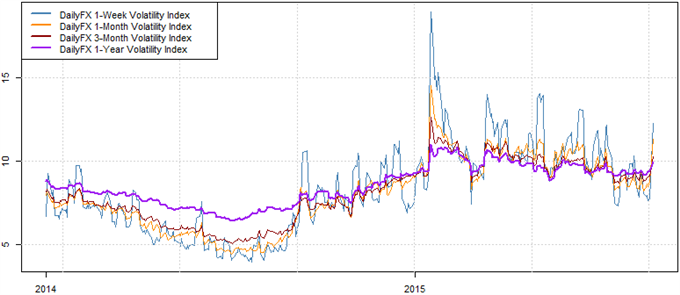
The graph below is from today's special report by John Kicklighter, chief currency strategist of DailyFX.com:

Inflation-Figures-Feed-Speculation-Between-a-Fed-or-BoE-First-Rate-Hike_body_Picture_11.png

It shows that, out of the major central banks, the Fed and the BoE are the most likely to raise rates in the near future particularly in light of the latest inflation figures which are discussed in Kicklighter's report.
 
Australian Dollar Forecast to Hit Fresh Lows


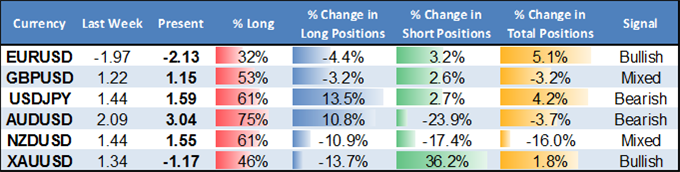
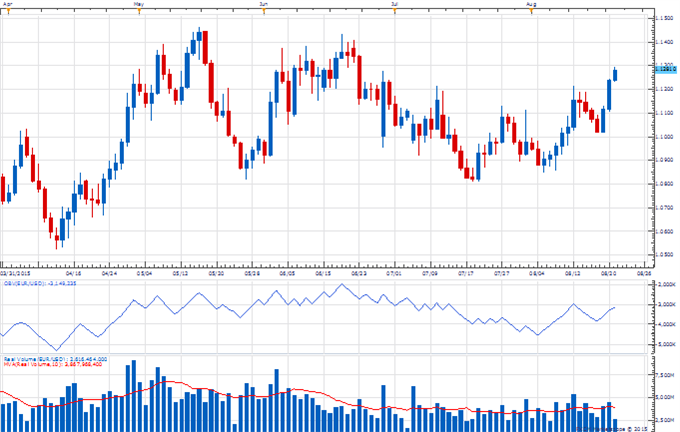
Retail FX traders continue buying aggressively into Australian Dollar weakness, and a contrarian view of crowd sentiment leaves us in favor of selling into AUD declines. The majority of traders last turned net-long the AUD as it traded below $0.80 in May.


Weekly Summary of Forex Trader Sentiment and Changes in Positioning
ssi_table_story_body_Picture_8.png


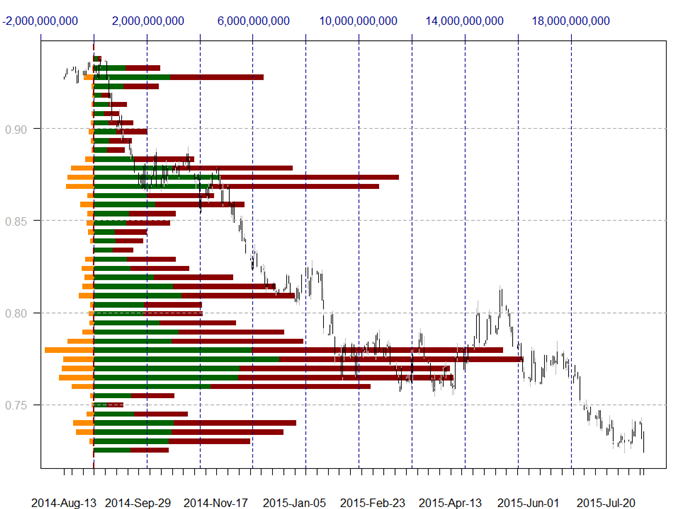
Until we see a marked swing in the opposite direction we see little reason to change our long-standing bearish trading bias, and indeed any rallies are likely to be capped by significant volume-based resistance at $0.7400.


Total Buy Volume Executed, Total Sell Volume Executed, Net Volume Executed (Buy-Sell)
Length of bar indicates the sum of Buy and Sell volume.
forex-trading-volume-at-price_body_x0000_i1030.png

Data source: Directional Real Volume indicator​


The Australian Dollar briefly broke to fresh lows versus the US Dollar before bouncing sharply, and the AUD/USD now trades at major volume-based resistance levels near $0.7400. Failure to close above would nonetheless leave focus on recent lows near $0.7250. A break above $0.7400 would instead target the bottom of a major volume-based congestion range near $0.7600.
 
The Weekly Volume Report: Big Spot Moves But Volume Unimpressive


Talking Points
  • EUR/USD pushes to two-month high
  • USD/JPY breaks 123.00


Daily Volume Chart: EUR/USD
Volume_weekly_aug_21_body_Picture_3.png

Real Volume charts created using Marketscope – Prepared by Kristian Kerr

  • EUR/USD continued higher this week to trade at its highest level in almost two months
  • Volume has failed to pick up materially on the latest advance which is a warning sign that the recovery may only be corrective
  • The failure in daily OBV to get above last week’s high is also concerning
  • However, A close below 1.1000 on above average volume is needed to turn the outlook negative again on the euro


Daily Volume Chart: USD/JPY
Volume_weekly_aug_21_body_Picture_2.png

Real Volume charts created using Marketscope – Prepared by Kristian Kerr

  • USD/JPY fell to its lowest levels in over a month this week
  • Volume, however, remains very low and unsupportive of the decline
  • The downtick in daily OBV is negative, but a break under the late July low is needed to excite about potential further downside
  • A close back over 124.30 on above average volume would turn us positive on the pair
 
Jason,

I think something has gone wrong with your images. Please use Preview Post when posting and you'll be able to see if everything worked or not.
 
Back
Top