IvanGlobalPrime
Company Representative
- Messages
- 36
Find my latest market thoughts
USD Longs Thrive, 'Risk On' Solidifies
The USD maintains a bullish outlook this week, invigorated by the improvement of fundamentals. The Aussie has attracted even stronger bids though. Would you like to find out all the details to deconstruct and make sense of the movements in G8 FX. Are you interested to find out recent trading setups? Today' report delivers all that and much more...
The Daily Edge is authored by Ivan Delgado, 10y Forex Trader veteran & Market Insights Commentator at Global Prime. Feel free to follow Ivan on Twitter & Youtube weekly show. You can also subscribe to the mailing list to receive Ivan’s Daily wrap. The purpose of this content is to provide an assessment of the conditions, taking an in-depth look of market dynamics - fundamentals and technicals - determine daily biases and assist one’s trading decisions.
Let’s get started…
the Global Prime's Research section.
Nikkei, China has stepped up demands before finalizing a trade deal, asking for a roll back of the Sept tariffs and the full cancellation of the planned tax increases in Dec, something the US is considering according to the FT and Politico. The Nikkei notes that “Beijing has doubled down on demands that may threaten to delay a preliminary trade agreement with the U.S.” If the US were to agree to a cancelation of the tariffs, media reports suggest that the US would expect in return more provisions on intellectual property protection, an increase in the purchases of US agricultural products and the added pre-condition for President Xi to ink the agreement in the US.
Congruence in what China is asking by media: In a new report by the Chinese-based Global Times, the rhetoric is congruent, noting that “China will not accept Phase One trade deal if US does not suspend tariffs, according to a former Chinese trade official cited in the Global Times. “The US is "very anxious' to reach a trade deal with China but Beijing won't agree if the US does not cancel some tariffs, Wei Jianguo, former vice minister of commerce, told the Global Times.”
Risk of no Phase One trade deal exist: As reiterated in my previous write ups, it is in these last final steps before reaching the finishing line that the sticking points can easily hinder all the progress made, hence the risk of a breakdown exists. The danger here is that the market has fully priced in a positive outcome, so any major setback would create some dramatic moves in financial markets. What seems clear now is that for a Phase One deal to take effect, the US must remove some tariffs, which in turn will depend on the willingness of China to extend further concessions in exchange. Either way, one side faces the prospects of looking ‘soft’ in front of their own political circles and people.
US ISM non-manuf shows solid recovery: The US ISM non-manufacturing index for October came in at 54.7 vs 53.5 estimate, which is a great welcoming news for the US economy as it demonstrates that the recessionary environment in the US ISM manufacturing series (came poor last Friday) is not spreading out into the wider economy. The news adds to the upbeat US NFP report from Friday, helping to keep the strong bid tone in the US Dollar, so far the top performer this week. That said, it’s worth noting that the index remains near the recent historical lows.
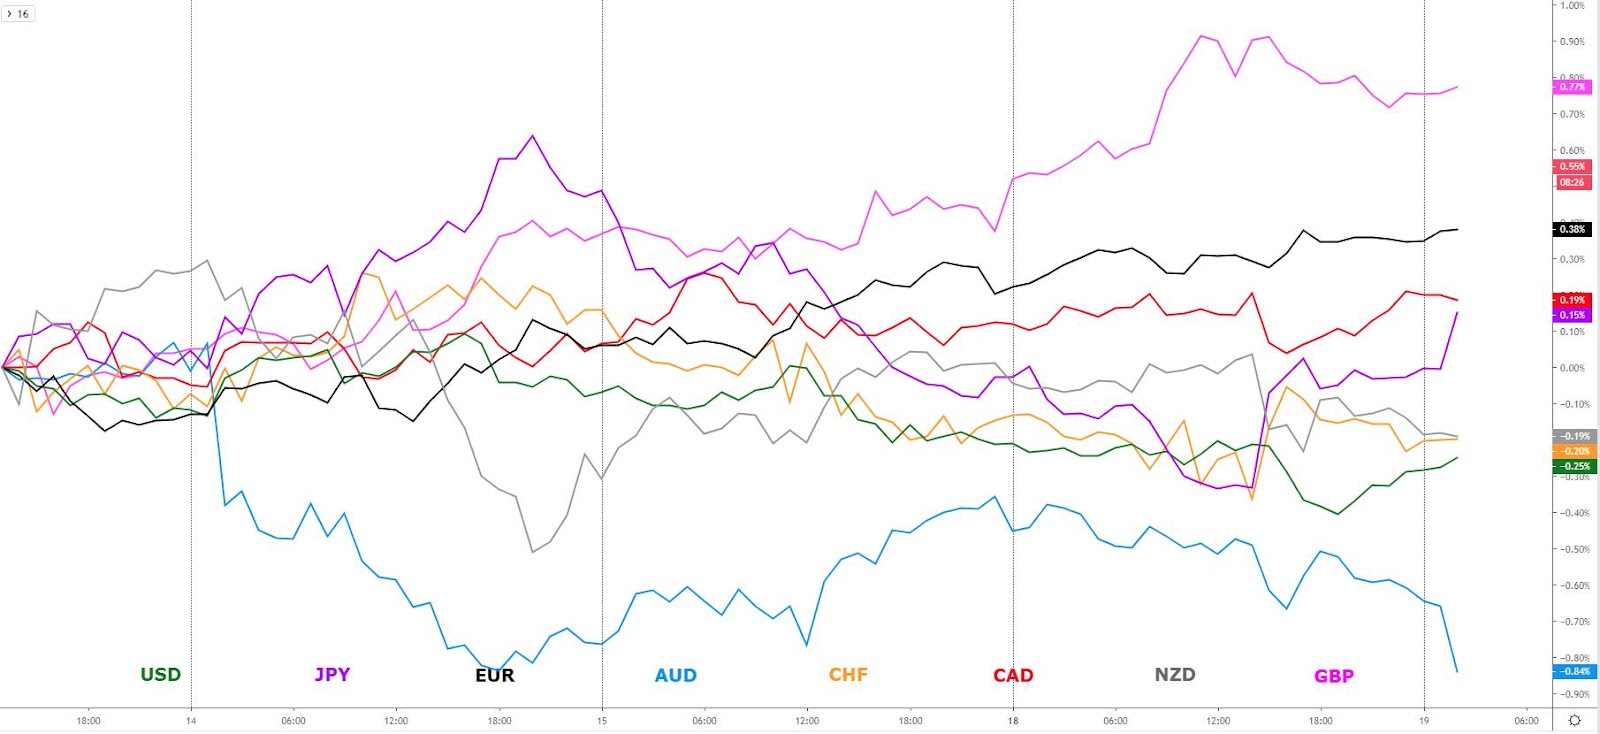
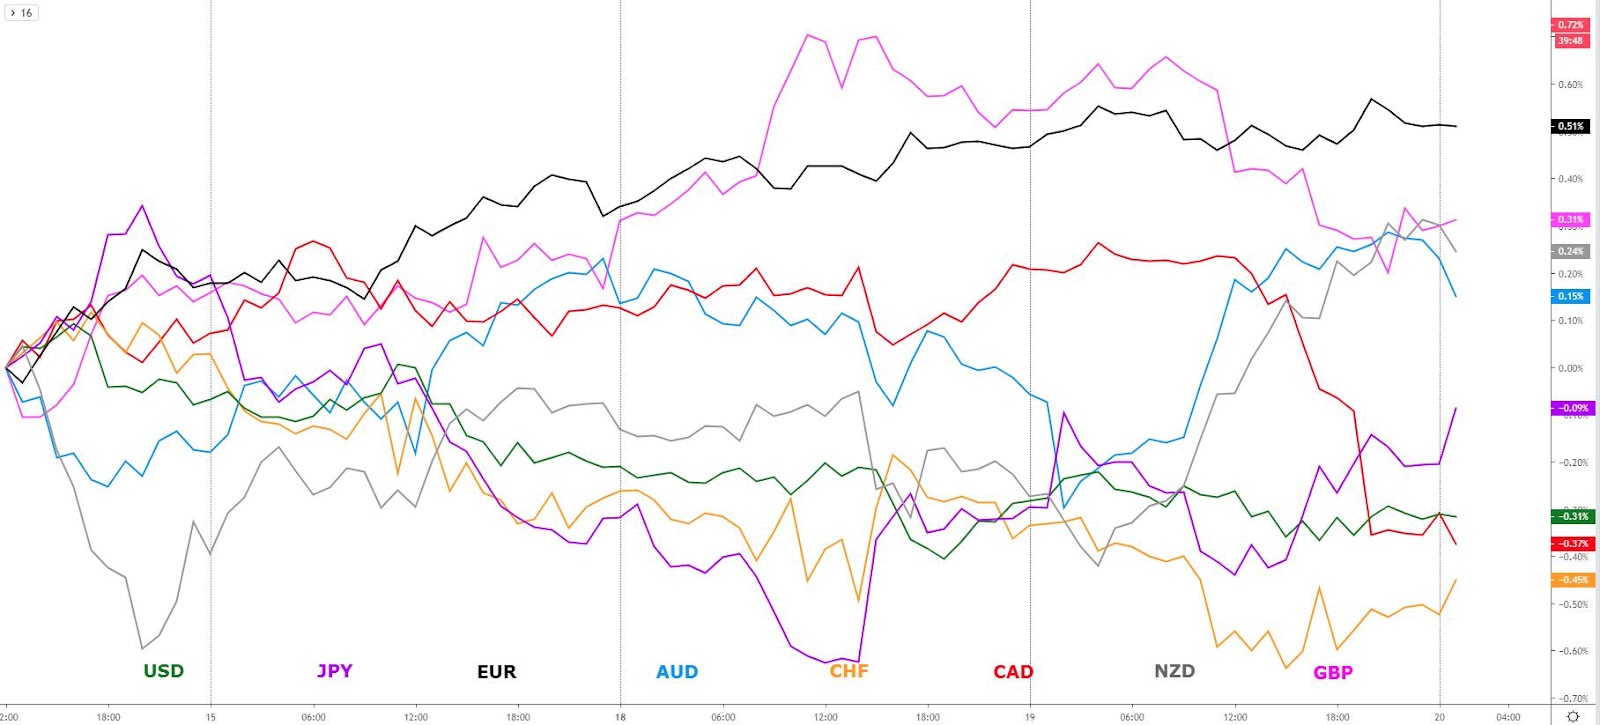
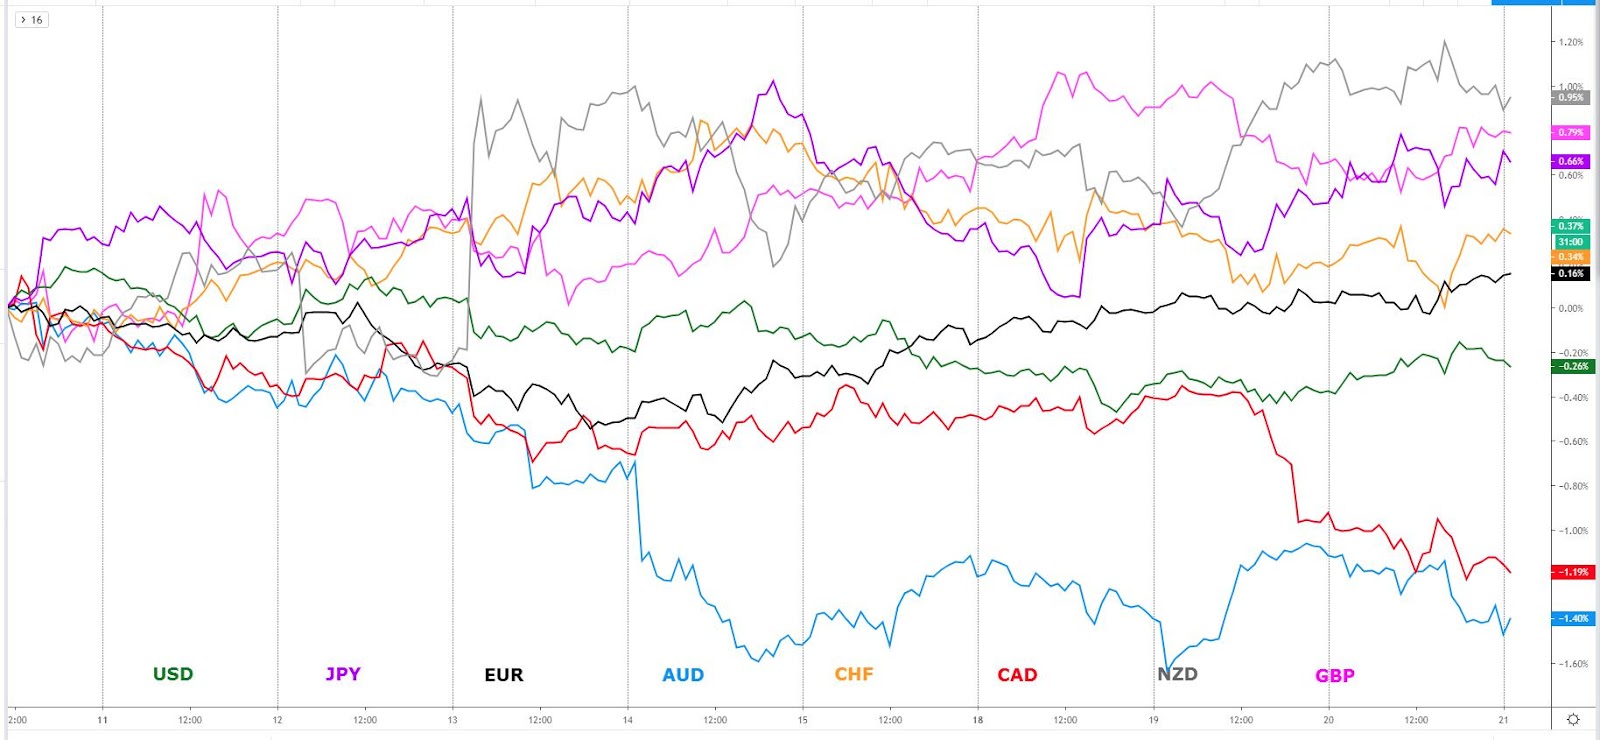
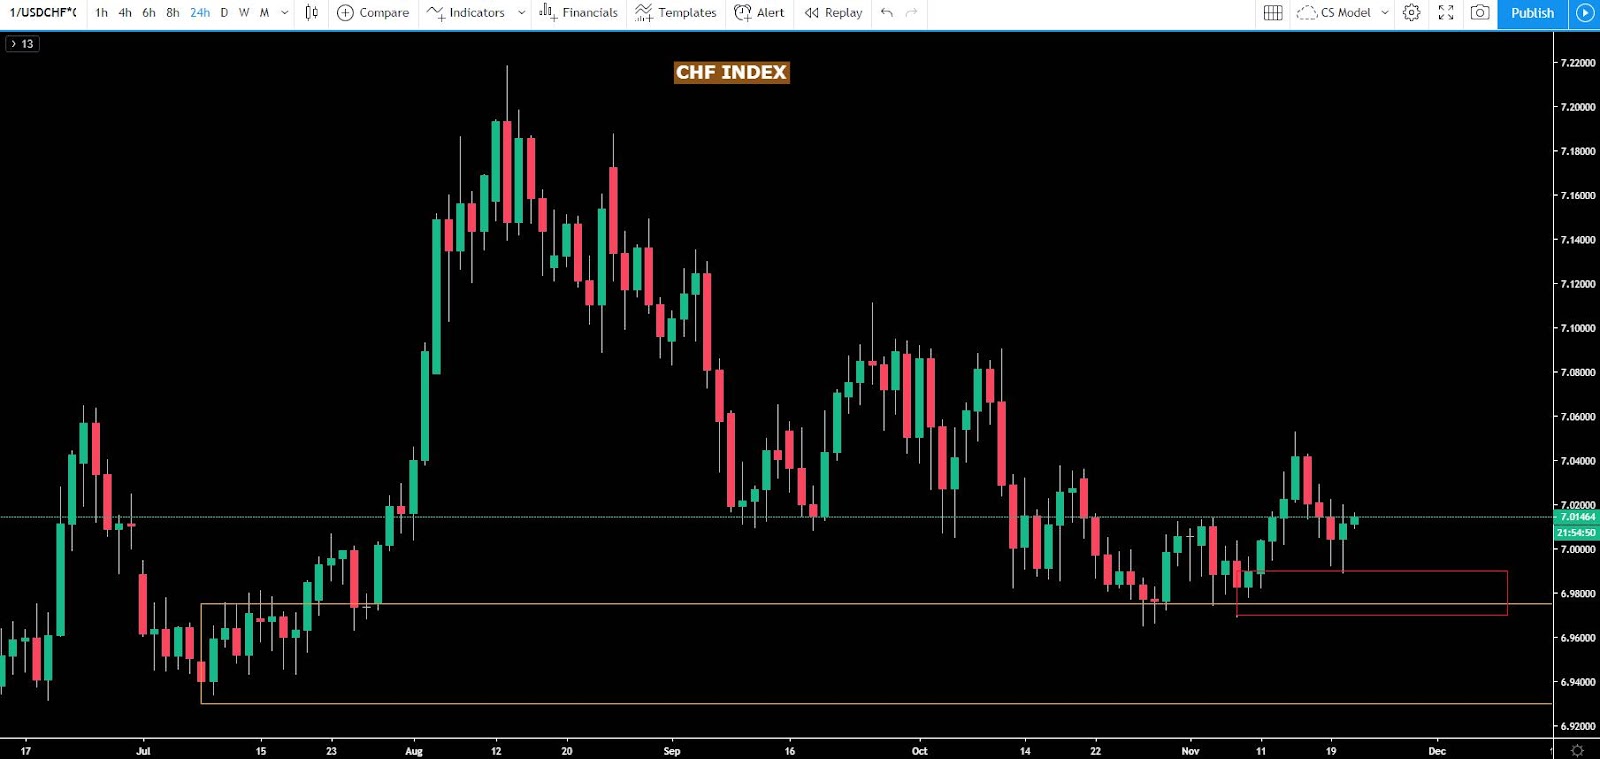
'True risk on' back in vogue: The risk dynamics, as portrayed by the ‘risk-weighted line’ monitored at Global Prime, accounting for the dual performance of the S&P 500 and the US 30y bond yield, has made new trend highs, reinforcing the notion of the ‘true risk on’ profile in the market. This movement provides a ‘Goldilocks’ platform for the JPY, CHF and gold to keep deteriorating in value. The assumption that a US-China Phase One trade deal is imminent has emboldened the groovy vibes, as the market finds it credible enough that the speculation on a removal of tariffs by the US came from reputable sources such as the Politico and FT. The weakness in the USD/CNY below the 7 level for the first time since August underpins the risk environment too.

Conservatives lead in the polls: The latest UK poll of polls shows the Conservative Gov't with a 38% lead, according to Politico. Below I illustrate, courtesy of Forexlive, an info graph showing the current polls (on the left) as it compares to the 2017 last General election outcome. The Lib Dems and Brexit Party have improved the results markedly, which means that if the Brexit Party forms an alliance with the Conservatives, a majority will be formed, while if not, a hung parliament is the danger.

RBA shifts stance to less dovish: RBA decided to keep the cash target rate at 0.75%, as expected, leading to a strong rise in the Australian Dollar after an upgrade in the forward-guidance. In the final paragraph of the statement, the RBA added the following remark: "The easing of monetary policy since June is supporting employment and income growth in Australia and a return of inflation to the medium-term target range." The market has interpreted the comment as a hint that the easing bias may no longer be warranted. Even if the RBA did leave the door open to ease further if needed, they sound as if that would be conditional to external factors.
If you found this fundamental summary helpful, just click here to share it!
give us a share by just clicking here!
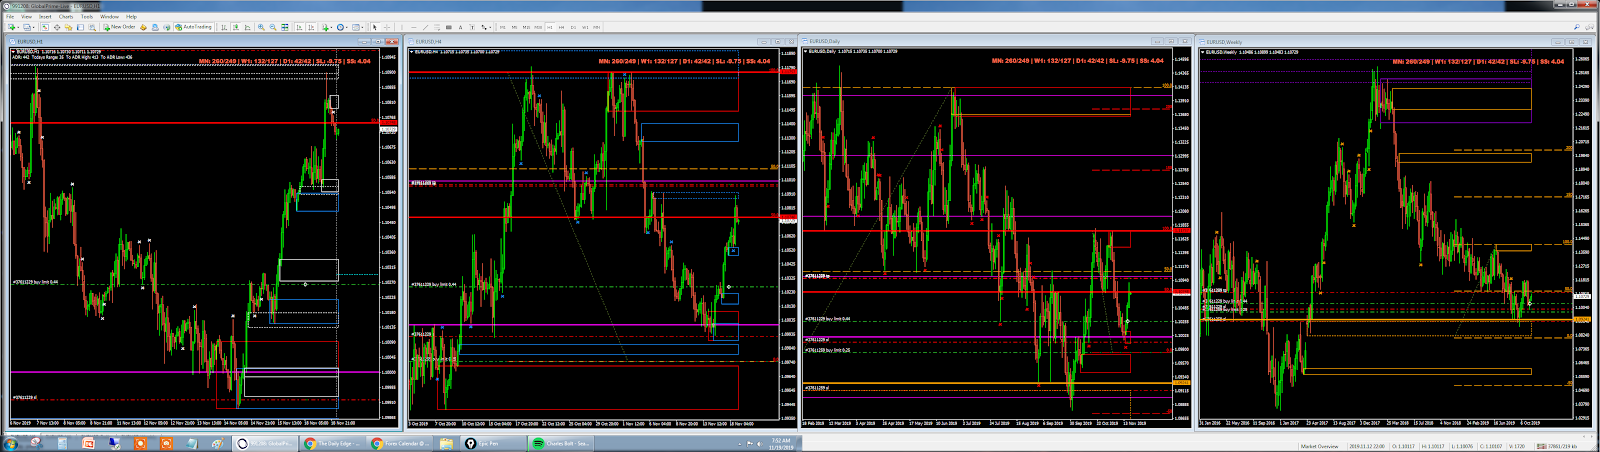
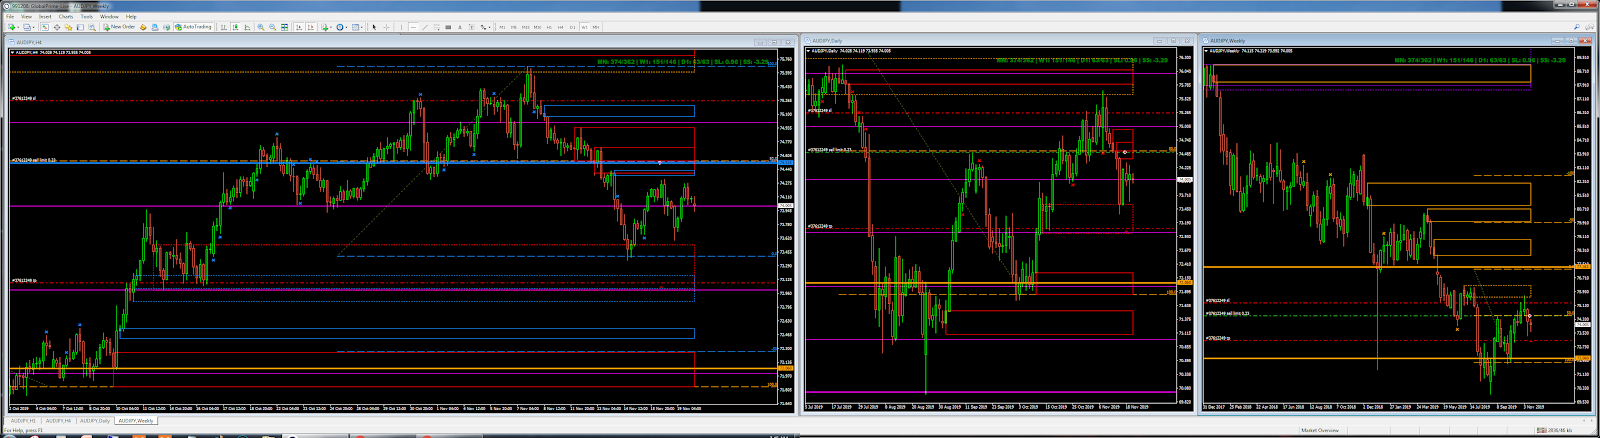
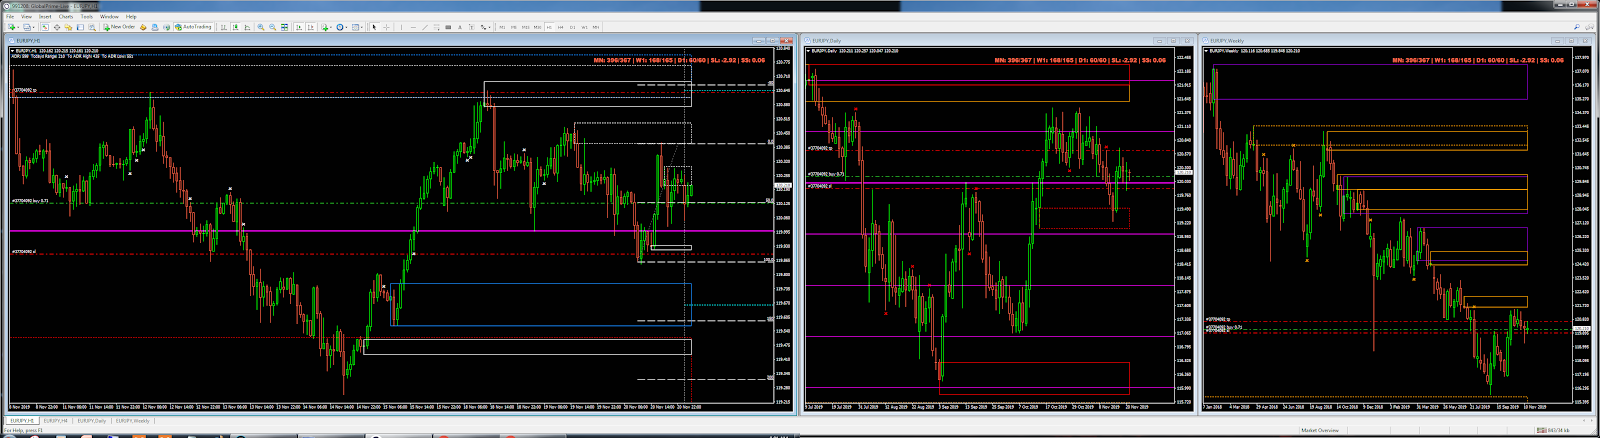
The AUD/JPY long position off a liquidity-rich area in alignment with the risk appetite dynamics at play as represented by the overlapping black line (SP500 + US30Y) paid off exceptionally well. The level was always going to be a pristine location to engage in long-sided action at what should be perceived as a ‘value area’ as per the divergence between price and the risk line. The long trade went up all the way to reach the full take profit target.

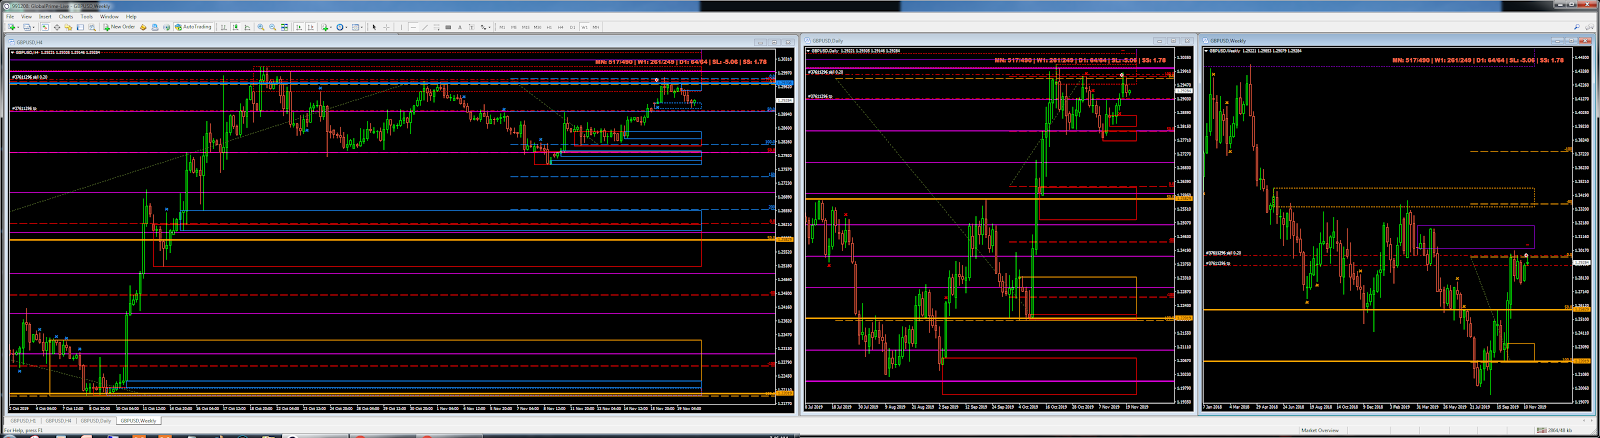
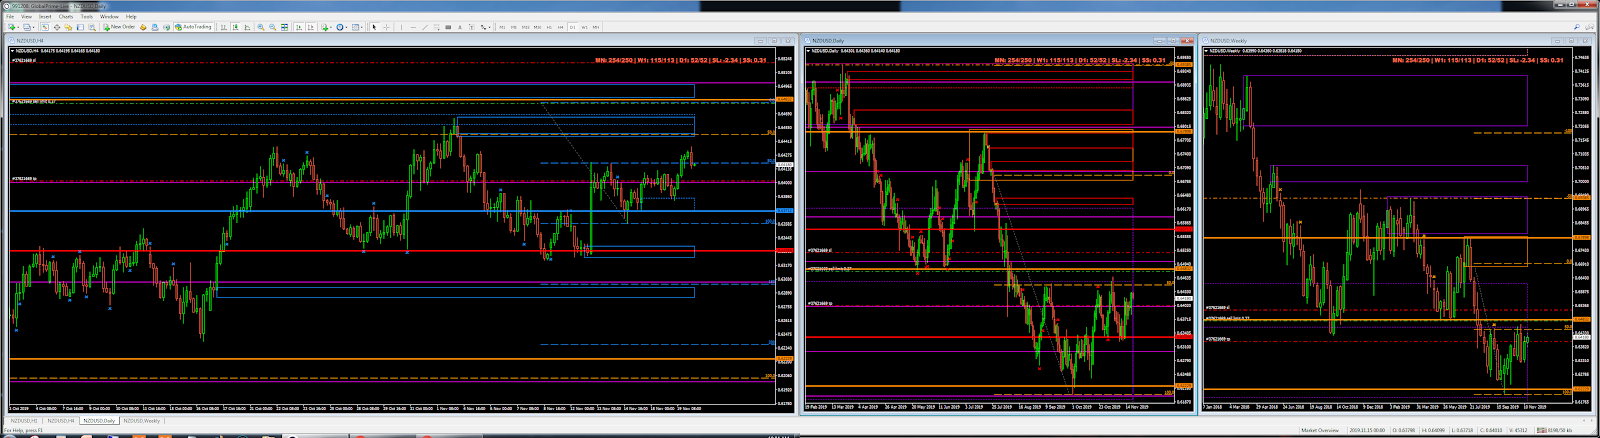
The NZD/USD has recently come to an extreme high, where a shift in the directional bias took effect after a fake-head type of movement whereby longs are initially induced to take a breakout trade, which coupled with the buy stop orders above, creates a sufficient pool of liquidity for the smart money to jump in paying premium cheap prices to dump NZD inventory. The moment that the order block that led to the breakout was re-taken to the downside, that was the confirmation that the market had a genuine interest to initiate a sell-side campaign, with an engagement into shorts ideally at the 50% retrac for an eventual 50% proj mov target.

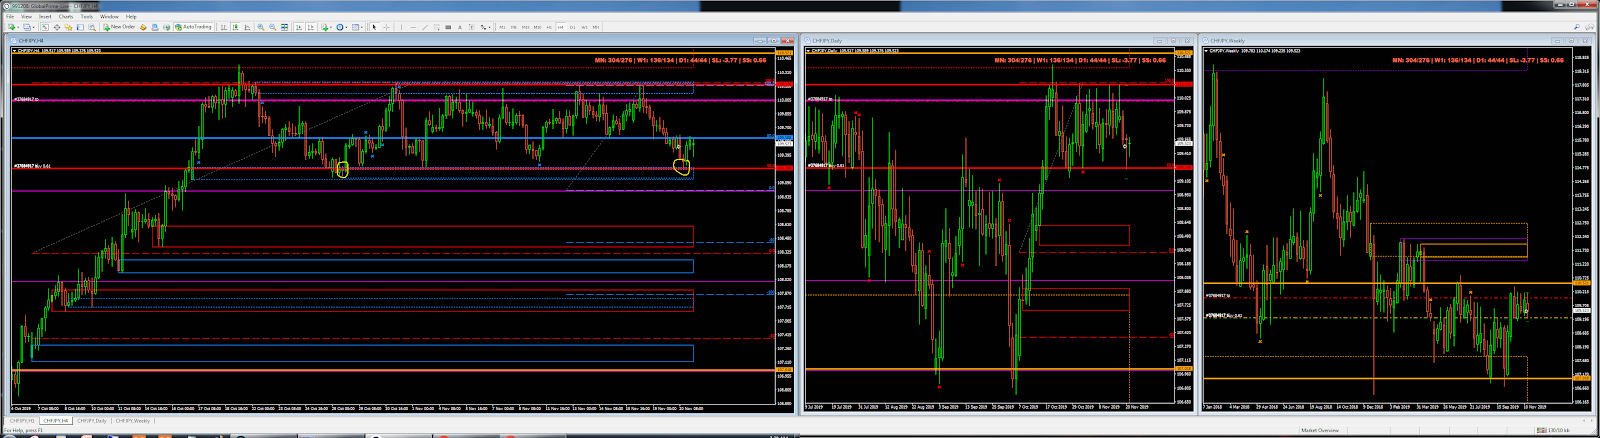
The GBP/CHF market has gifted the avid trader with a buy-side opportunity to bank on those short-sided caught upside down after a fake downside breakout. The moment that the price snapped back up with a shift in structure and taking out the prior order block in the process, it implied the odds were in favor of a follow up continuation once the 50% retrac got tested. It is therefore no surprise to have seen the quick response off this mentioned level, which aligned with Tuesday’s POC to add extra weight. Remember, at this point of entry, the market is caught short and the psyche has shifted, now looking to dump CHF longs in favor of the GBP.

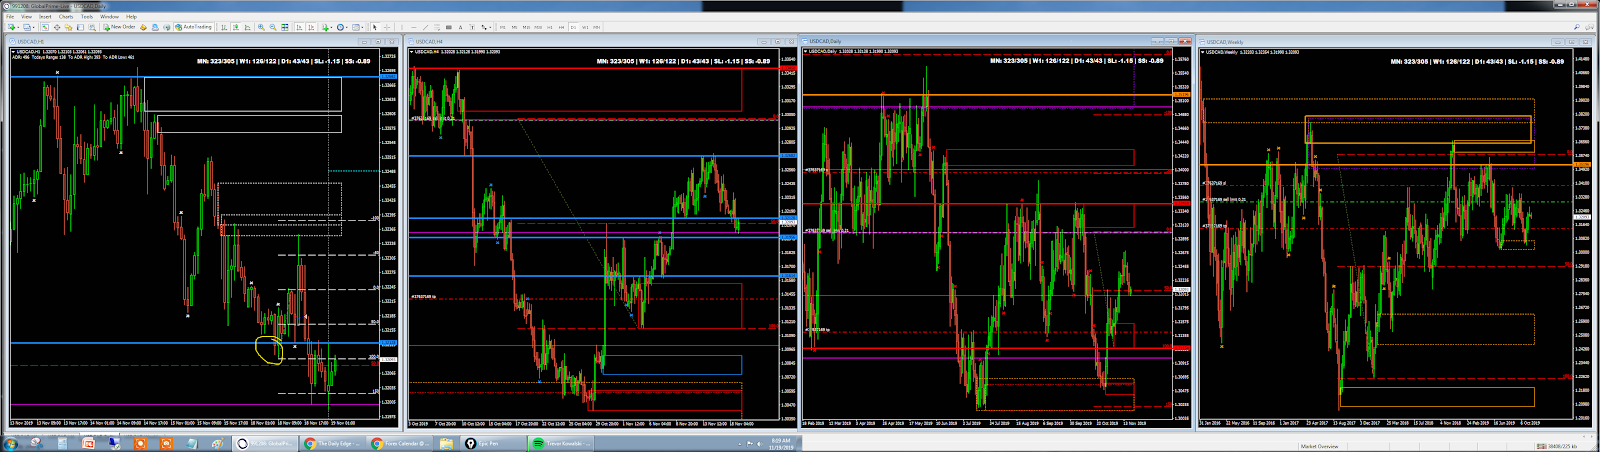
Last but not least, the USD/CAD has formed an identical pattern trapping traders as short are now forced to shift the stance after a short breakout failed to find follow through, with the subsequence recovery above the prior highs a testament that the intention of the market appears to have been collecting long contracts at an advantageous price before a potential resumption of the uptrend. Getting involved in long-sided business around the 50% retrac is a sensible area to manifest a long bias for this Wednesday, aiming for a move to the 50% proj.

Important Footnotes
USD Longs Thrive, 'Risk On' Solidifies
The USD maintains a bullish outlook this week, invigorated by the improvement of fundamentals. The Aussie has attracted even stronger bids though. Would you like to find out all the details to deconstruct and make sense of the movements in G8 FX. Are you interested to find out recent trading setups? Today' report delivers all that and much more...
The Daily Edge is authored by Ivan Delgado, 10y Forex Trader veteran & Market Insights Commentator at Global Prime. Feel free to follow Ivan on Twitter & Youtube weekly show. You can also subscribe to the mailing list to receive Ivan’s Daily wrap. The purpose of this content is to provide an assessment of the conditions, taking an in-depth look of market dynamics - fundamentals and technicals - determine daily biases and assist one’s trading decisions.
Let’s get started…
the Global Prime's Research section.
Nikkei, China has stepped up demands before finalizing a trade deal, asking for a roll back of the Sept tariffs and the full cancellation of the planned tax increases in Dec, something the US is considering according to the FT and Politico. The Nikkei notes that “Beijing has doubled down on demands that may threaten to delay a preliminary trade agreement with the U.S.” If the US were to agree to a cancelation of the tariffs, media reports suggest that the US would expect in return more provisions on intellectual property protection, an increase in the purchases of US agricultural products and the added pre-condition for President Xi to ink the agreement in the US.
Congruence in what China is asking by media: In a new report by the Chinese-based Global Times, the rhetoric is congruent, noting that “China will not accept Phase One trade deal if US does not suspend tariffs, according to a former Chinese trade official cited in the Global Times. “The US is "very anxious' to reach a trade deal with China but Beijing won't agree if the US does not cancel some tariffs, Wei Jianguo, former vice minister of commerce, told the Global Times.”
Risk of no Phase One trade deal exist: As reiterated in my previous write ups, it is in these last final steps before reaching the finishing line that the sticking points can easily hinder all the progress made, hence the risk of a breakdown exists. The danger here is that the market has fully priced in a positive outcome, so any major setback would create some dramatic moves in financial markets. What seems clear now is that for a Phase One deal to take effect, the US must remove some tariffs, which in turn will depend on the willingness of China to extend further concessions in exchange. Either way, one side faces the prospects of looking ‘soft’ in front of their own political circles and people.
US ISM non-manuf shows solid recovery: The US ISM non-manufacturing index for October came in at 54.7 vs 53.5 estimate, which is a great welcoming news for the US economy as it demonstrates that the recessionary environment in the US ISM manufacturing series (came poor last Friday) is not spreading out into the wider economy. The news adds to the upbeat US NFP report from Friday, helping to keep the strong bid tone in the US Dollar, so far the top performer this week. That said, it’s worth noting that the index remains near the recent historical lows.
'True risk on' back in vogue: The risk dynamics, as portrayed by the ‘risk-weighted line’ monitored at Global Prime, accounting for the dual performance of the S&P 500 and the US 30y bond yield, has made new trend highs, reinforcing the notion of the ‘true risk on’ profile in the market. This movement provides a ‘Goldilocks’ platform for the JPY, CHF and gold to keep deteriorating in value. The assumption that a US-China Phase One trade deal is imminent has emboldened the groovy vibes, as the market finds it credible enough that the speculation on a removal of tariffs by the US came from reputable sources such as the Politico and FT. The weakness in the USD/CNY below the 7 level for the first time since August underpins the risk environment too.
Conservatives lead in the polls: The latest UK poll of polls shows the Conservative Gov't with a 38% lead, according to Politico. Below I illustrate, courtesy of Forexlive, an info graph showing the current polls (on the left) as it compares to the 2017 last General election outcome. The Lib Dems and Brexit Party have improved the results markedly, which means that if the Brexit Party forms an alliance with the Conservatives, a majority will be formed, while if not, a hung parliament is the danger.
RBA shifts stance to less dovish: RBA decided to keep the cash target rate at 0.75%, as expected, leading to a strong rise in the Australian Dollar after an upgrade in the forward-guidance. In the final paragraph of the statement, the RBA added the following remark: "The easing of monetary policy since June is supporting employment and income growth in Australia and a return of inflation to the medium-term target range." The market has interpreted the comment as a hint that the easing bias may no longer be warranted. Even if the RBA did leave the door open to ease further if needed, they sound as if that would be conditional to external factors.
If you found this fundamental summary helpful, just click here to share it!
give us a share by just clicking here!
The AUD/JPY long position off a liquidity-rich area in alignment with the risk appetite dynamics at play as represented by the overlapping black line (SP500 + US30Y) paid off exceptionally well. The level was always going to be a pristine location to engage in long-sided action at what should be perceived as a ‘value area’ as per the divergence between price and the risk line. The long trade went up all the way to reach the full take profit target.
The NZD/USD has recently come to an extreme high, where a shift in the directional bias took effect after a fake-head type of movement whereby longs are initially induced to take a breakout trade, which coupled with the buy stop orders above, creates a sufficient pool of liquidity for the smart money to jump in paying premium cheap prices to dump NZD inventory. The moment that the order block that led to the breakout was re-taken to the downside, that was the confirmation that the market had a genuine interest to initiate a sell-side campaign, with an engagement into shorts ideally at the 50% retrac for an eventual 50% proj mov target.
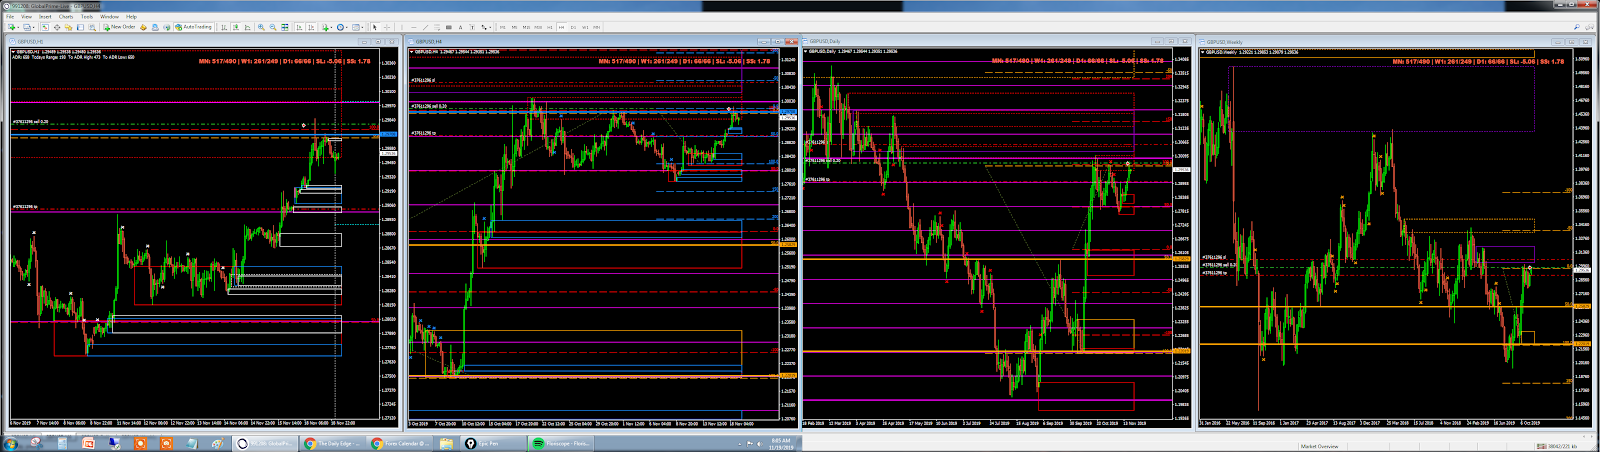
The GBP/CHF market has gifted the avid trader with a buy-side opportunity to bank on those short-sided caught upside down after a fake downside breakout. The moment that the price snapped back up with a shift in structure and taking out the prior order block in the process, it implied the odds were in favor of a follow up continuation once the 50% retrac got tested. It is therefore no surprise to have seen the quick response off this mentioned level, which aligned with Tuesday’s POC to add extra weight. Remember, at this point of entry, the market is caught short and the psyche has shifted, now looking to dump CHF longs in favor of the GBP.
Last but not least, the USD/CAD has formed an identical pattern trapping traders as short are now forced to shift the stance after a short breakout failed to find follow through, with the subsequence recovery above the prior highs a testament that the intention of the market appears to have been collecting long contracts at an advantageous price before a potential resumption of the uptrend. Getting involved in long-sided business around the 50% retrac is a sensible area to manifest a long bias for this Wednesday, aiming for a move to the 50% proj.
Important Footnotes
- Risk model: The fact that financial markets have become so intertwined and dynamic makes it essential to stay constantly in tune with market conditions and adapt to new environments. This prop model will assist you to gauge the context that you are trading so that you can significantly reduce the downside risks. To understand the principles applied in the assessment of this model, refer to the tutorial How to Unpack Risk Sentiment Profiles
- Cycles: Markets evolve in cycles followed by a period of distribution and/or accumulation. To understand the principles applied in the assessment of cycles, refer to the tutorial How To Read Market Structures In Forex
- POC: It refers to the point of control. It represents the areas of most interest by trading volume and should act as walls of bids/offers that may result in price reversals. The volume profile analysis tracks trading activity over a specified time period at specified price levels. The study reveals the constant evolution of the market auction process. If you wish to find out more about the importance of the POC, refer to the tutorial How to Read Volume Profile Structures
- Tick Volume: Price updates activity provides great insights into the actual buy or sell-side commitment to be engaged into a specific directional movement. Studies validate that price updates (tick volume) are highly correlated to actual traded volume, with the correlation being very high, when looking at hourly data. If you wish to find out more about the importance tick volume, refer to the tutorial on Why Is Tick Volume Important To Monitor?
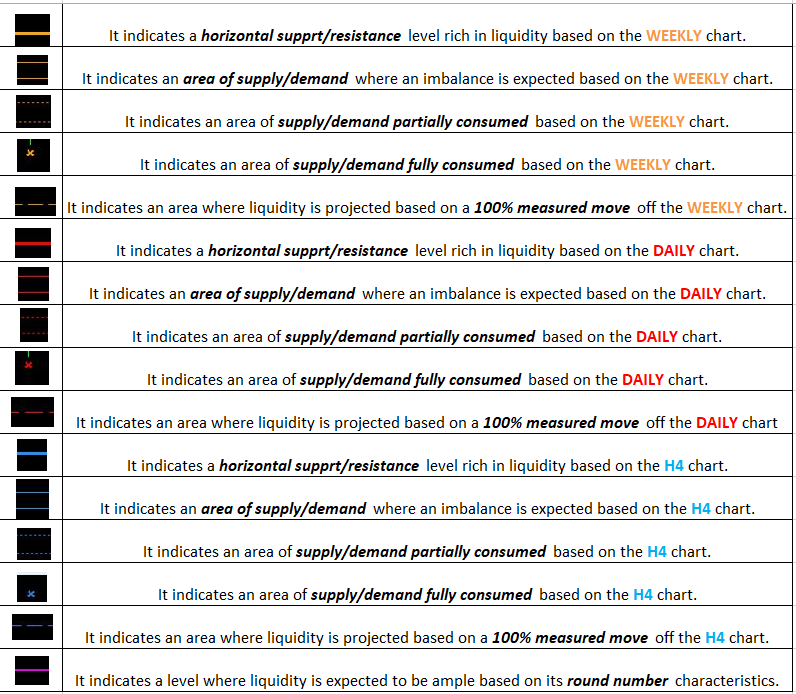
- Horizontal Support/Resistance: Unlike levels of dynamic support or resistance or more subjective measurements such as fibonacci retracements, pivot points, trendlines, or other forms of reactive areas, the horizontal lines of support and resistance are universal concepts used by the majority of market participants. It, therefore, makes the areas the most widely followed and relevant to monitor. The Ultimate Guide To Identify Areas Of High Interest In Any Market
- Trendlines: Besides the horizontal lines, trendlines are helpful as a visual representation of the trend. The trendlines are drawn respecting a series of rules that determine the validation of a new cycle being created. Therefore, these trendline drawn in the chart hinge to a certain interpretation of market structures.
- Fundamentals: It’s important to highlight that the daily market outlook provided in this report is subject to the impact of the fundamental news. Any unexpected news may cause the price to behave erratically in the short term.
- Projection Targets: The usefulness of the 100% projection resides in the symmetry and harmonic relationships of market cycles. By drawing a 100% projection, you can anticipate the area in the chart where some type of pause and potential reversals in price is likely to occur, due to 1. The side in control of the cycle takes profits 2. Counter-trend positions are added by contrarian players 3. These are price points where limit orders are set by market-makers. You can find out more by reading the tutorial on The Magical 100% Fibonacci Projection