IvanGlobalPrime
Company Representative
- Messages
- 36
Find my latest market thoughts
G8 FX Taken Hostage By US-China Trade Rhetoric
The market remains fixated on the US-China trade headline, even if the base case continues to be pricing for an optimistic outcome. However, there is plenty of noise with little to no substance that can anchor the pretense of both sides so far. The lack of G8 FX fundamental drivers (exc CAD) + barrage of conflicting trade headlines led to little net changes for the week. Find out the latest in today's report.
The Daily Edge is authored by Ivan Delgado, 10y Forex Trader veteran & Market Insights Commentator at Global Prime. Feel free to follow Ivan on Twitter & Youtube weekly show. You can also subscribe to the mailing list to receive Ivan’s Daily wrap. The purpose of this content is to provide an assessment of the conditions, taking an in-depth look of market dynamics - fundamentals and technicals - determine daily biases and assist one’s trading decisions.
Let’s get started…
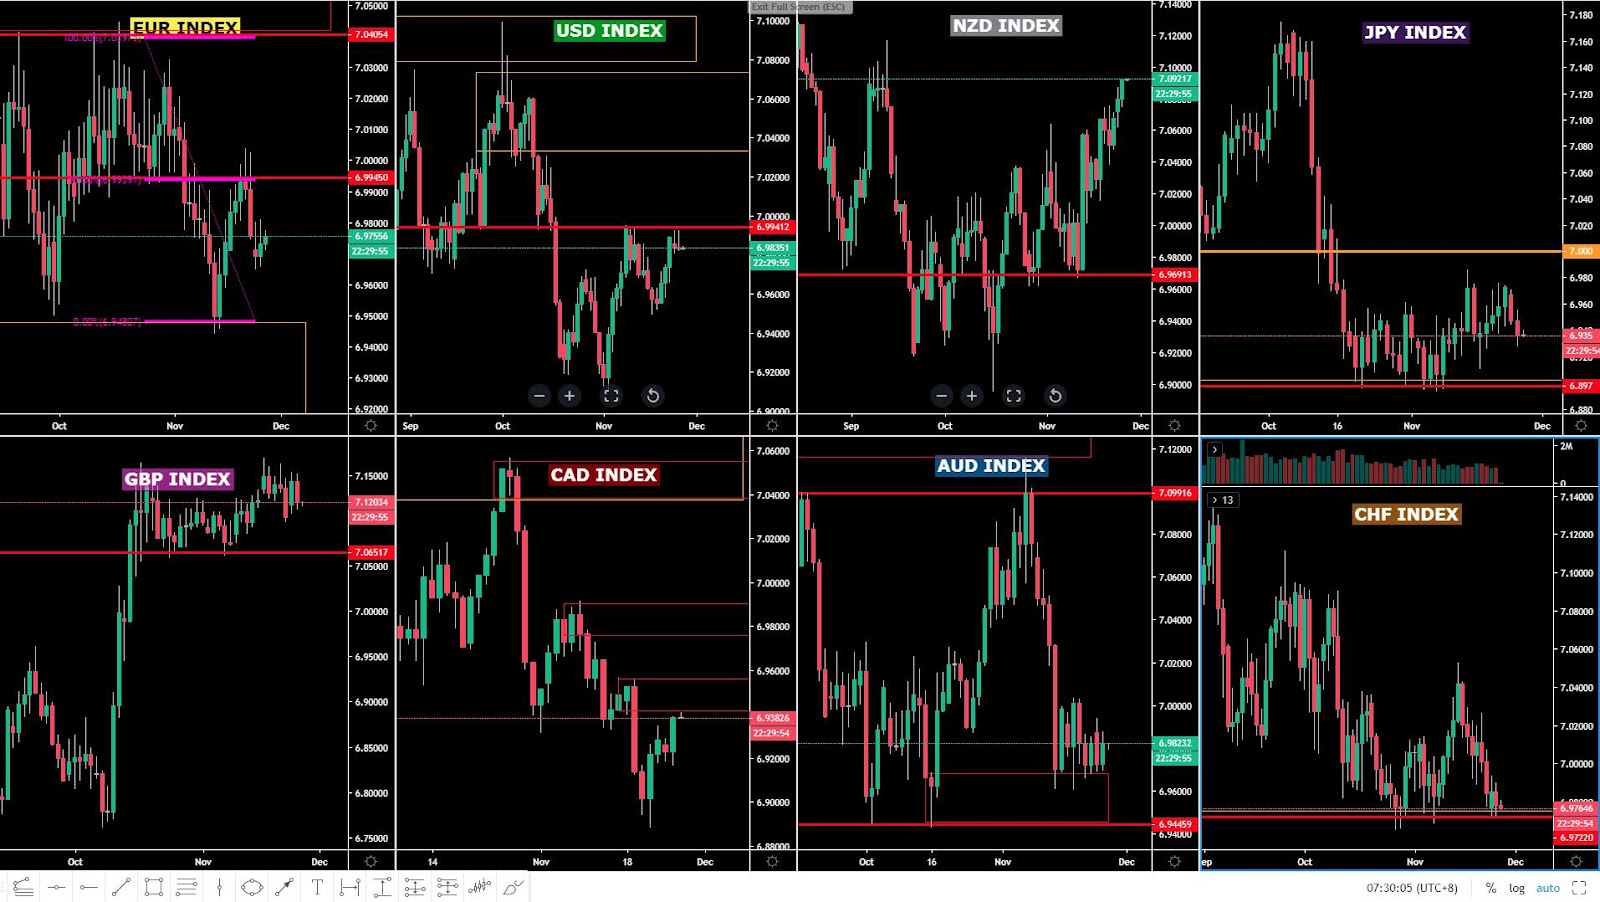
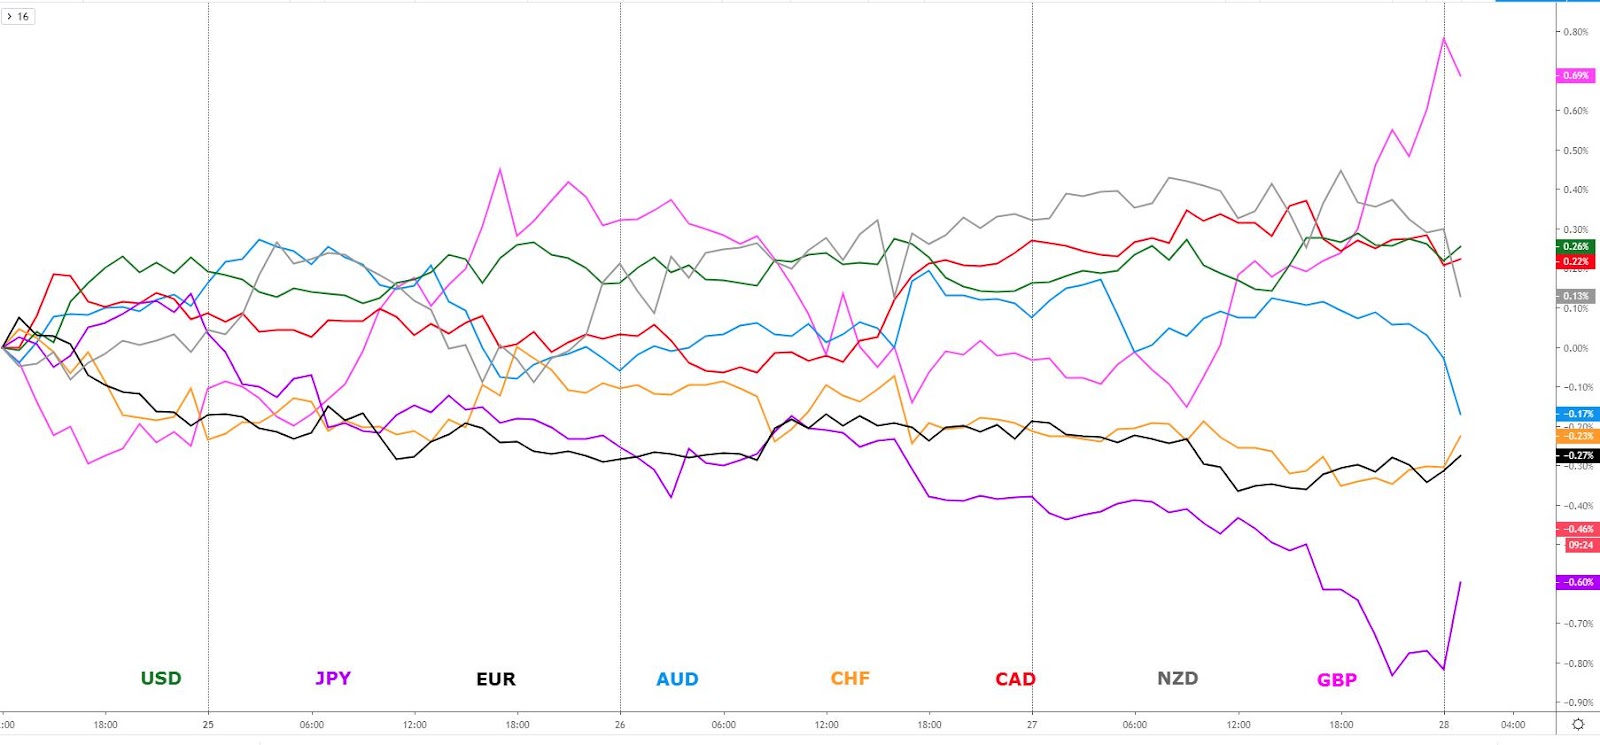
Quick Take
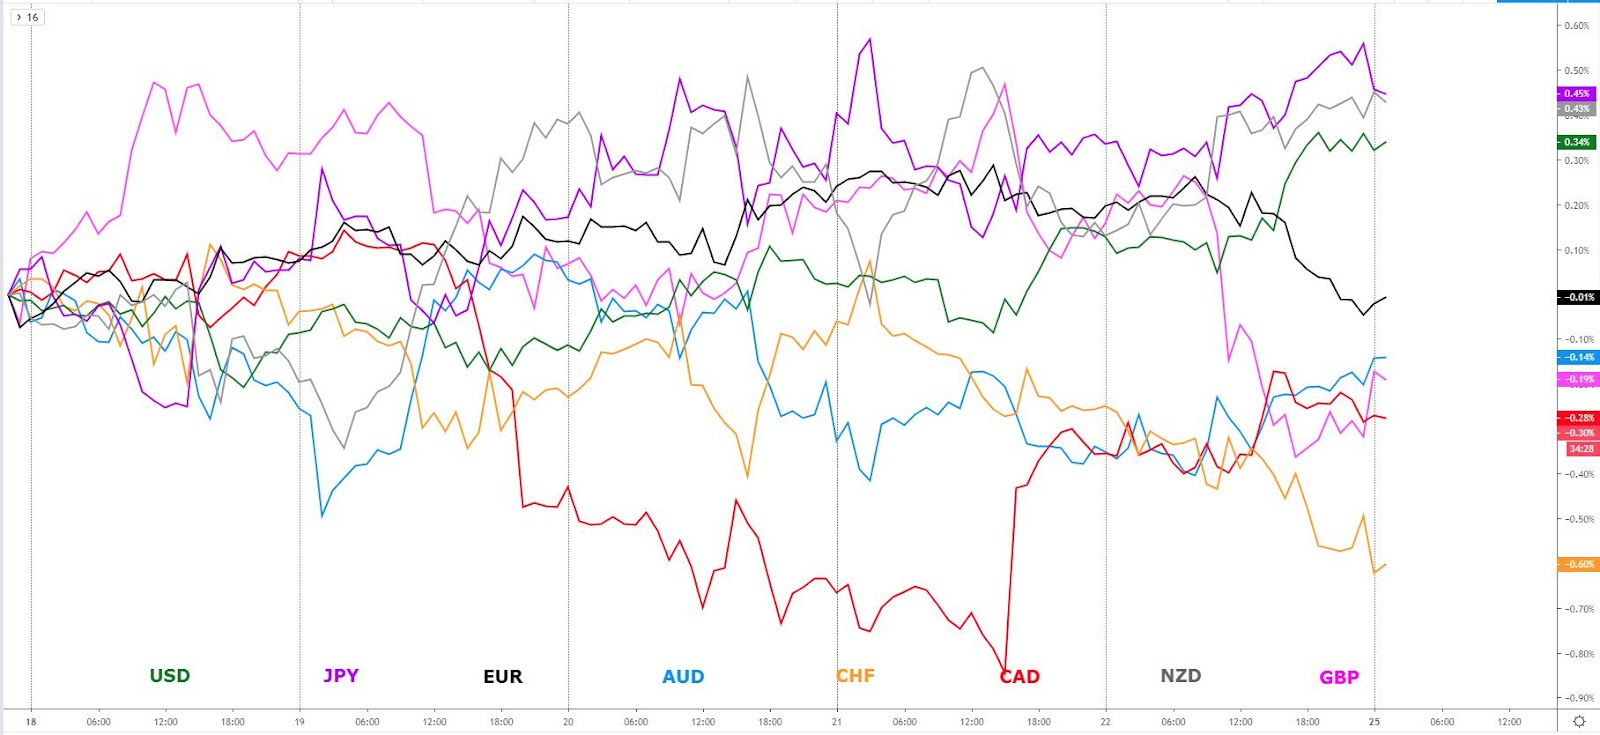
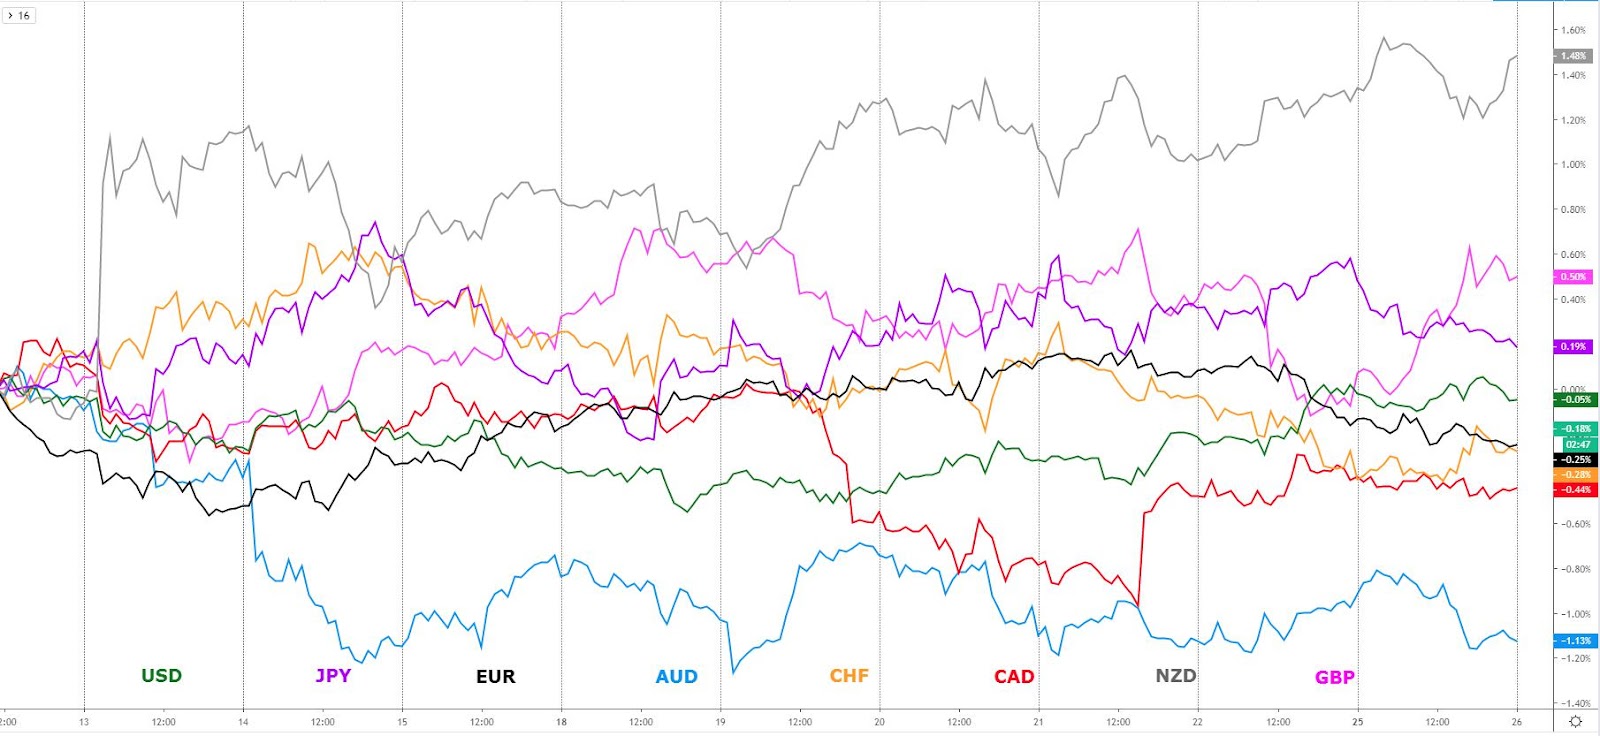
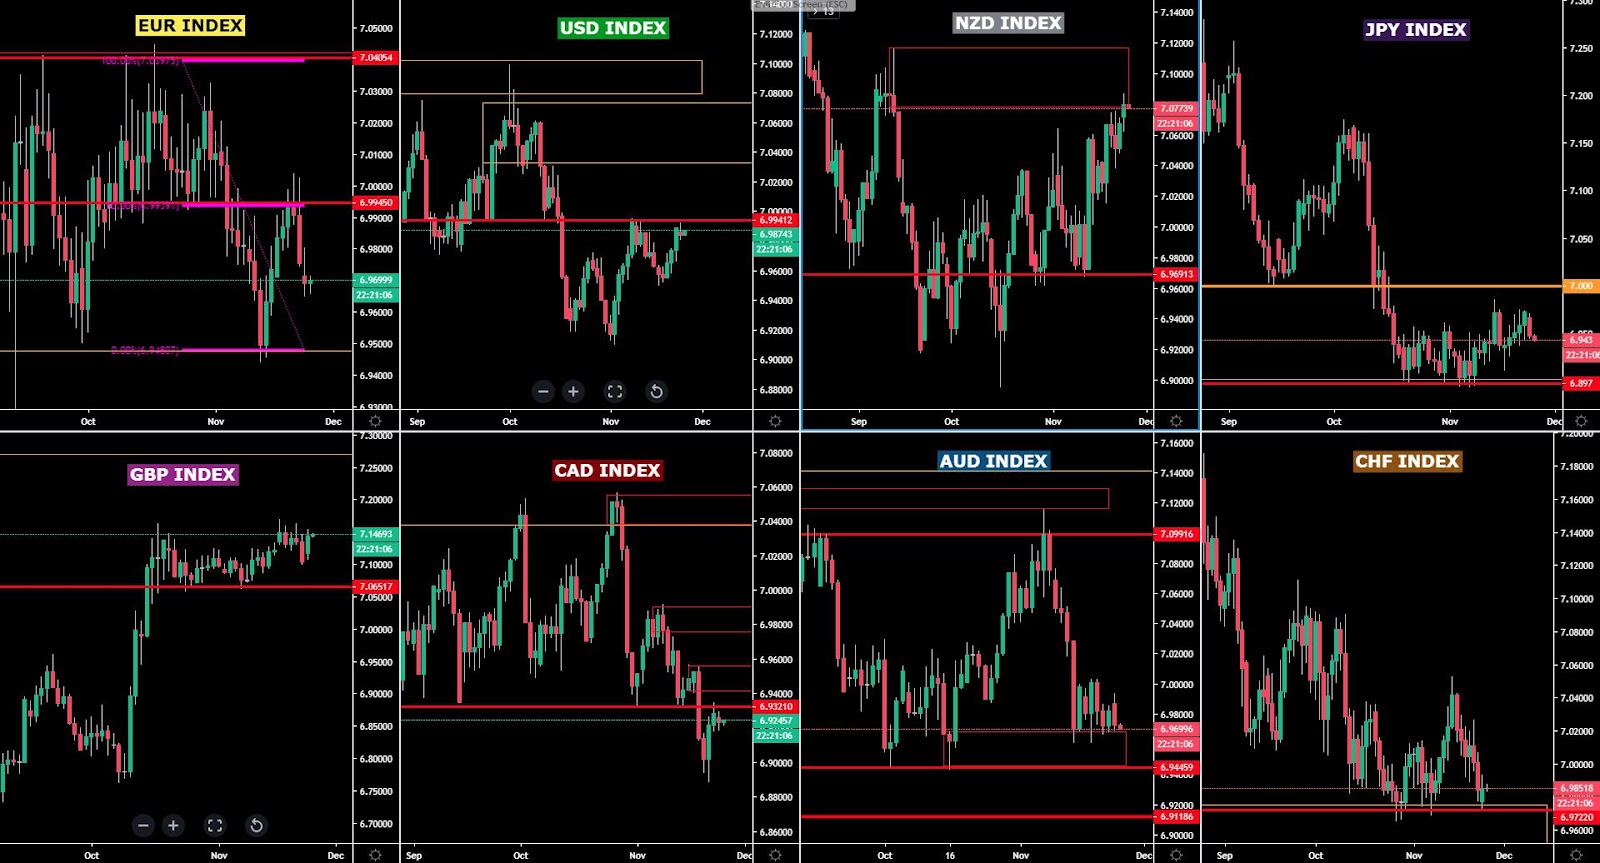
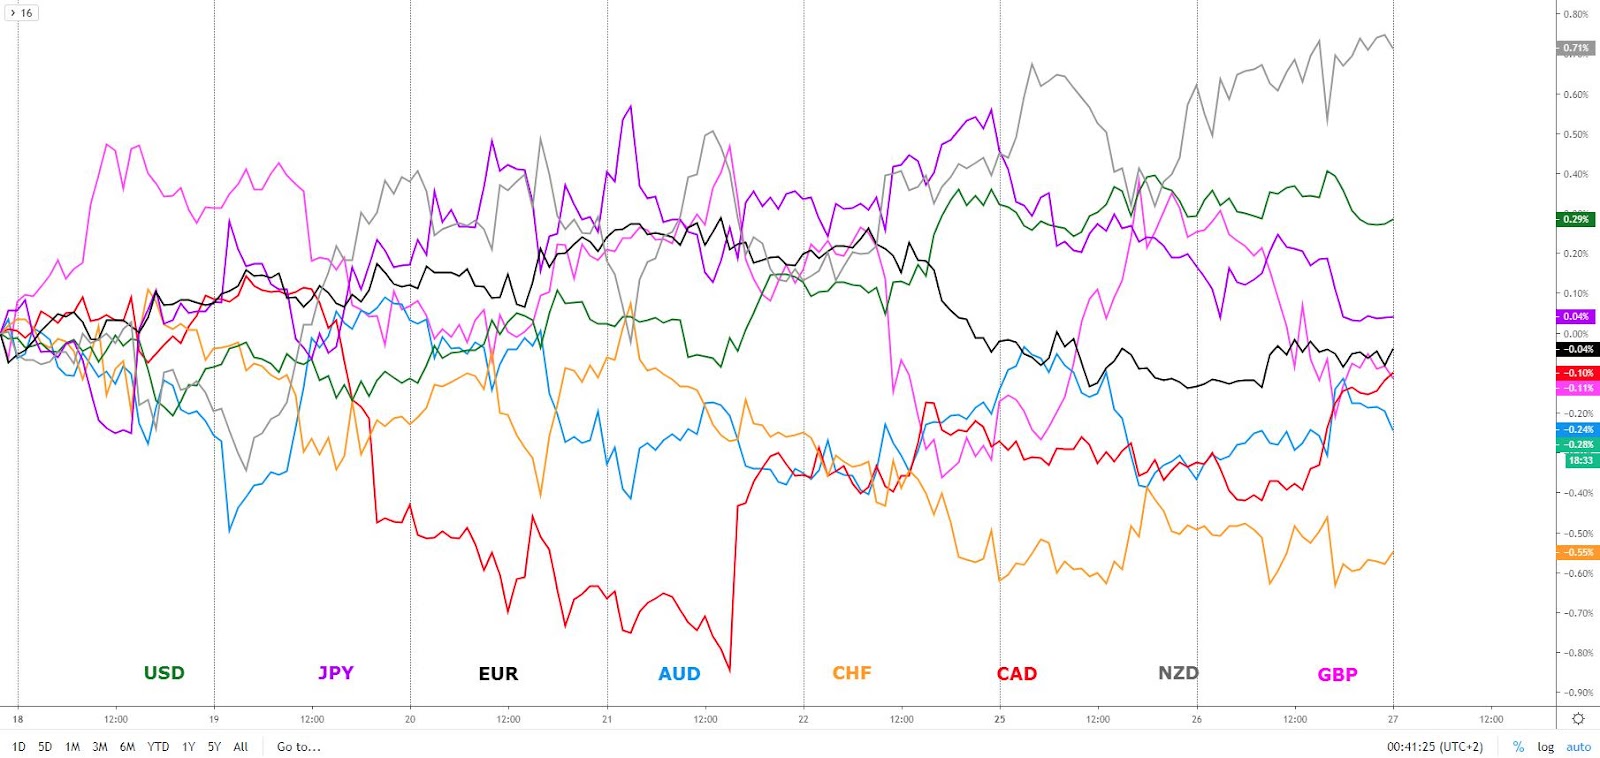
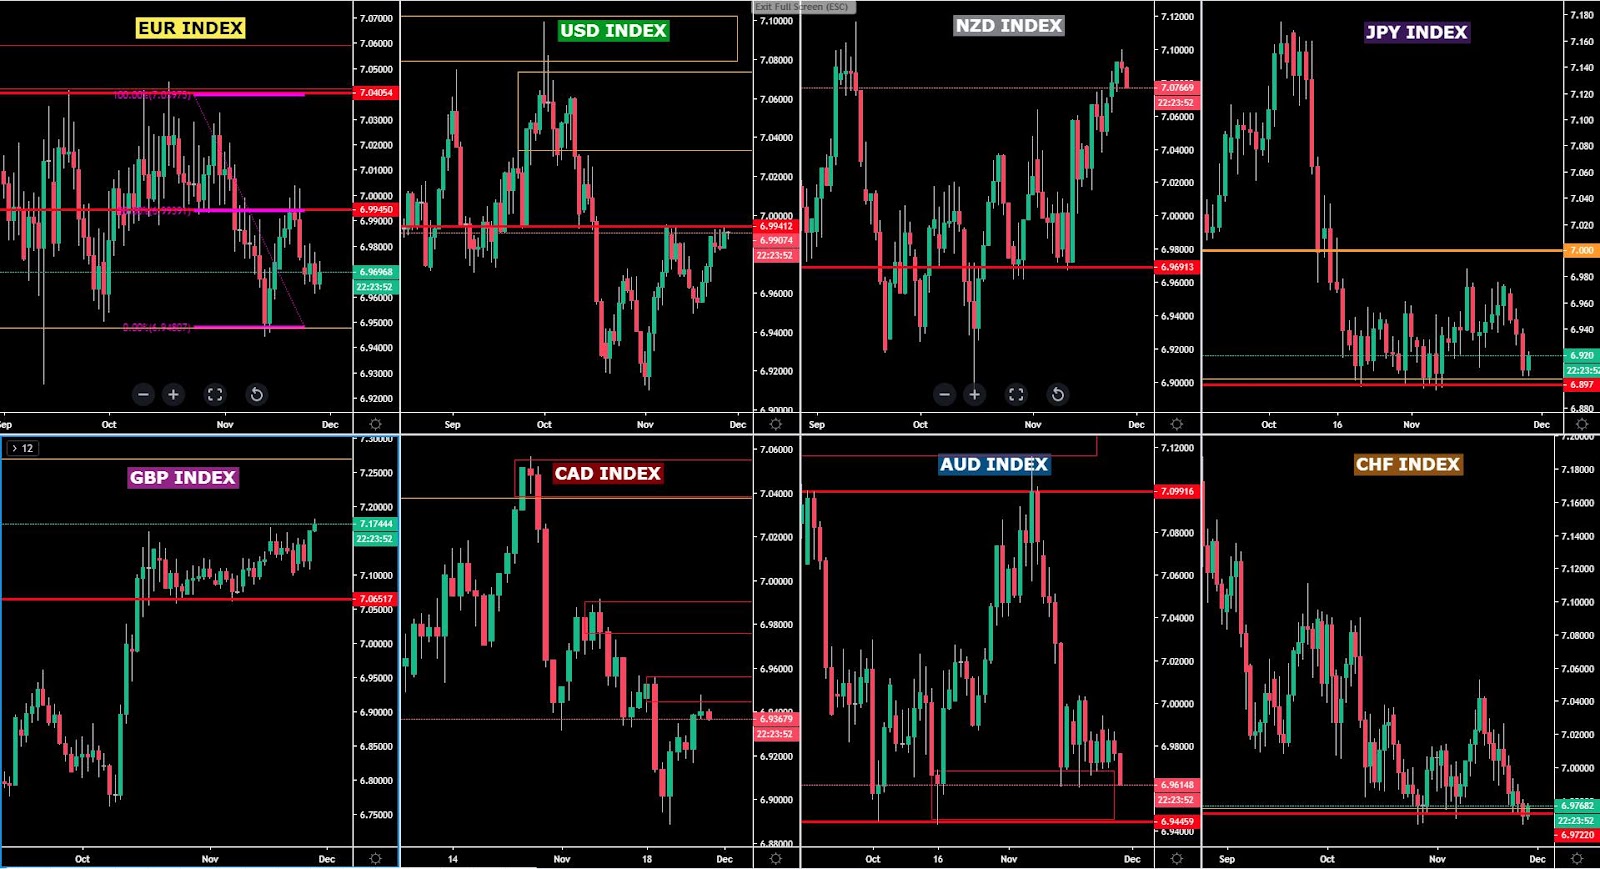
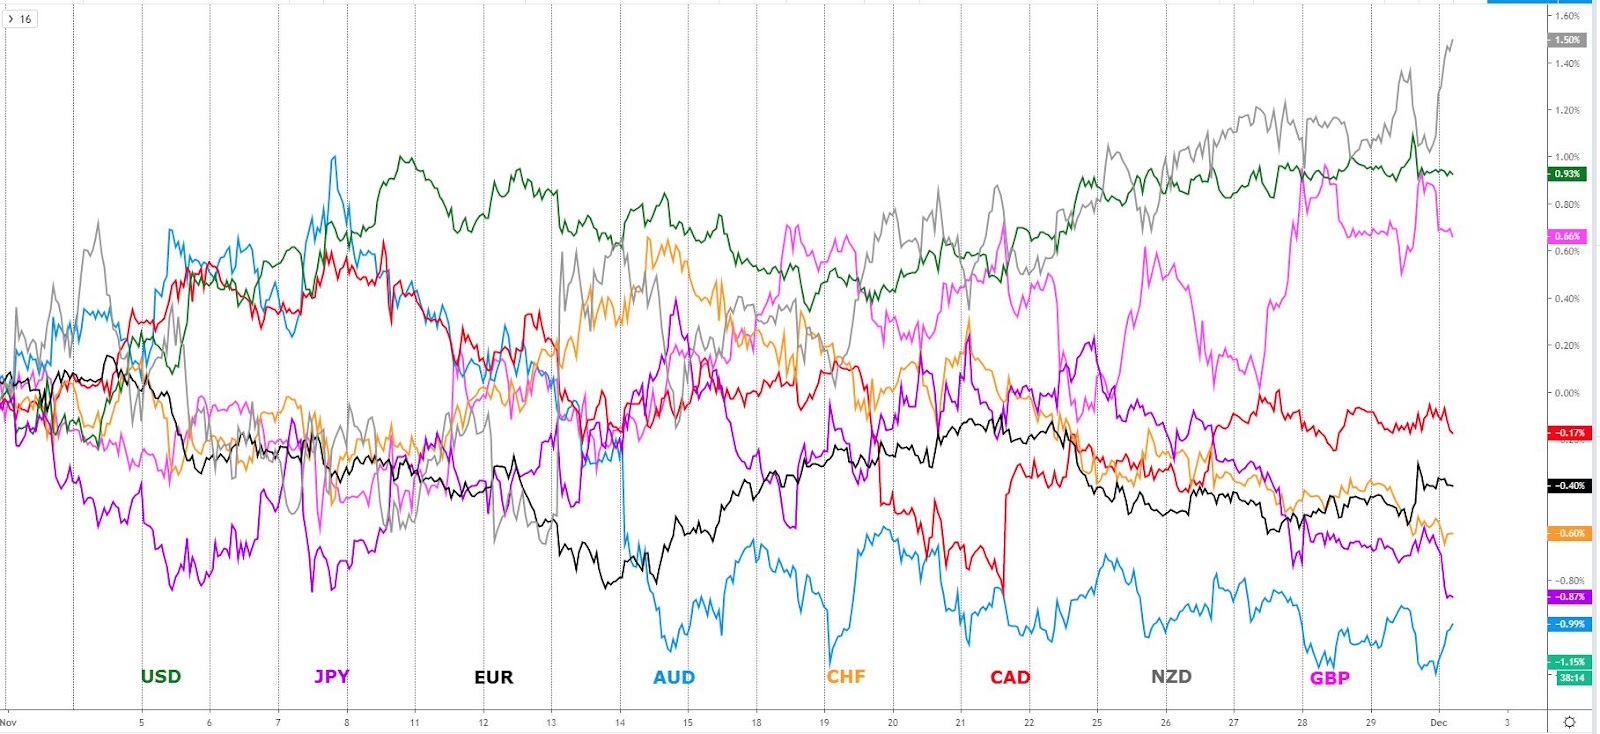
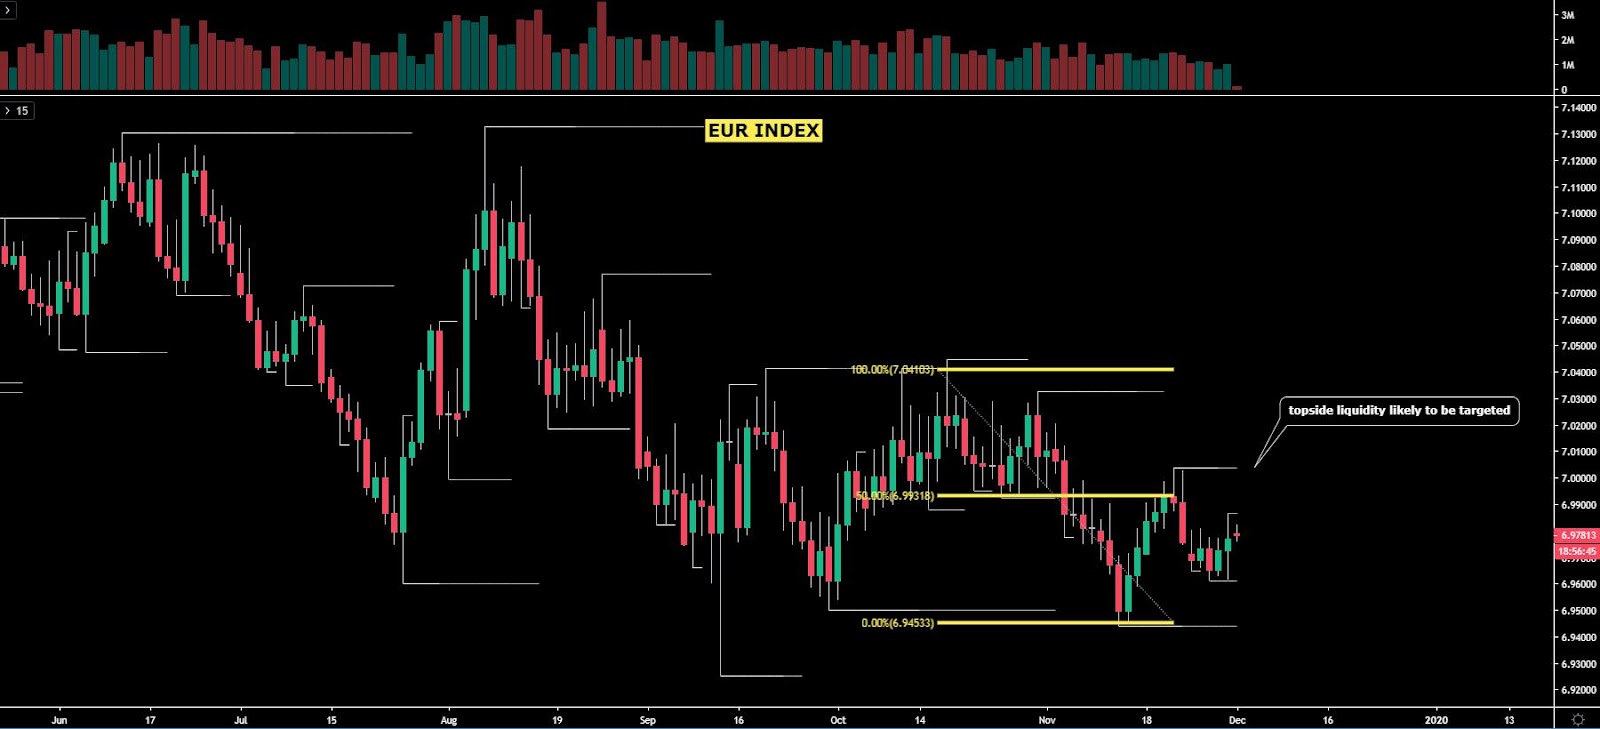
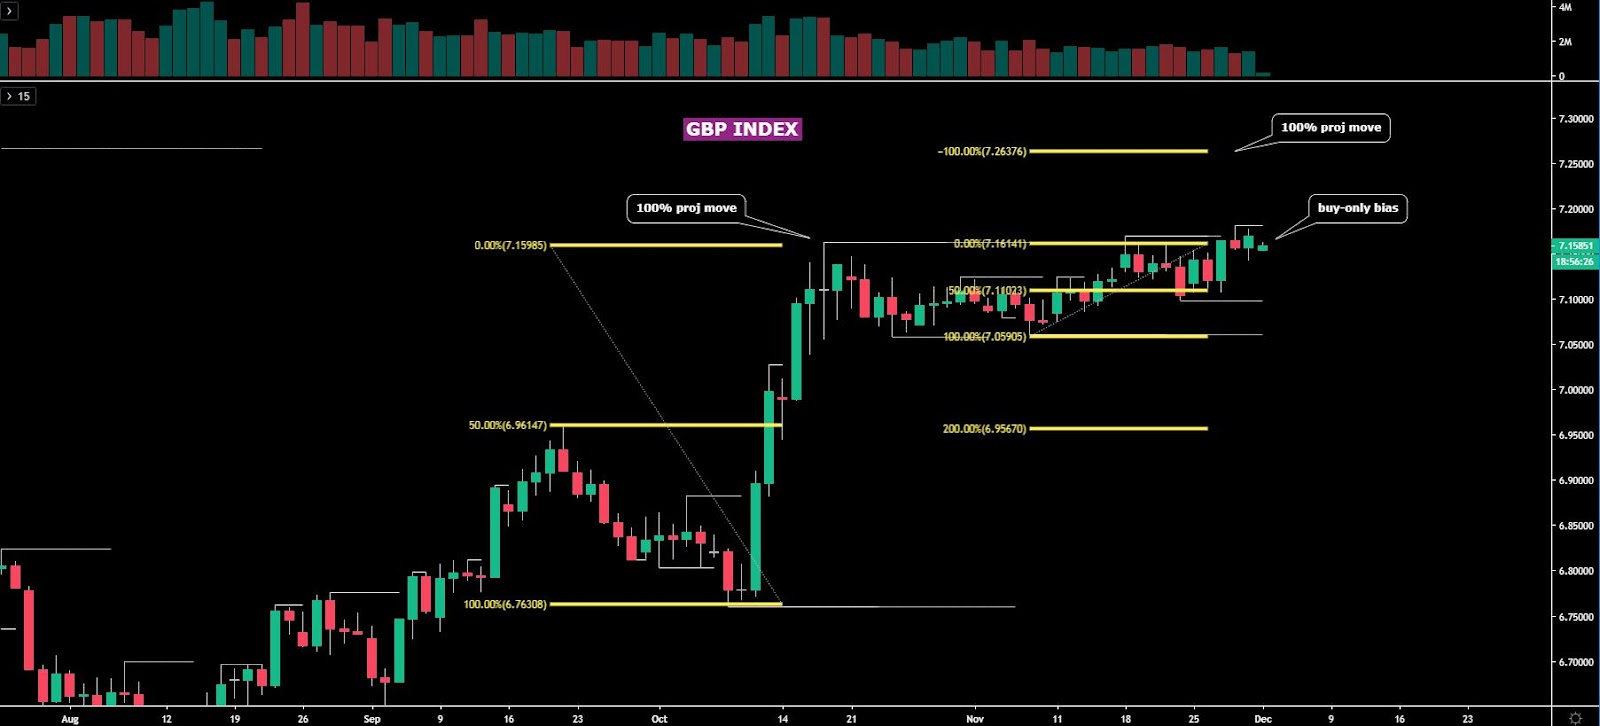
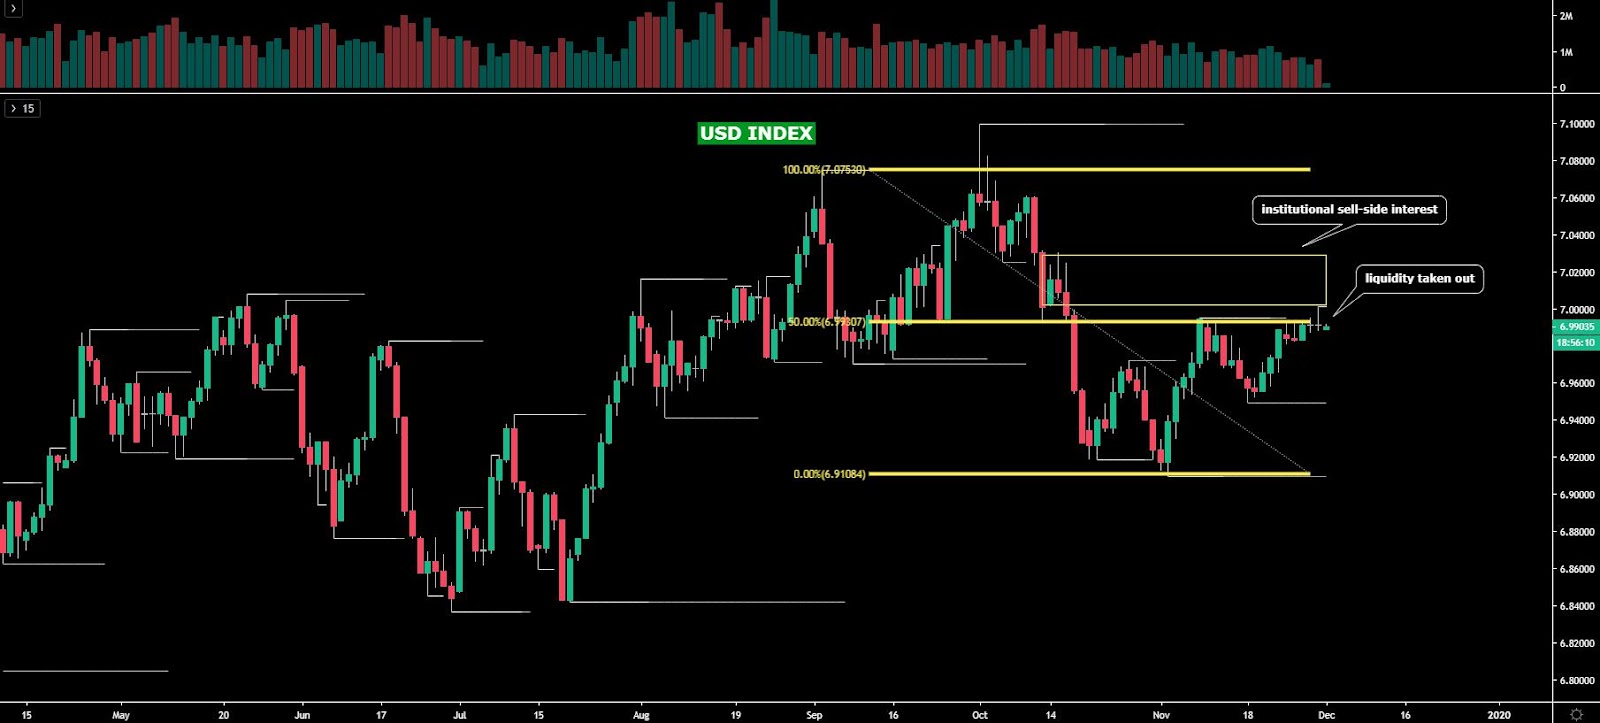
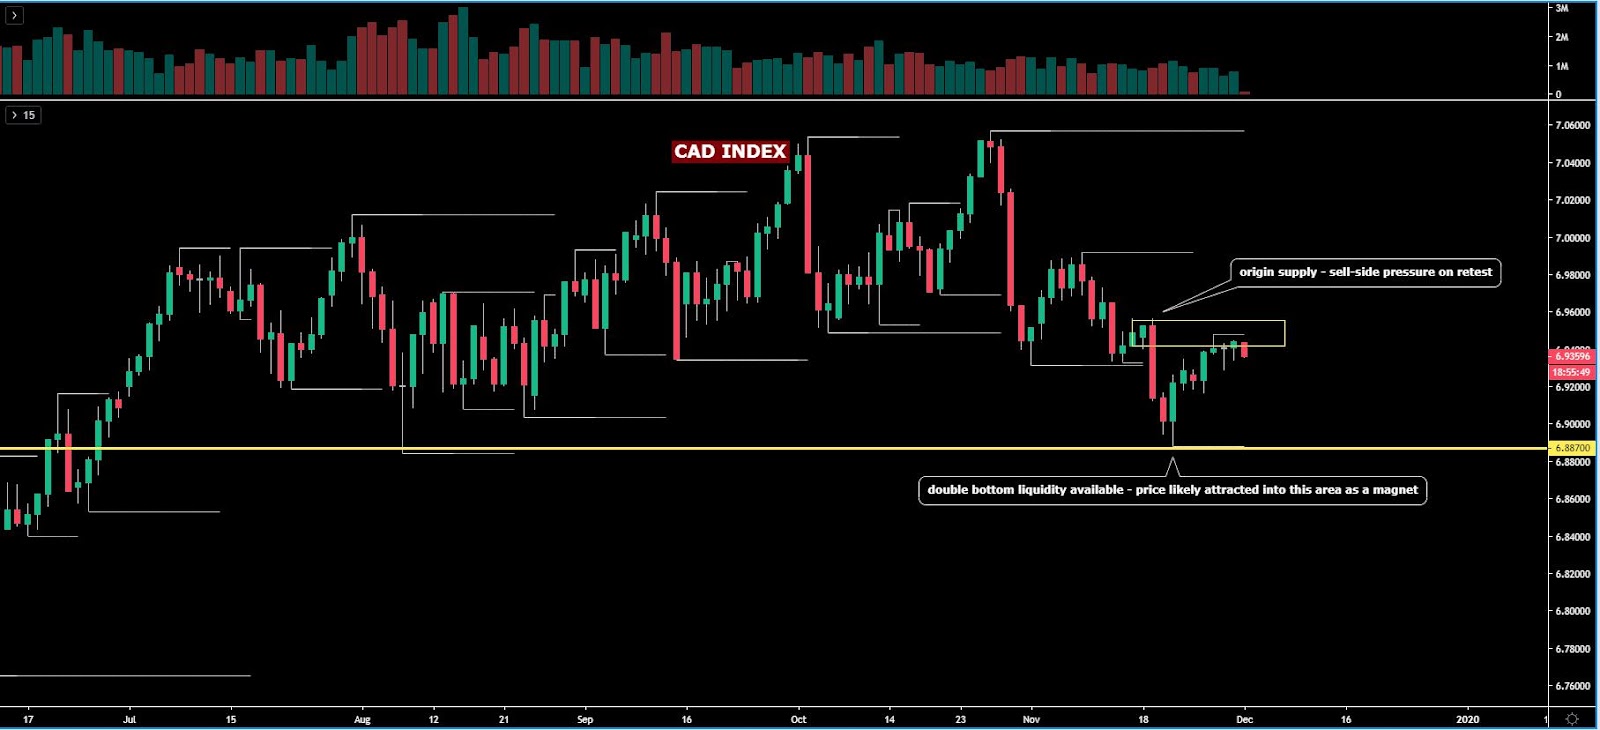
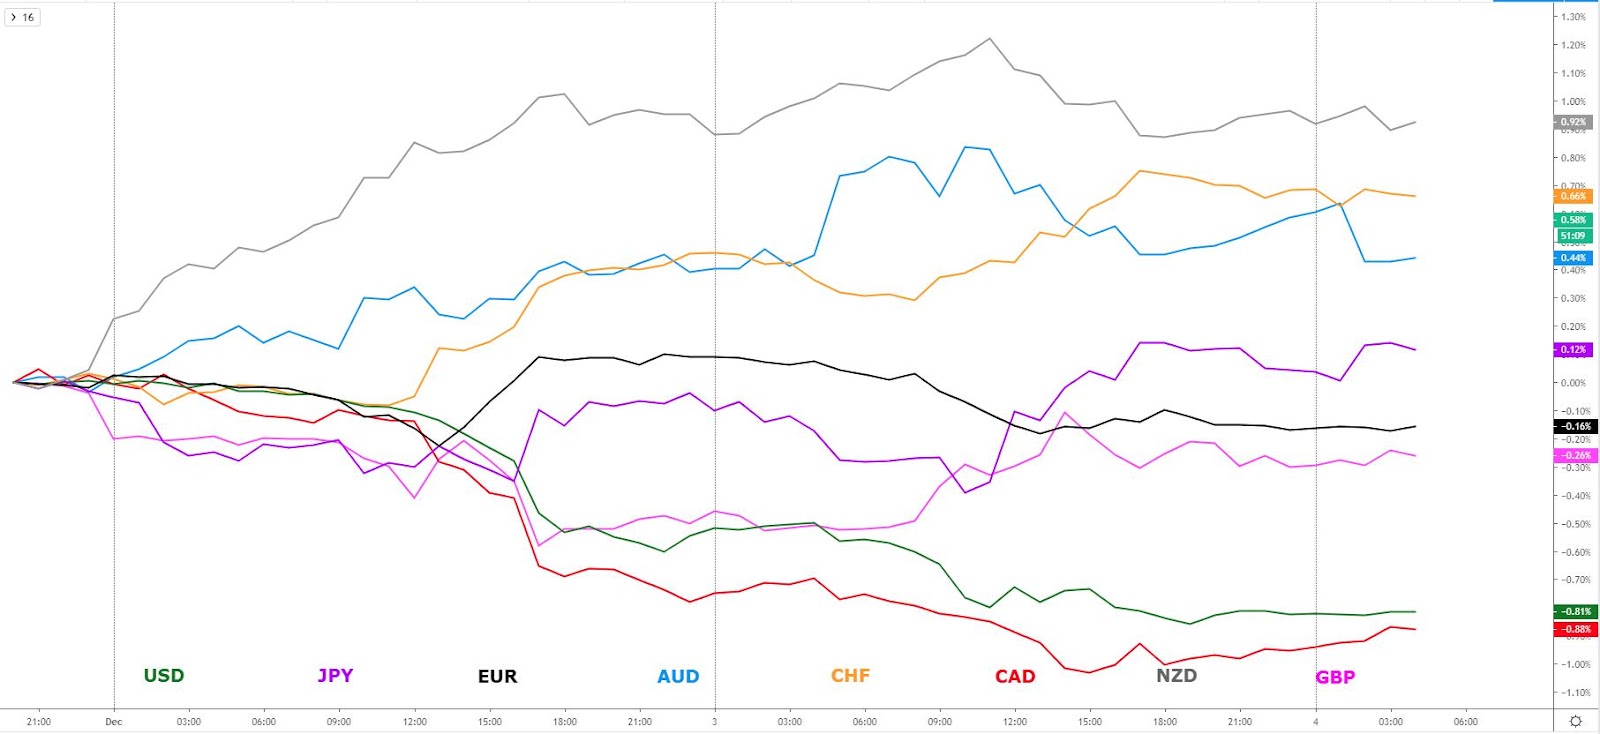
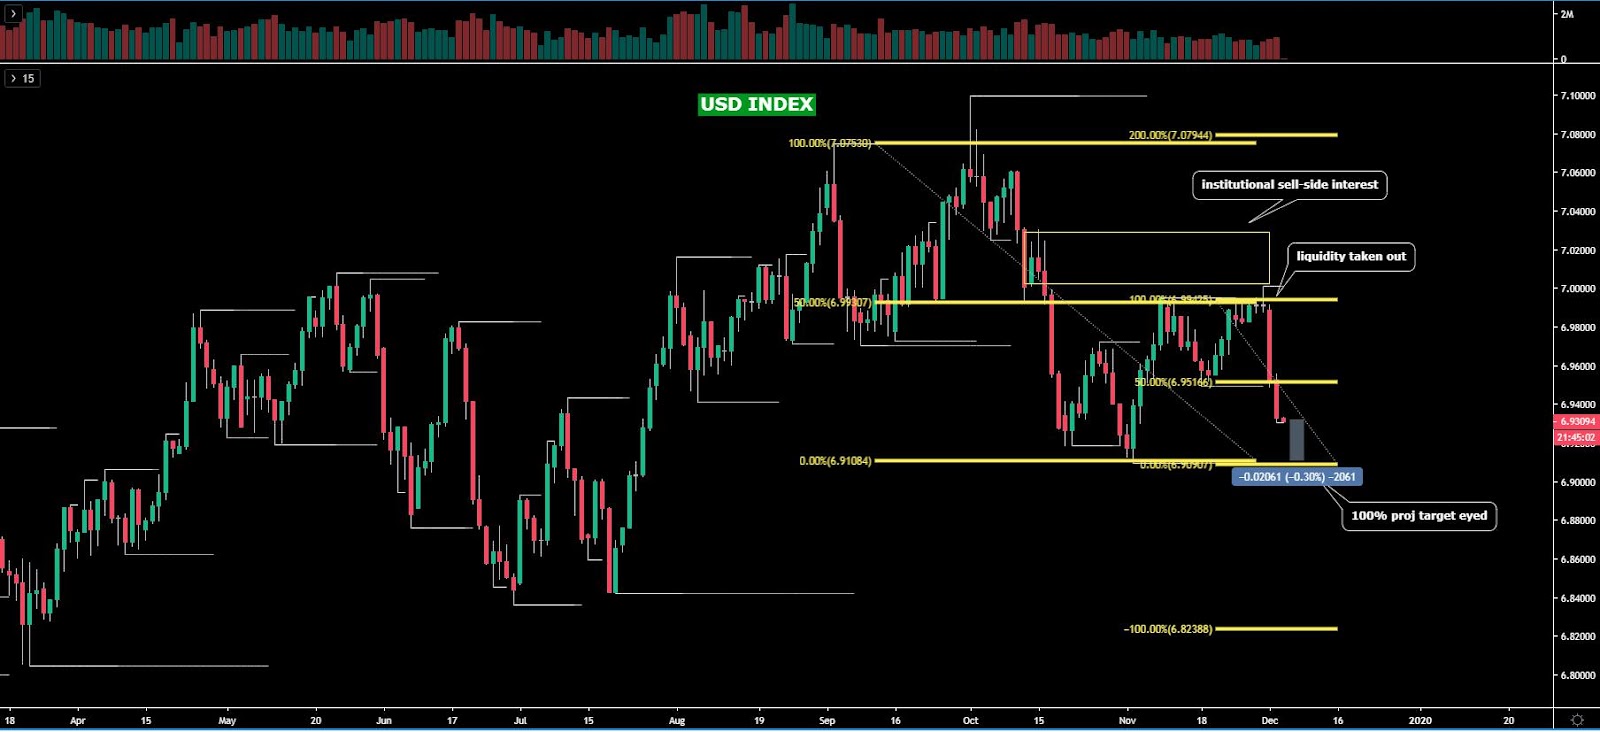
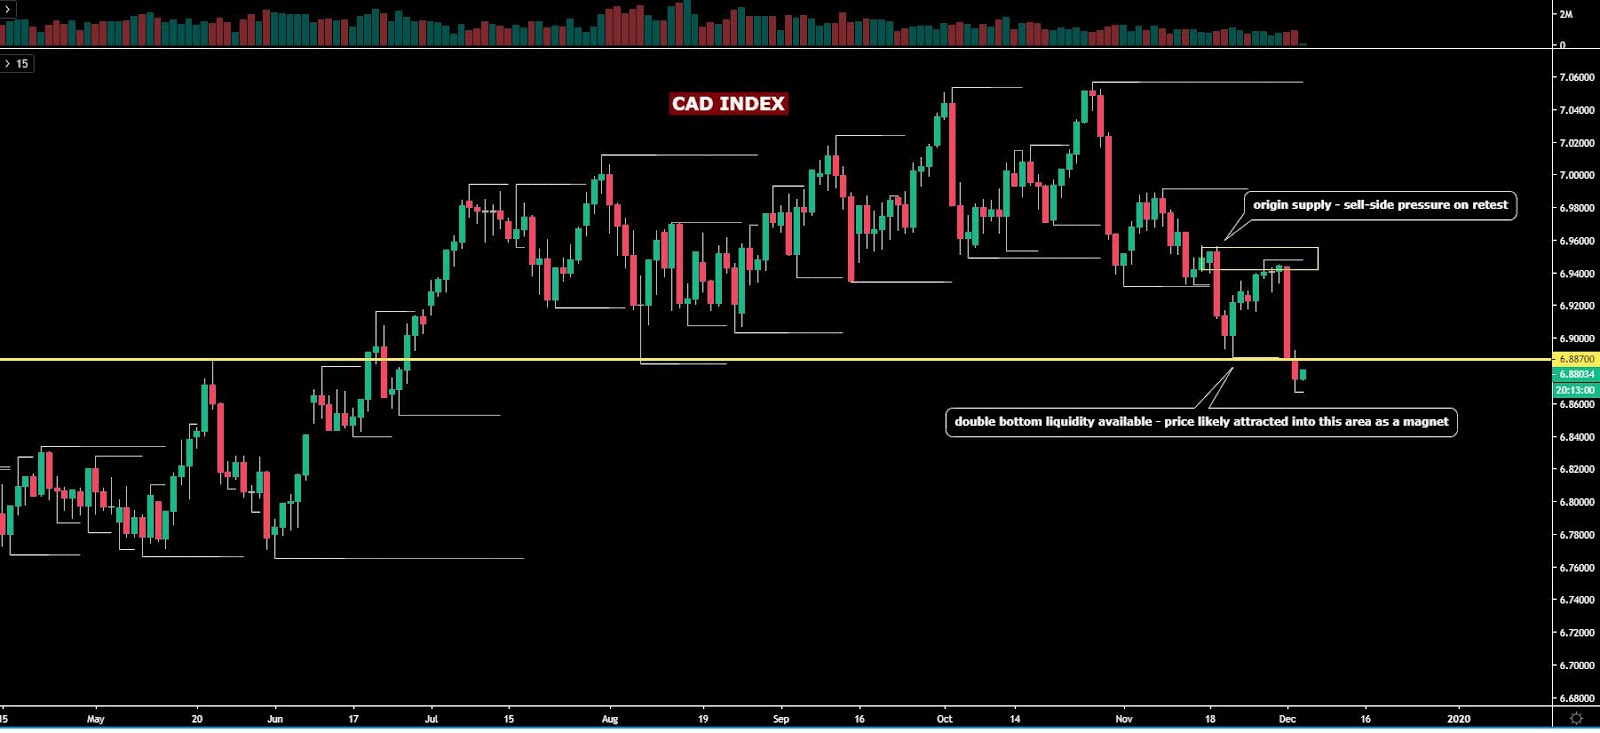
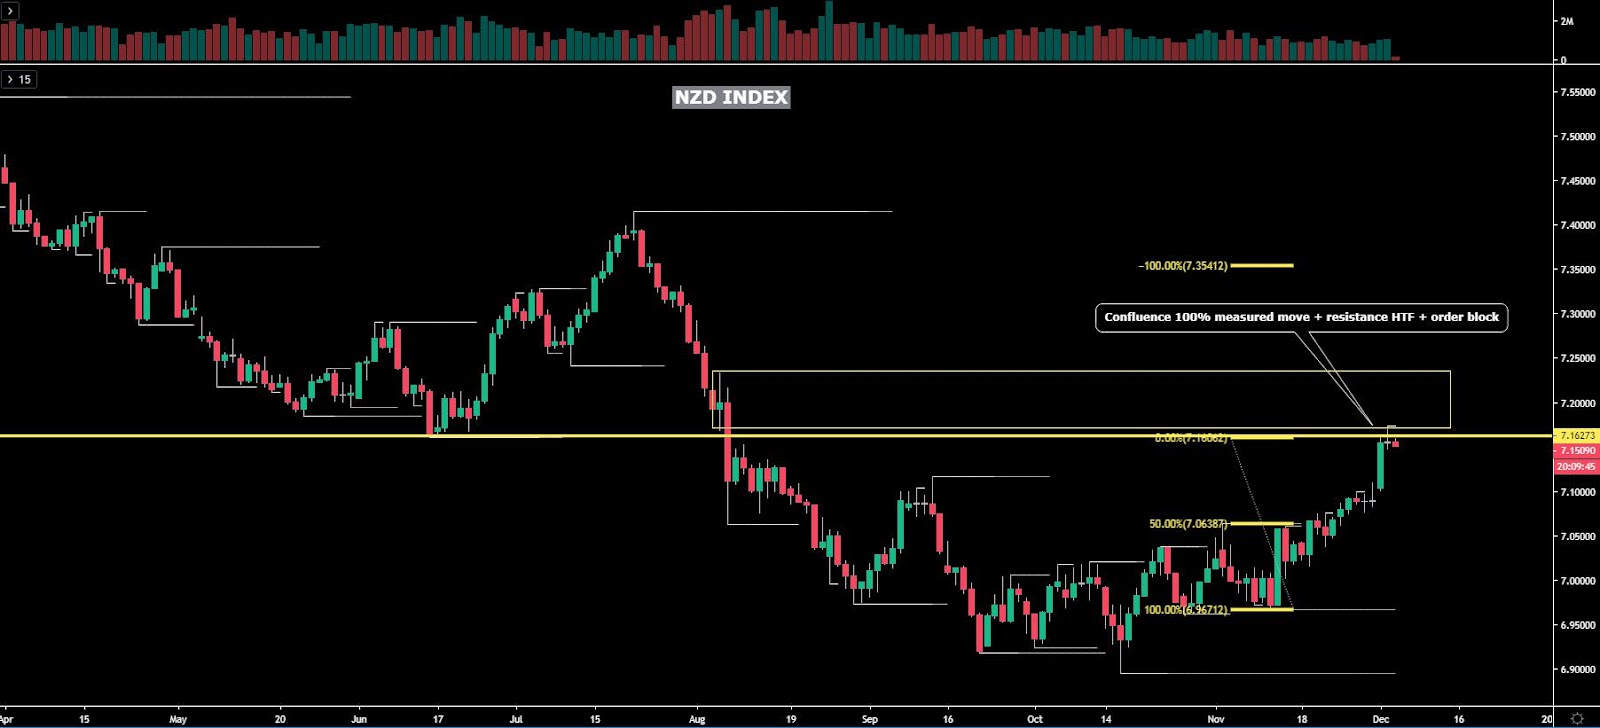
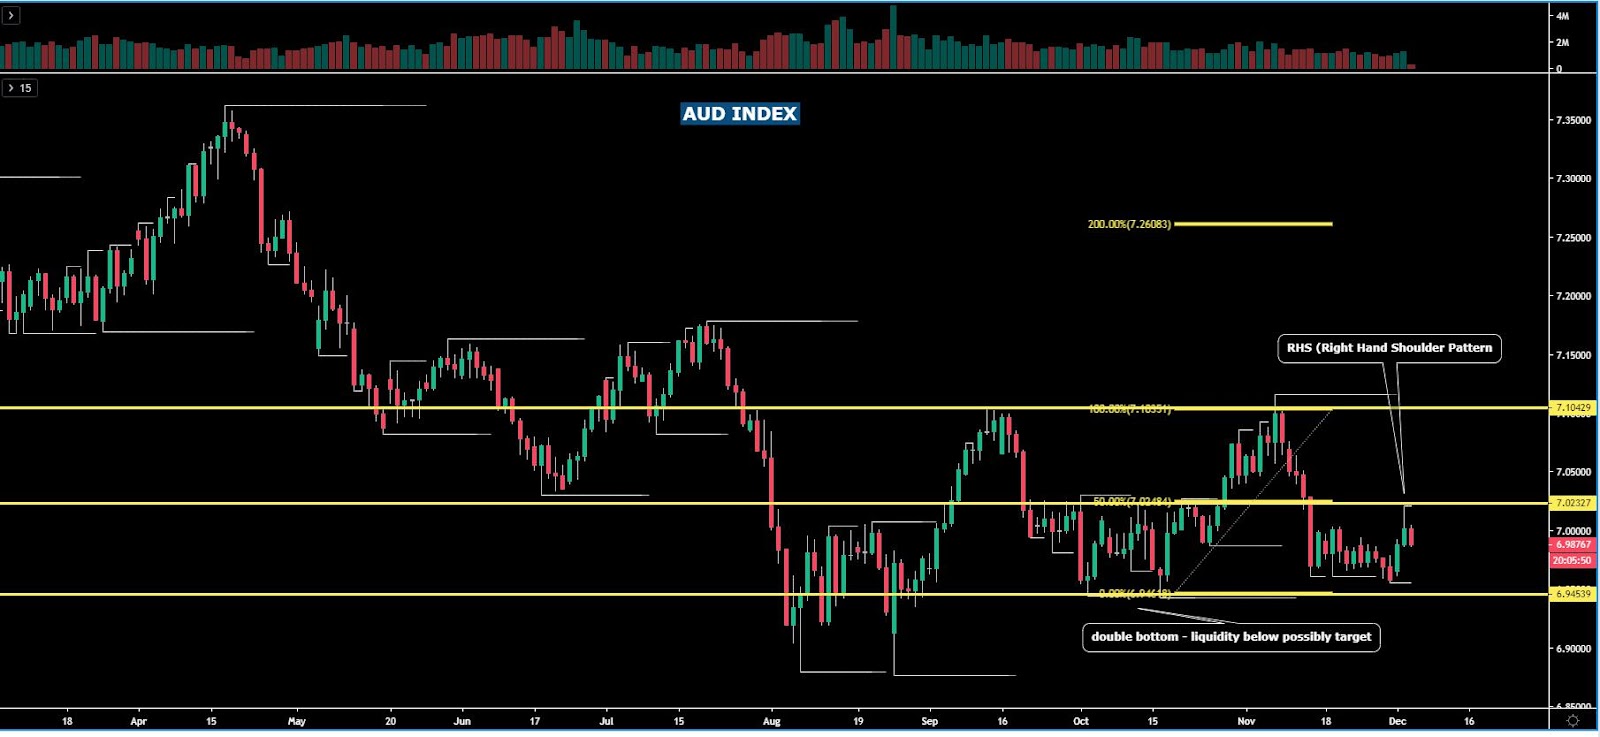
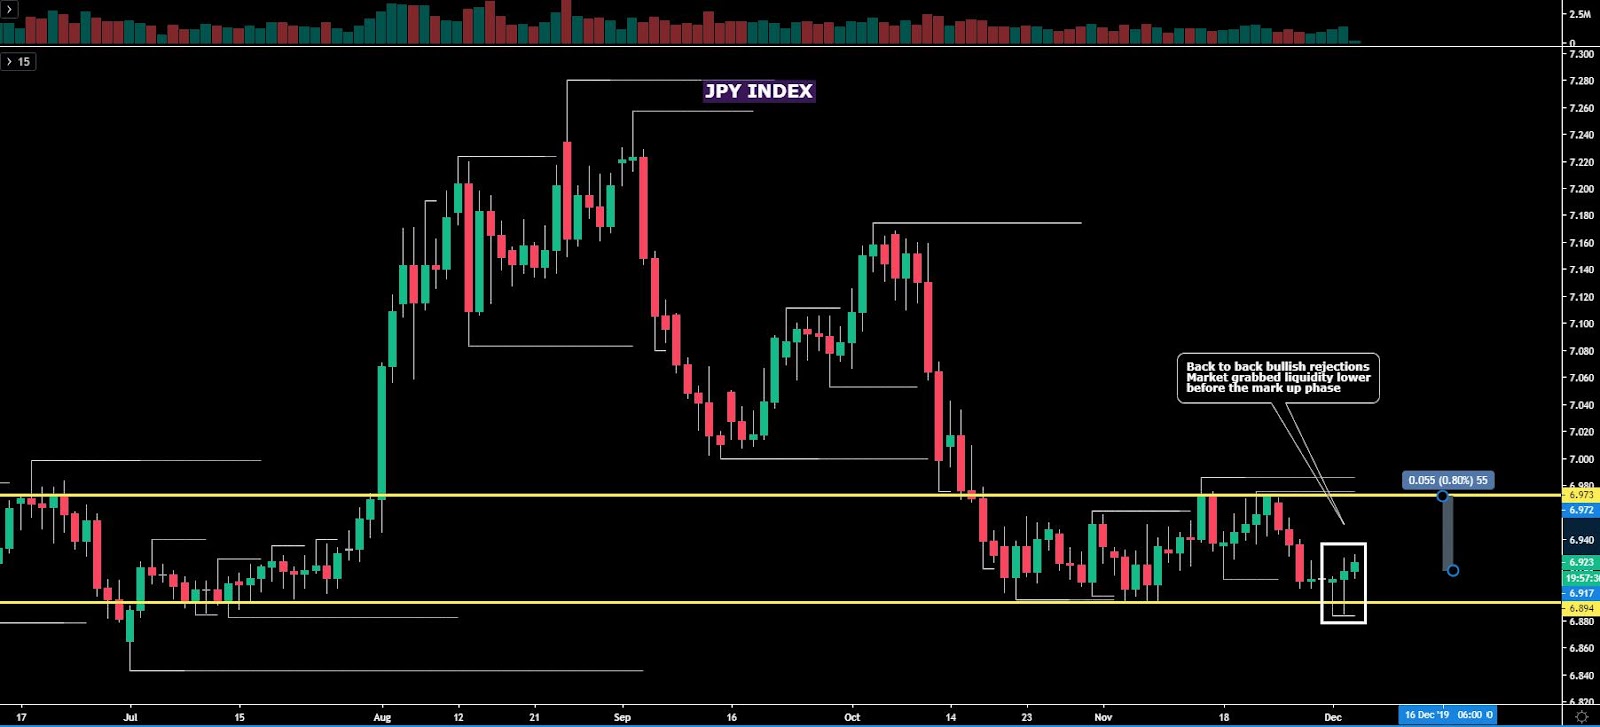
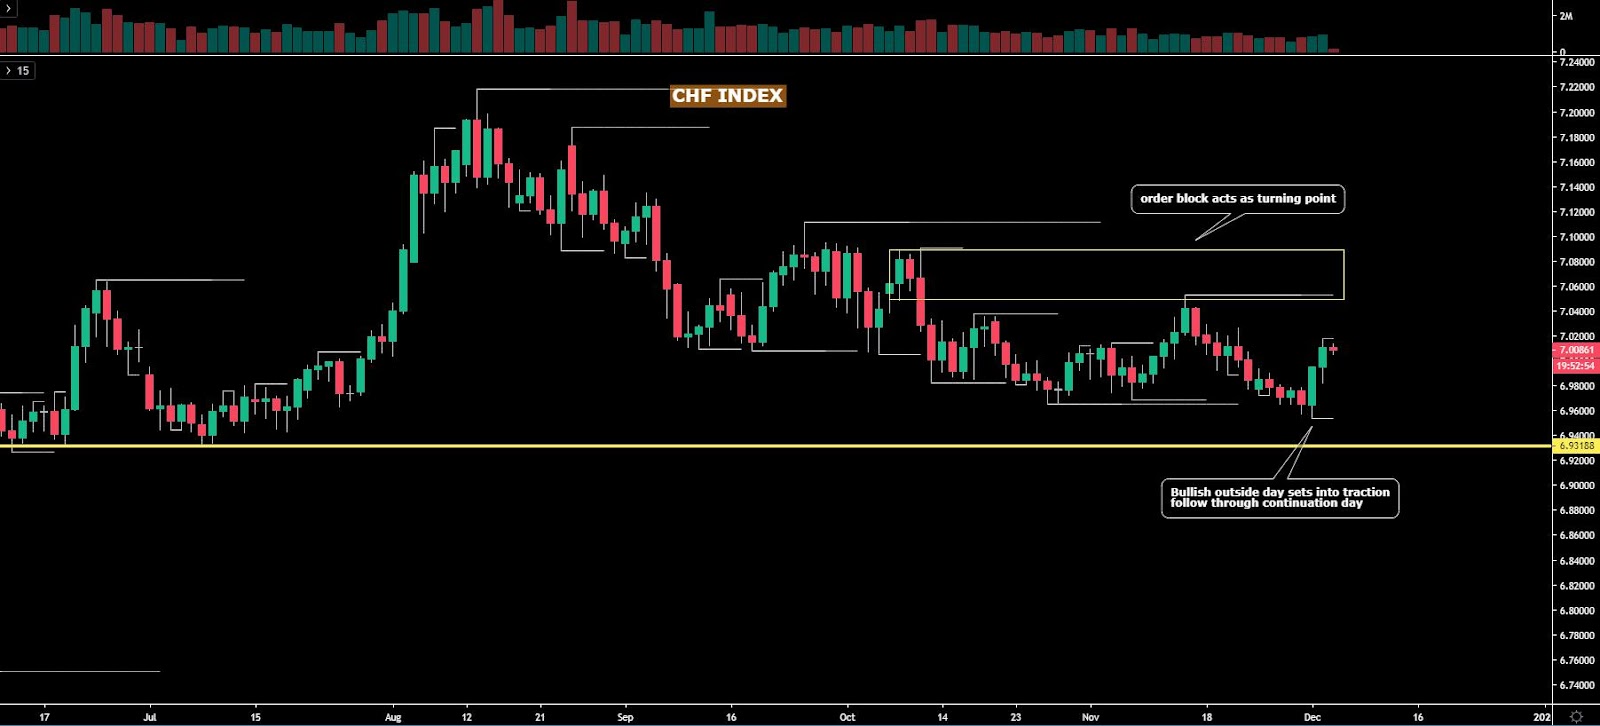
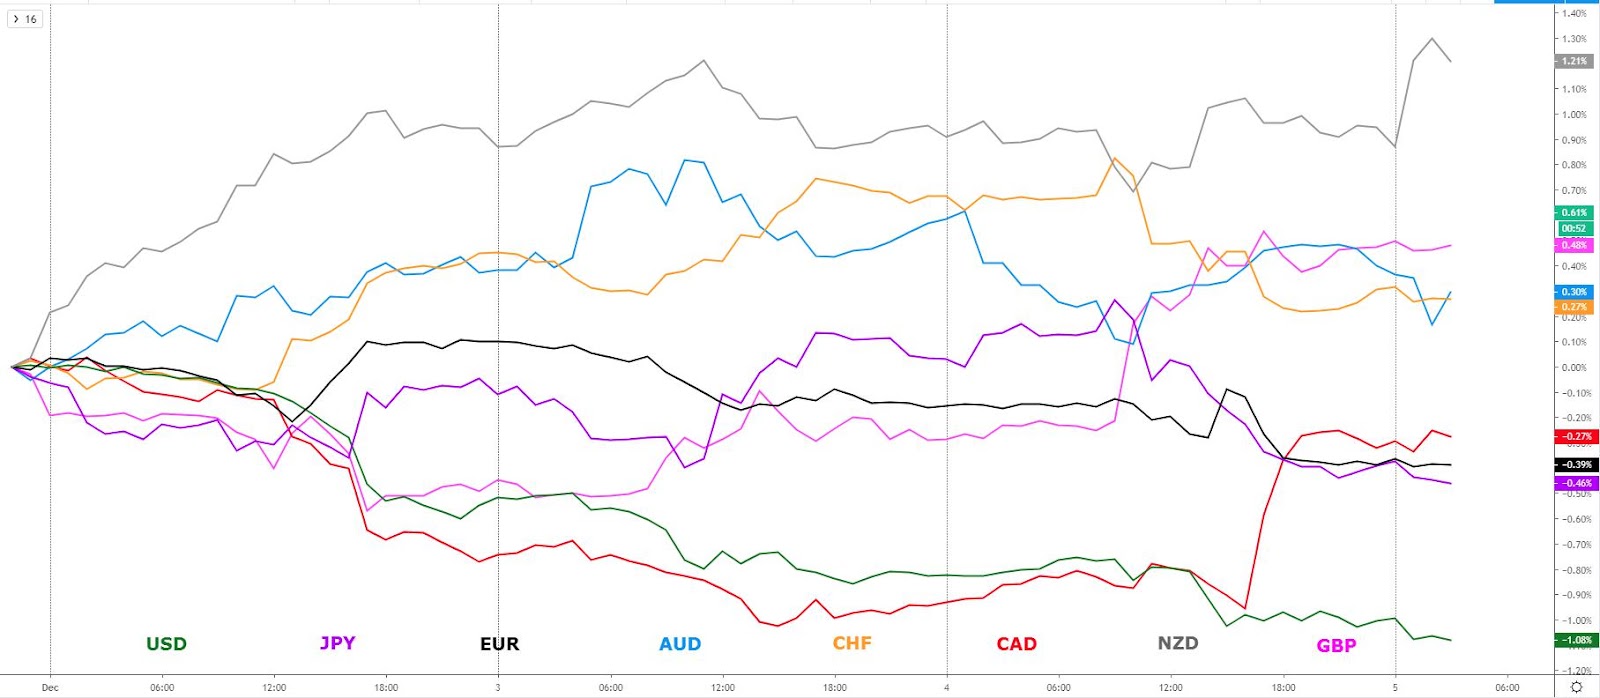
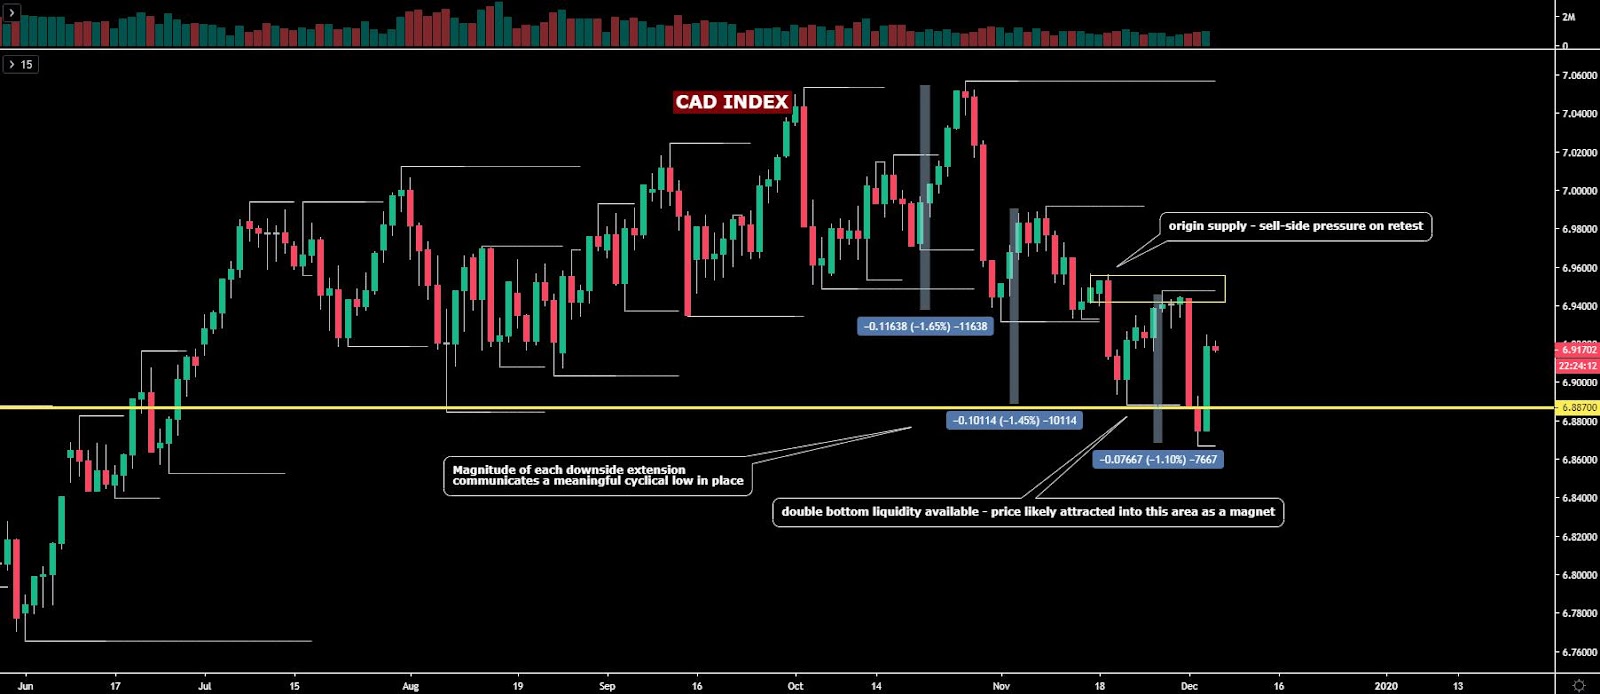
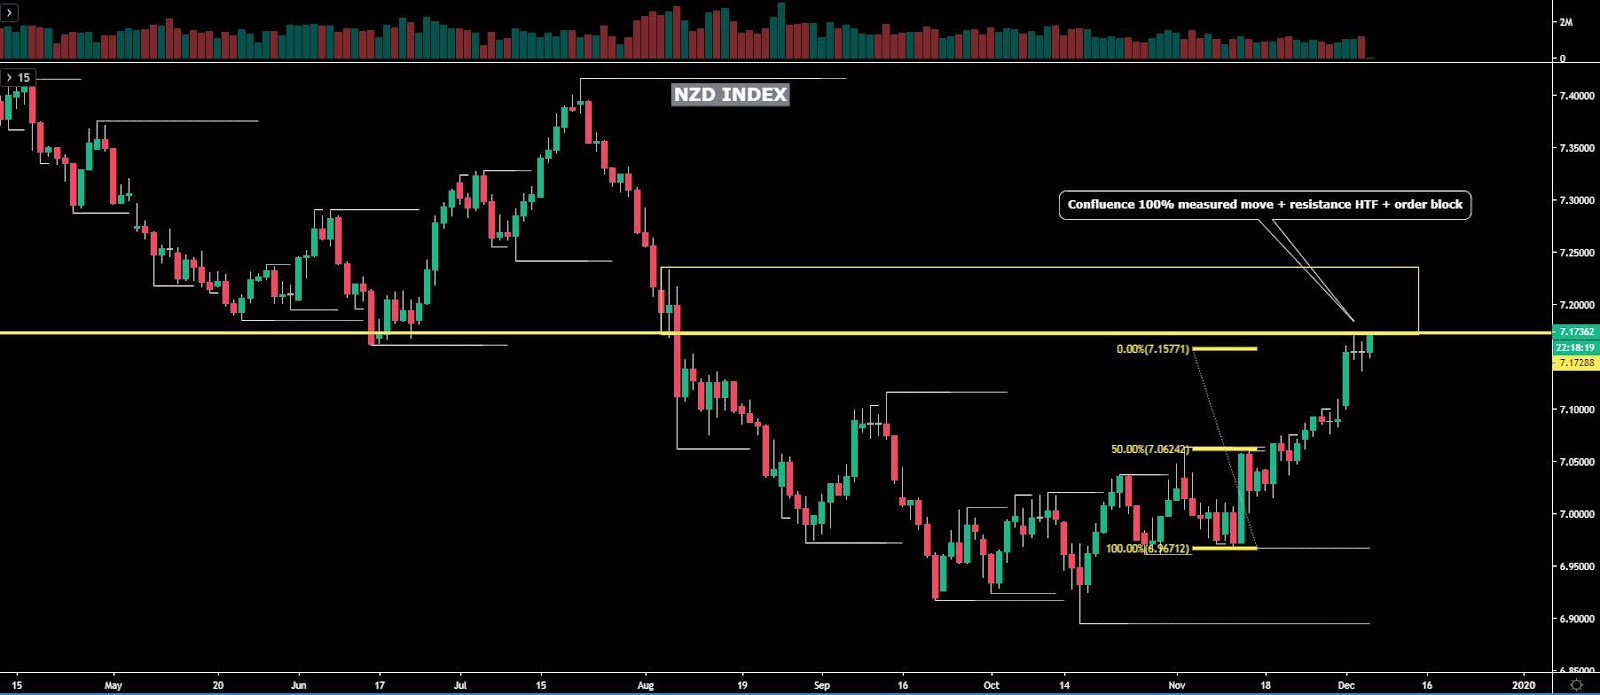
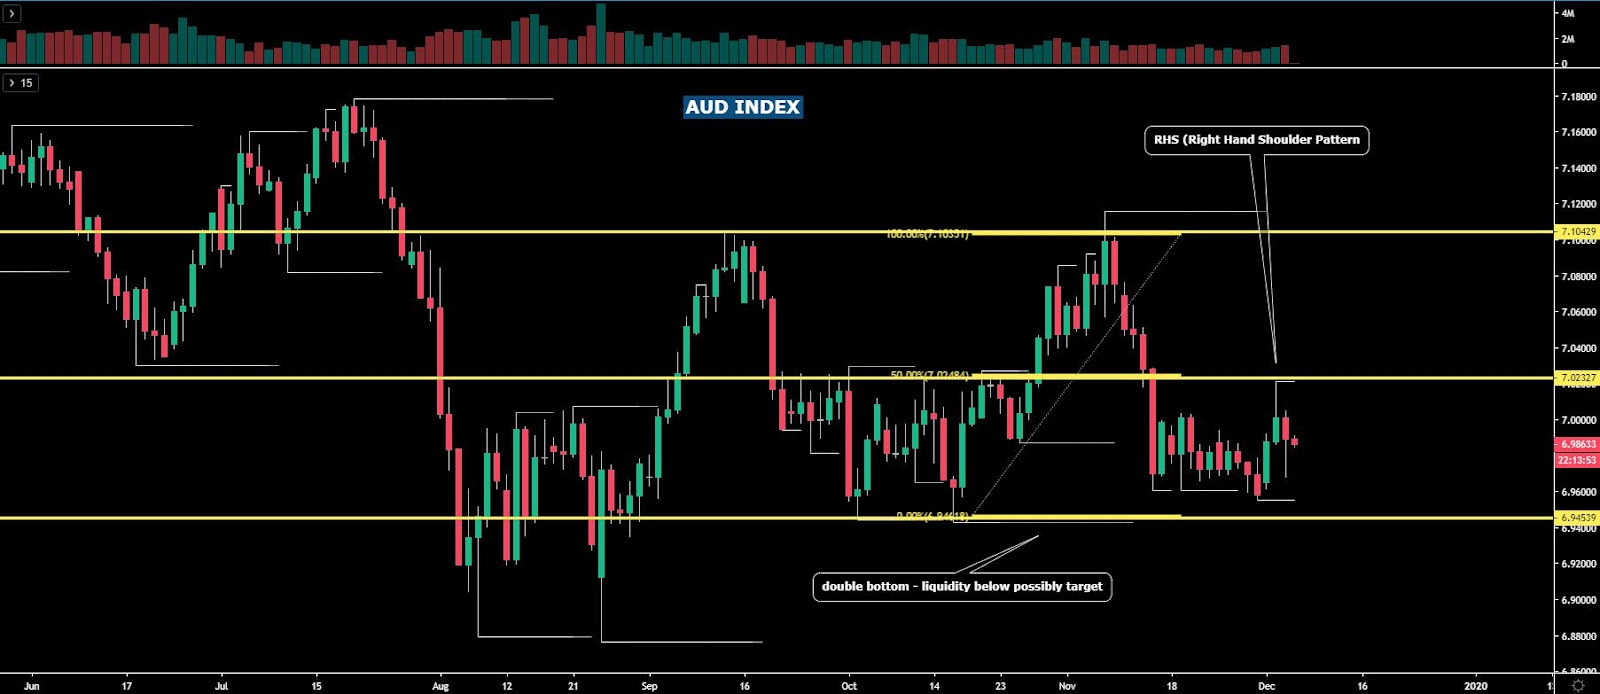
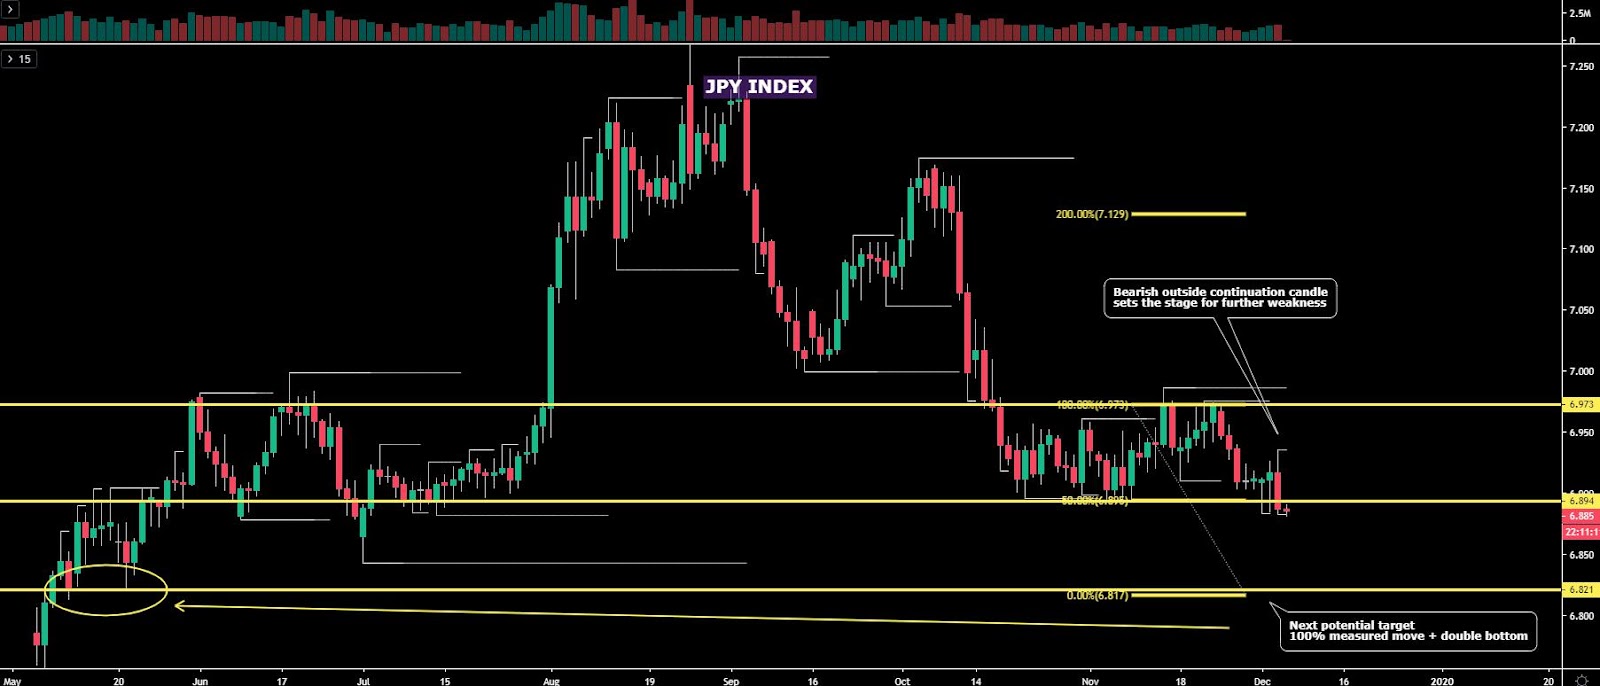
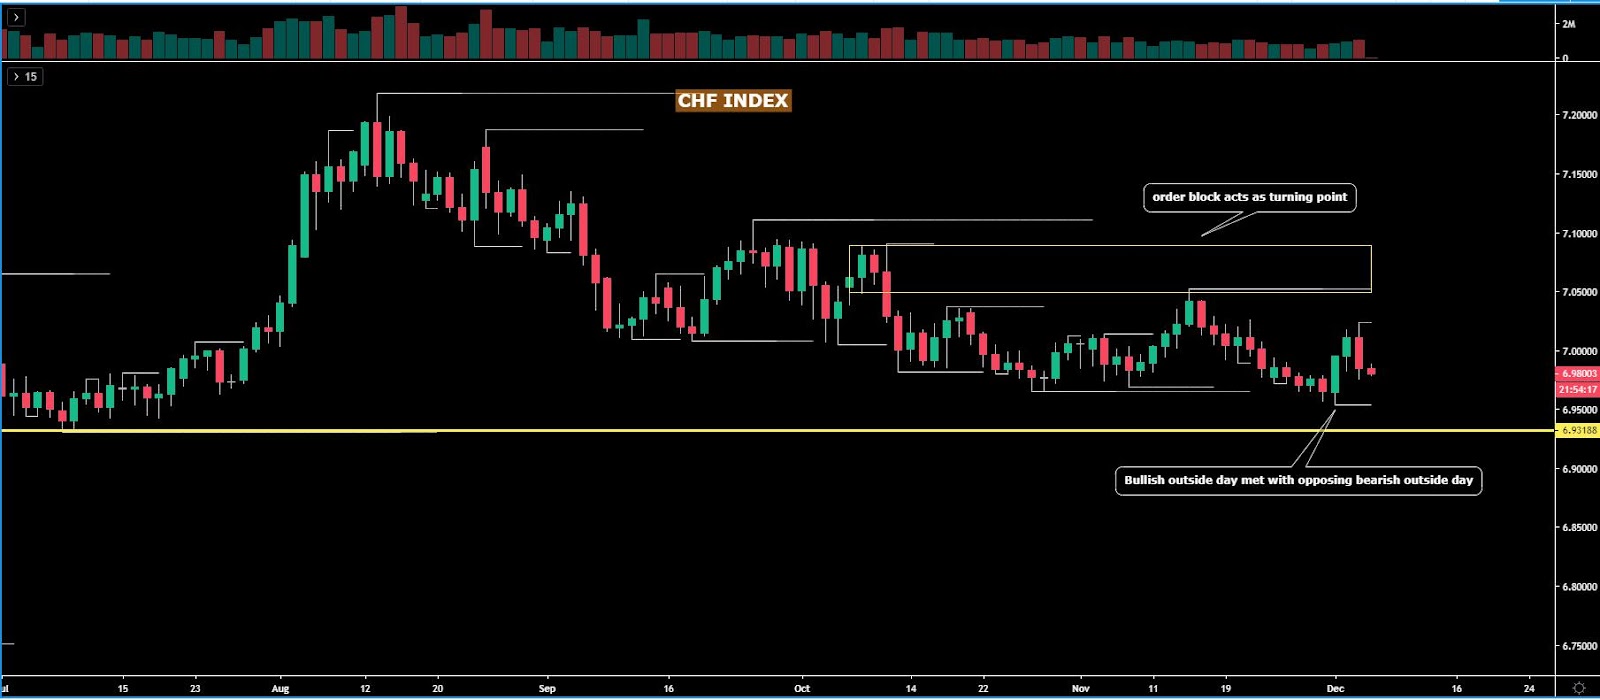
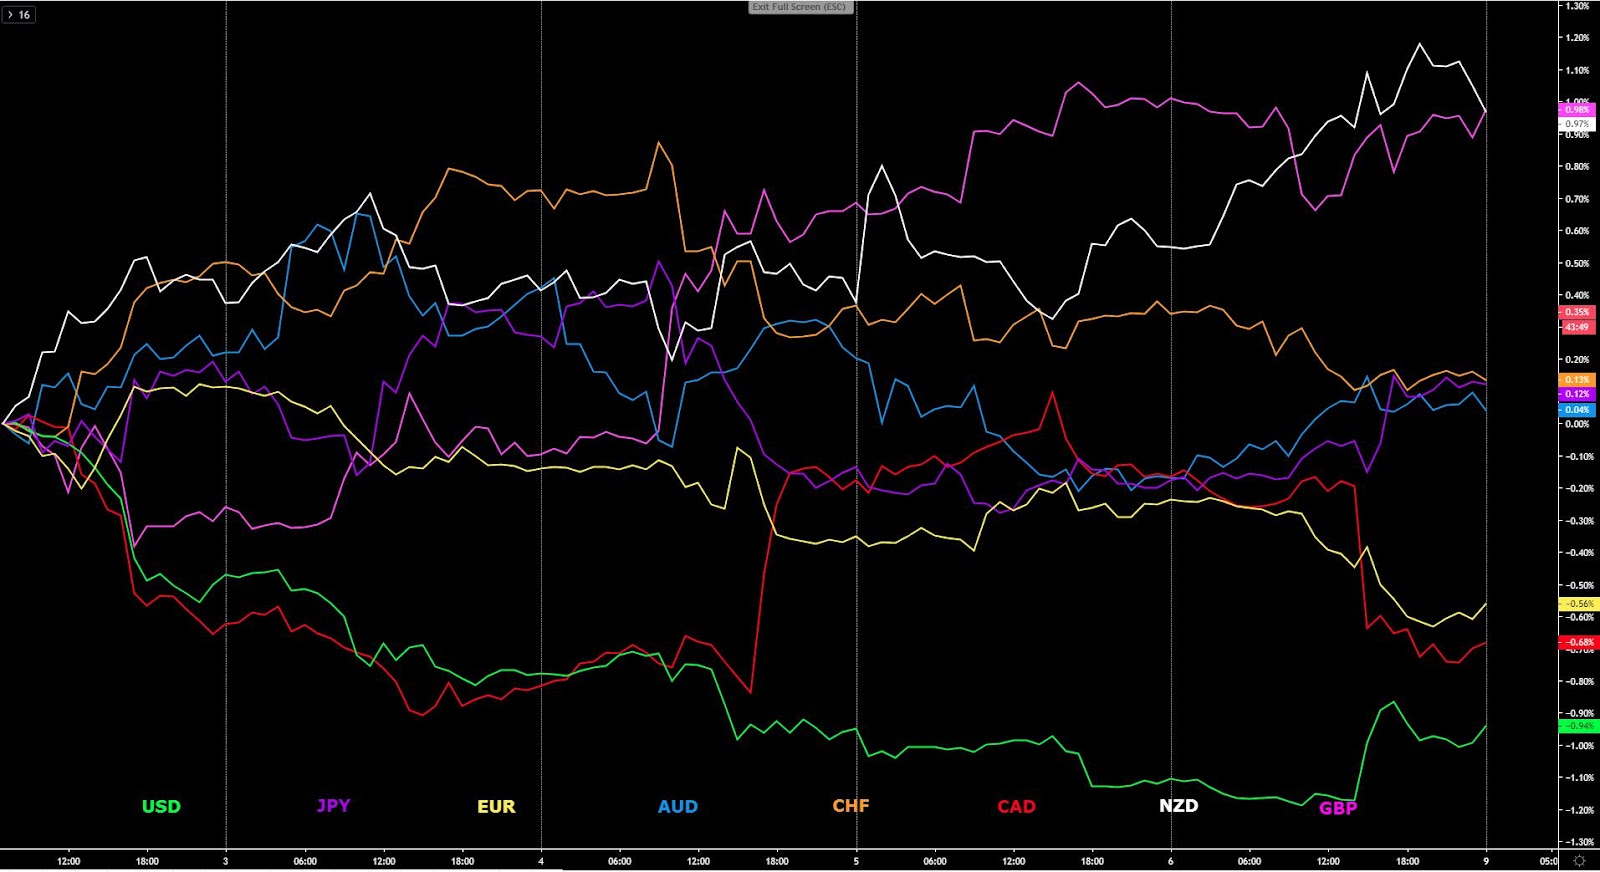
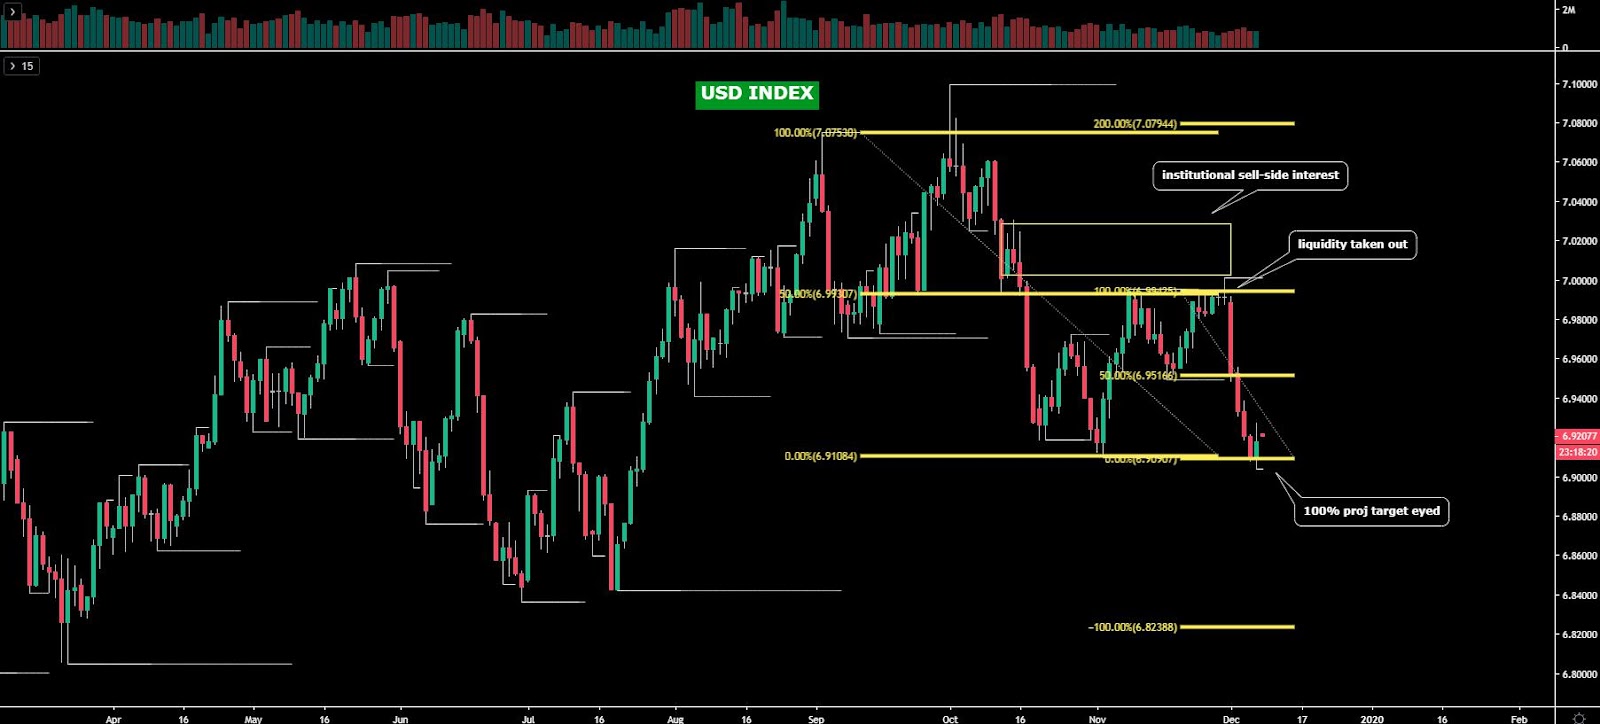
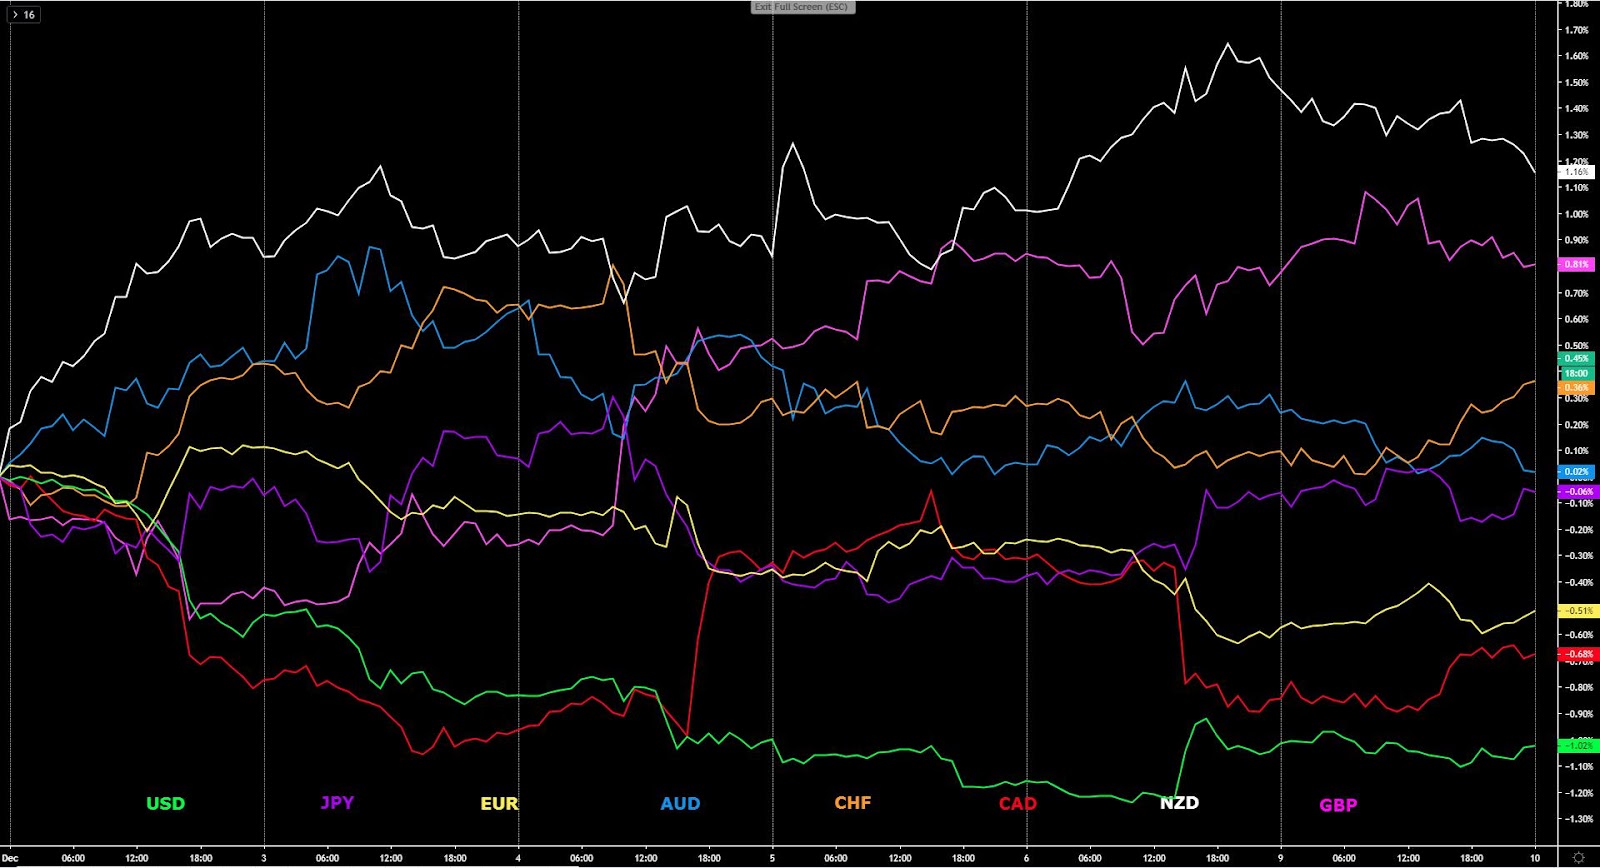
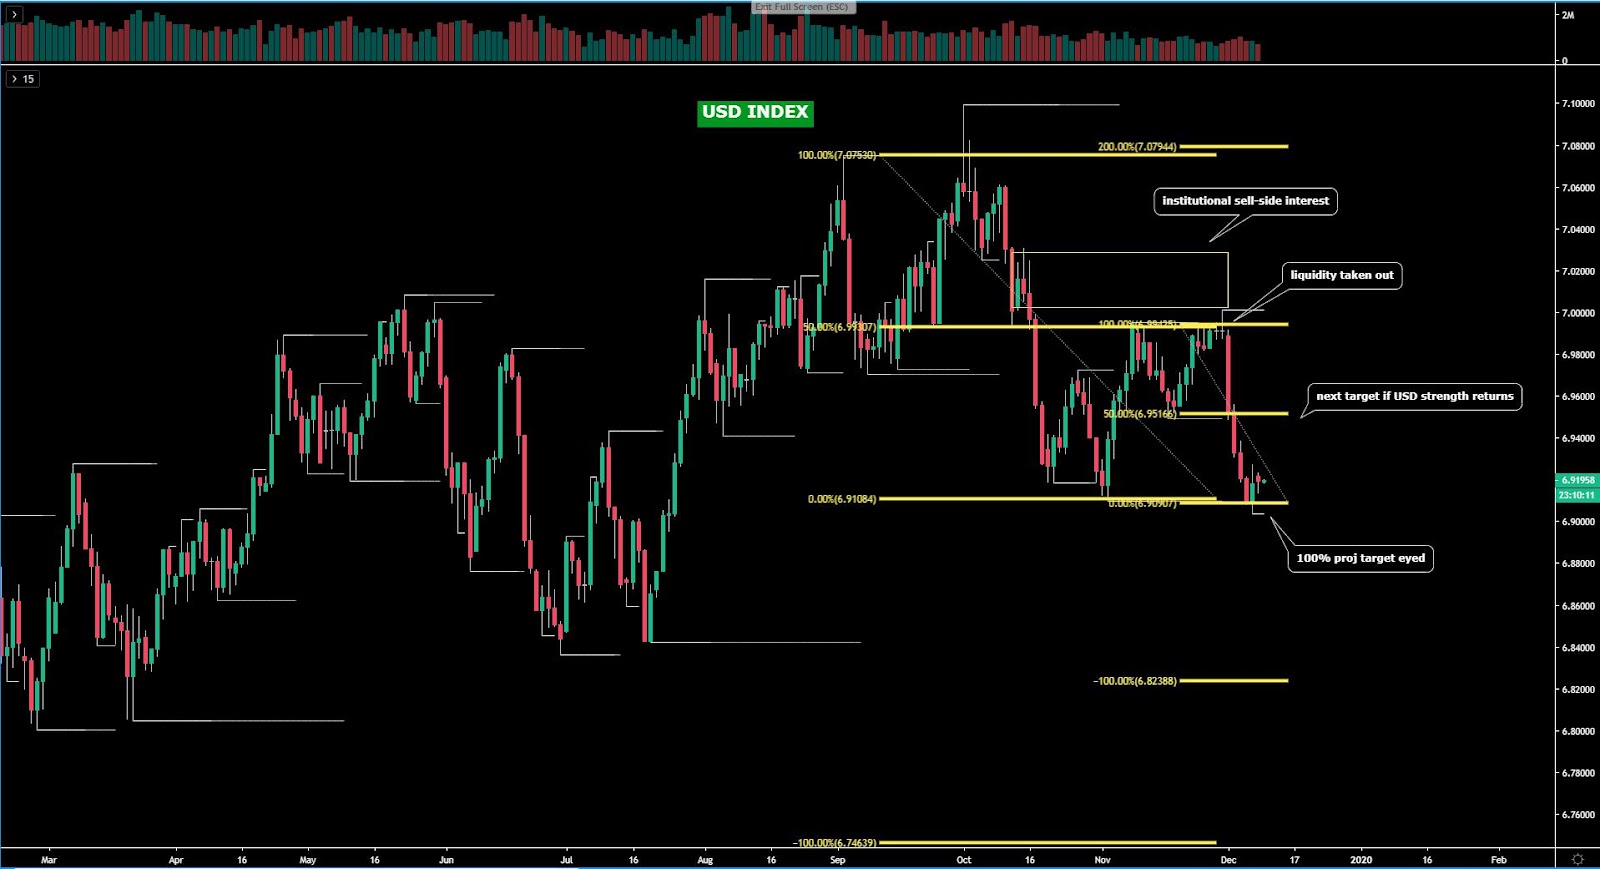
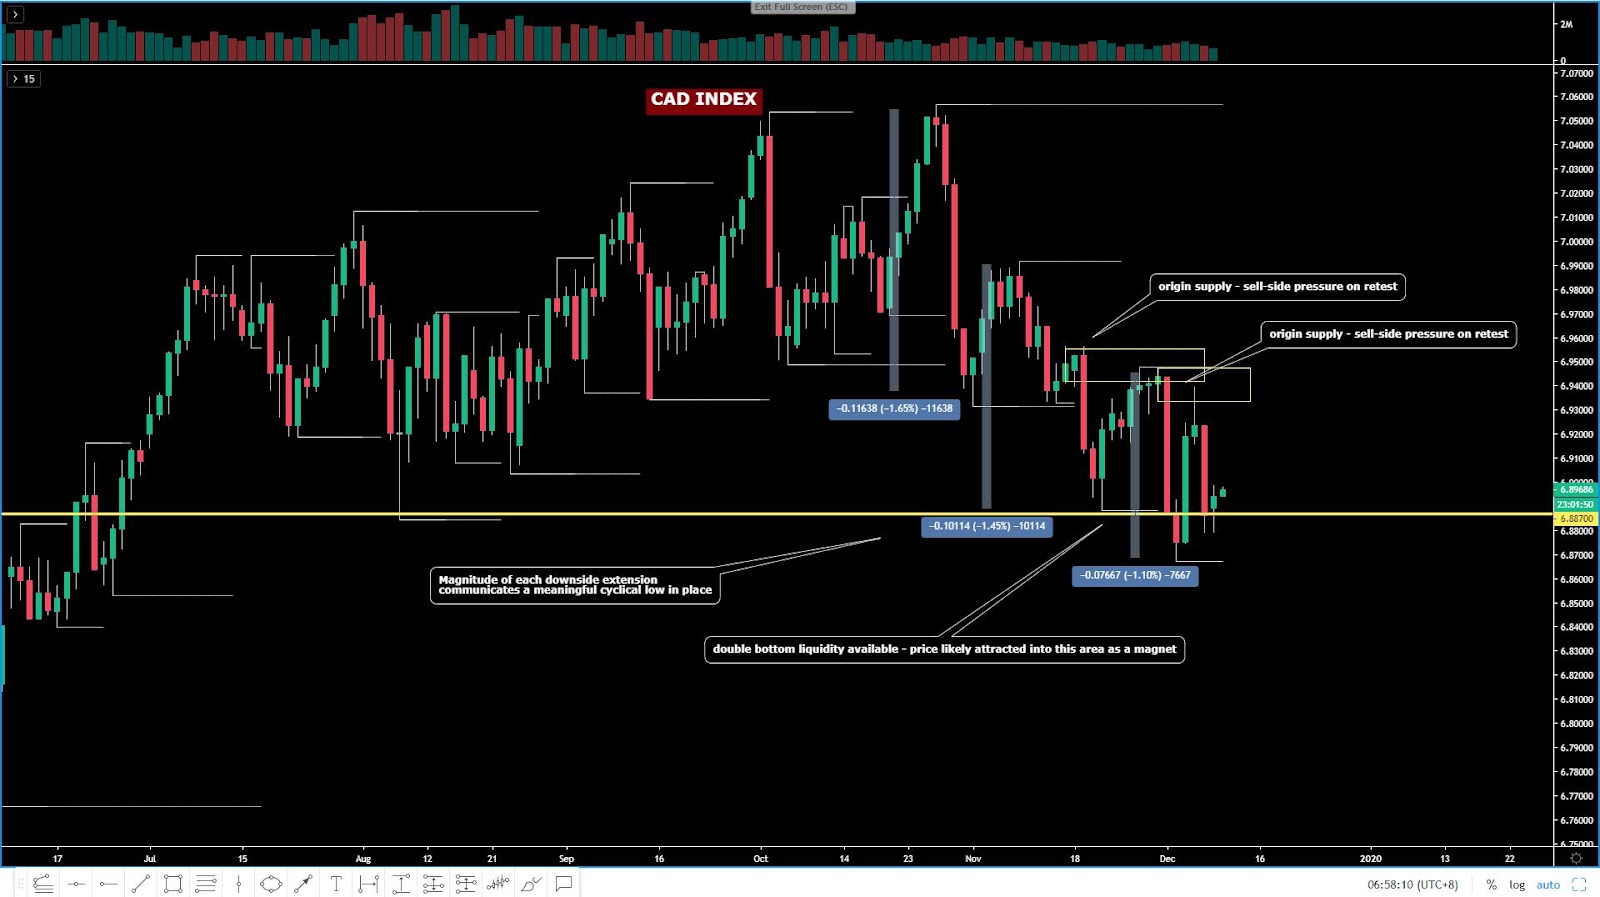
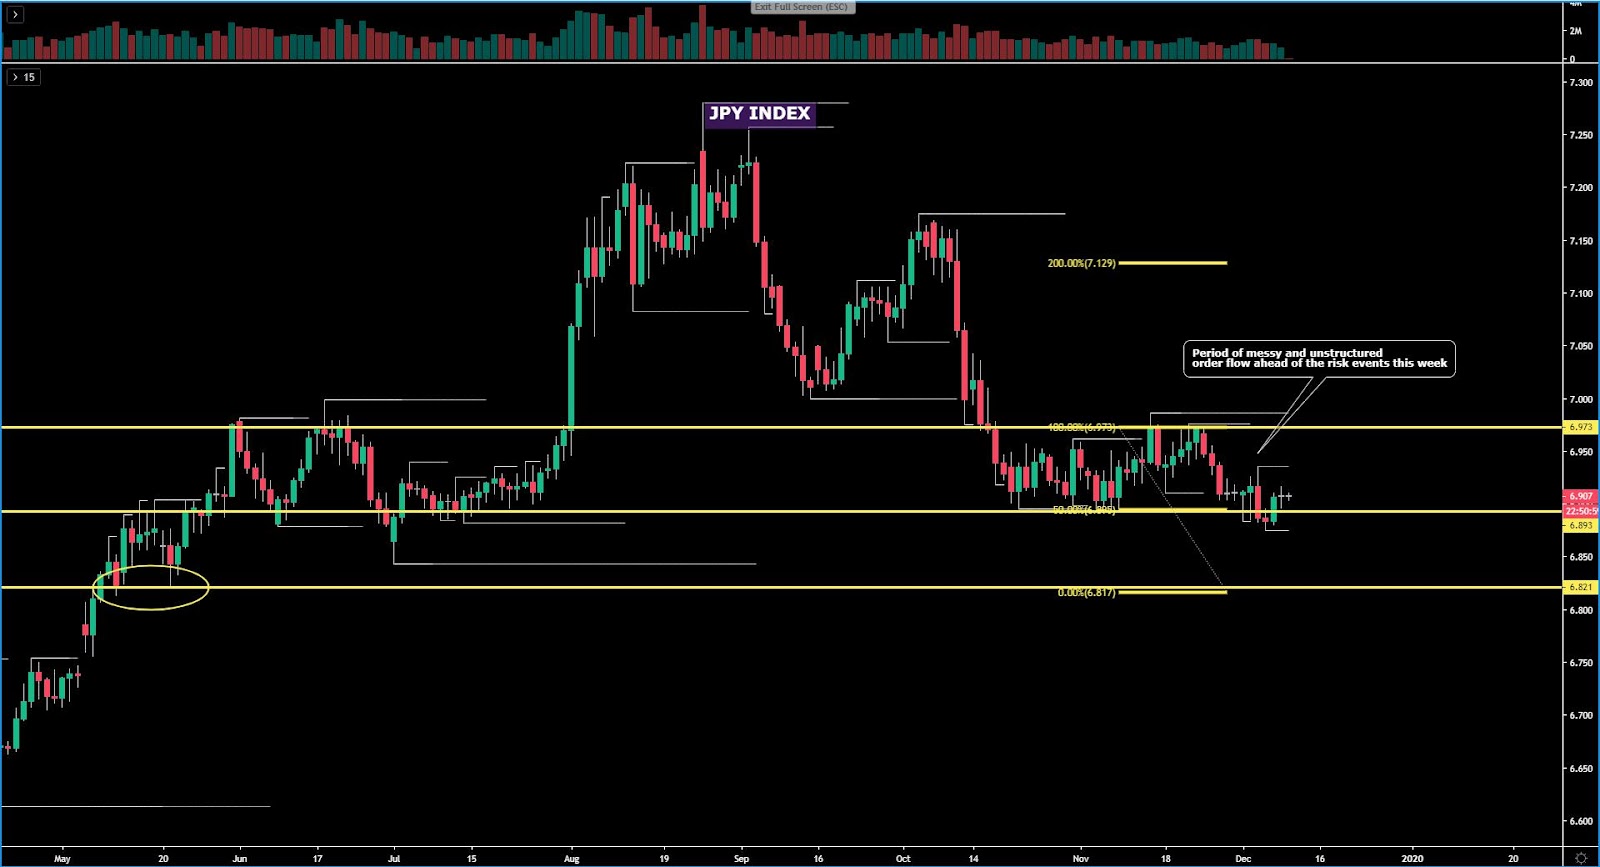
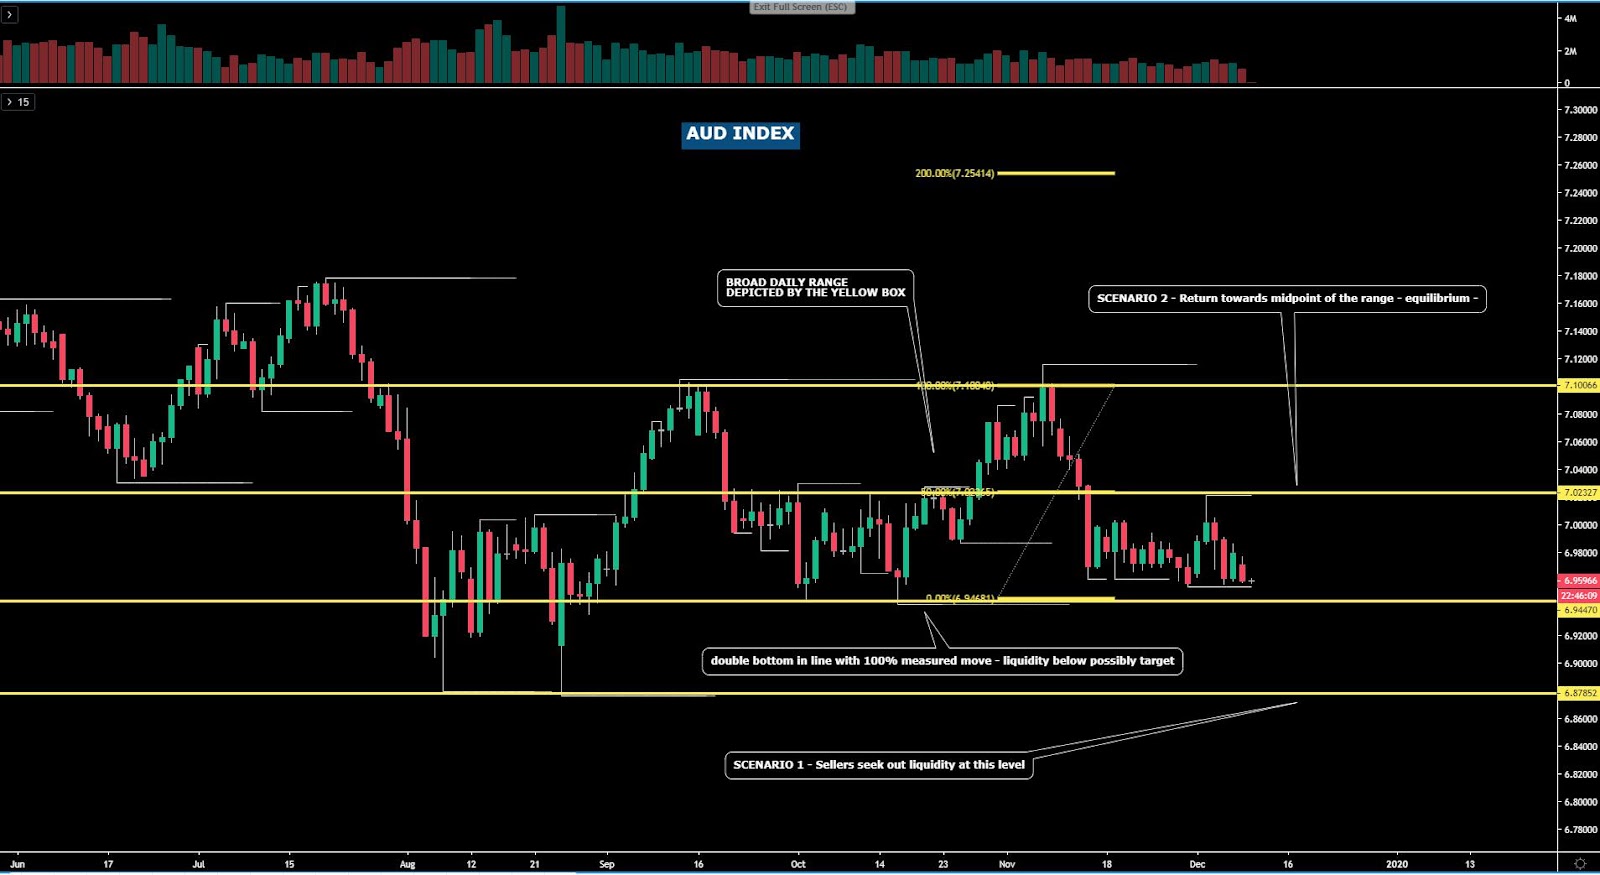
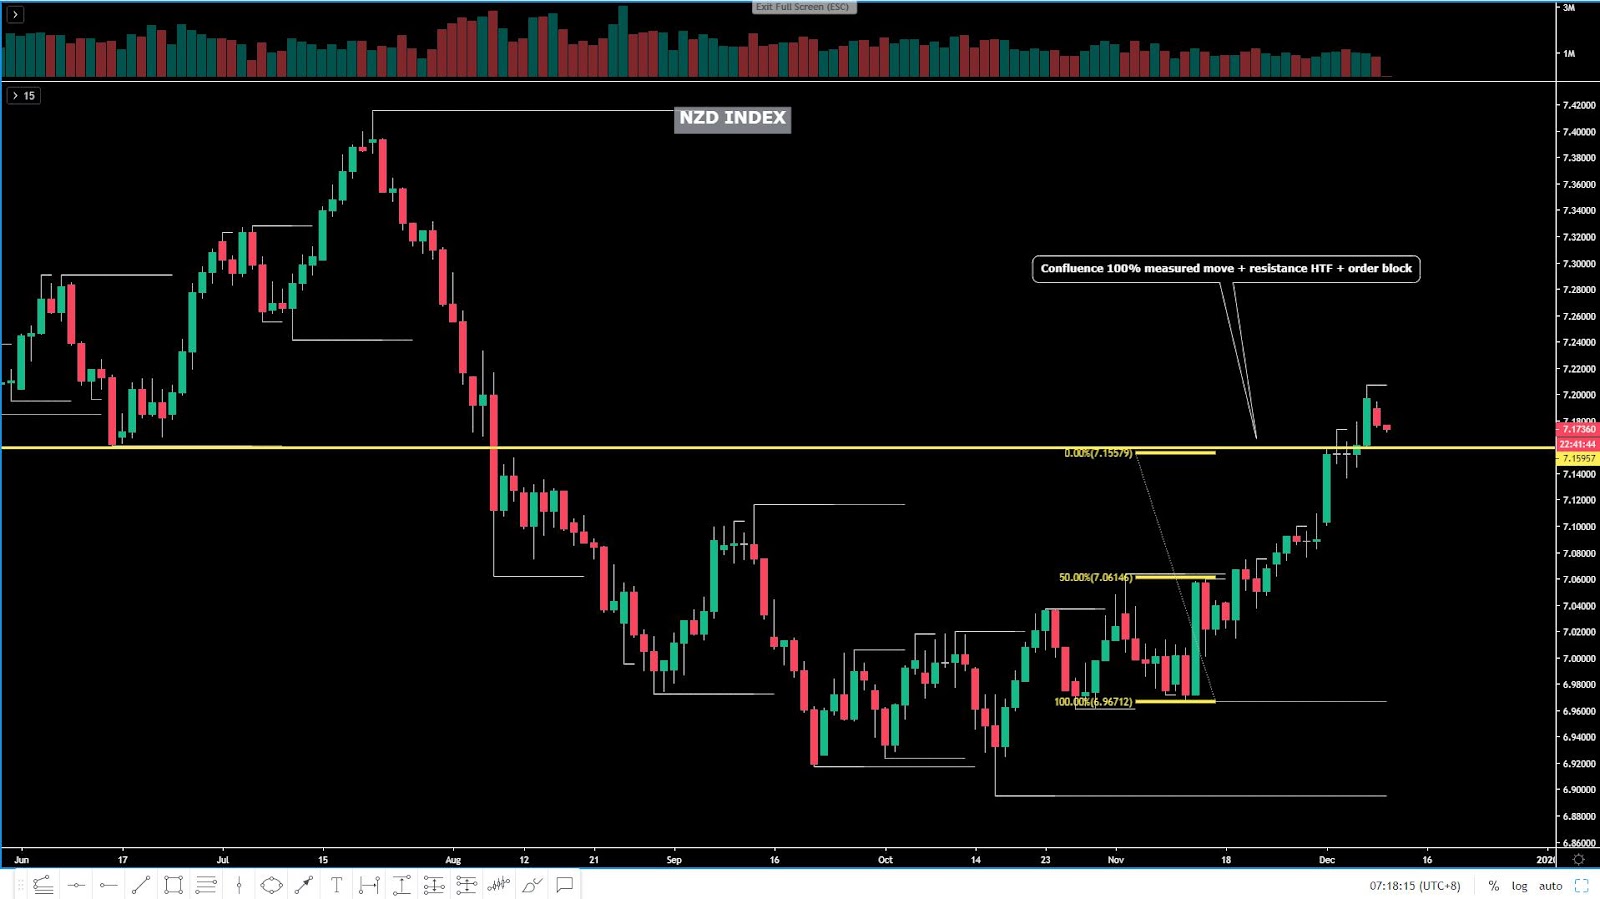
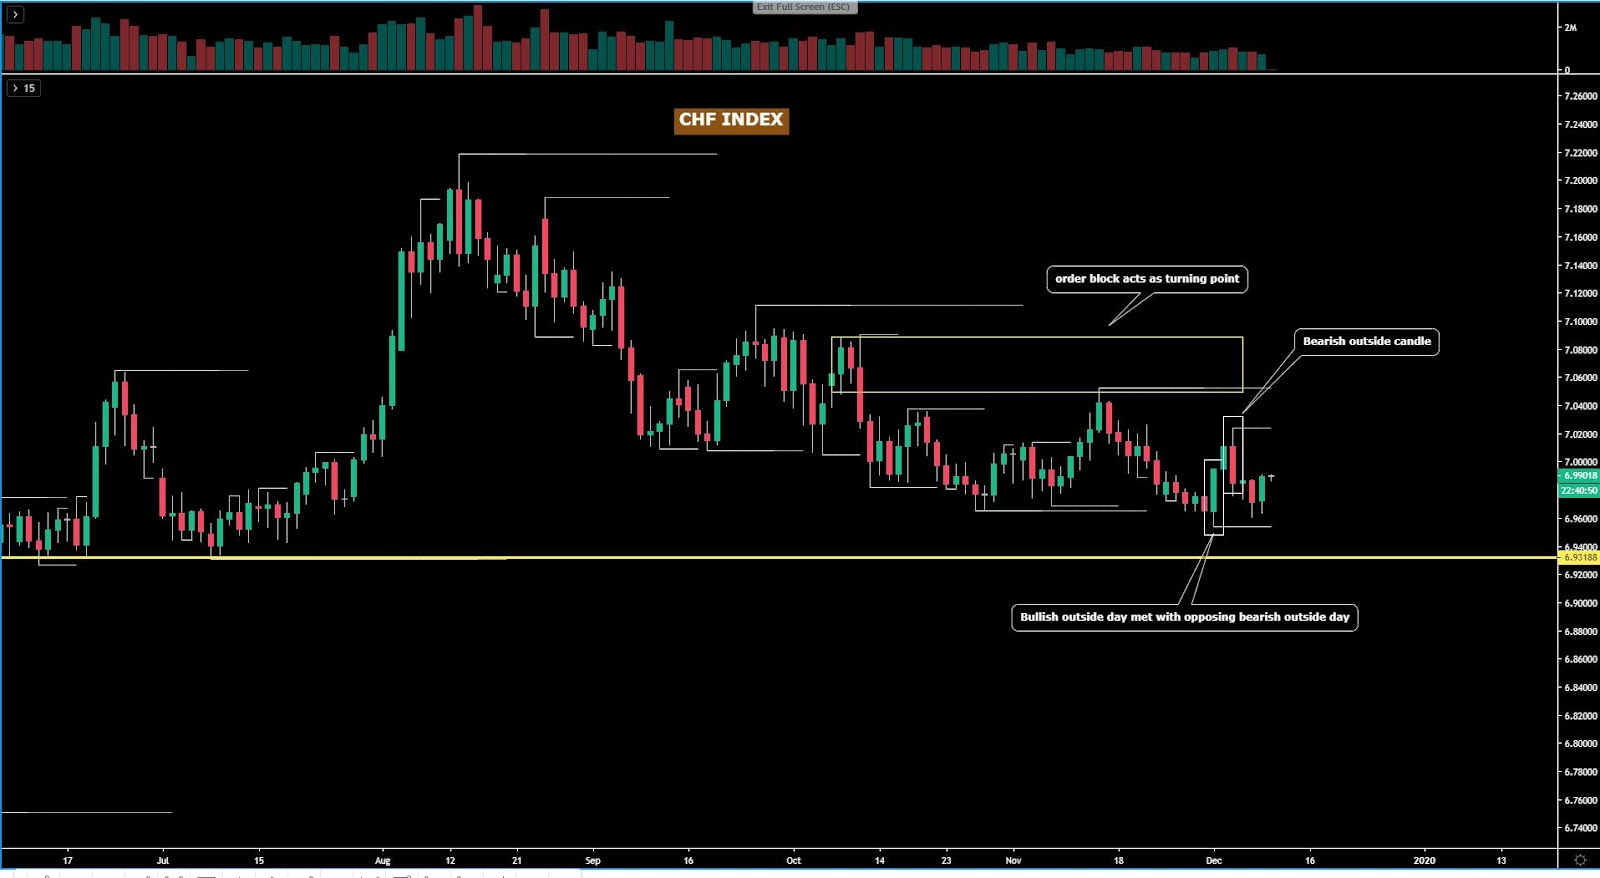
The Canadian Dollar was hands down the top performer as BoC Governor Poloz threw cold water to the prospects of a rate cut in December. The abrupt rise in the CAD came in tandem with an appreciation in the US Dollar index, which made new highs for the week as the market still sees the US-China trade saga as a glass half-full. The Euro kept treading water, encapsulated in a tiny range on Thursday, with a very timid response to the ECB minutes, which called for unity after the recent division in policy views. The Pound was unable to sustain the solid gains printed through the European session, suffering a significant slide as the North American session came to an end. Meanwhile, the Oceanic currencies went through a mixed-bag at an index level amid the lack of fundamental drivers other than the US-China trade headlines, which helped to cap the downside in the Aussie as the Yuan found buyers on dips. The renewed optimism plays into the view that the base case remains pricing for the US-China to eventually seal a deal. Lastly, the funding currencies (JPY, CHF) were both marginally weaker as the risk appetite recovered a tad even if we are far from blaring the trumpets on the trade front.
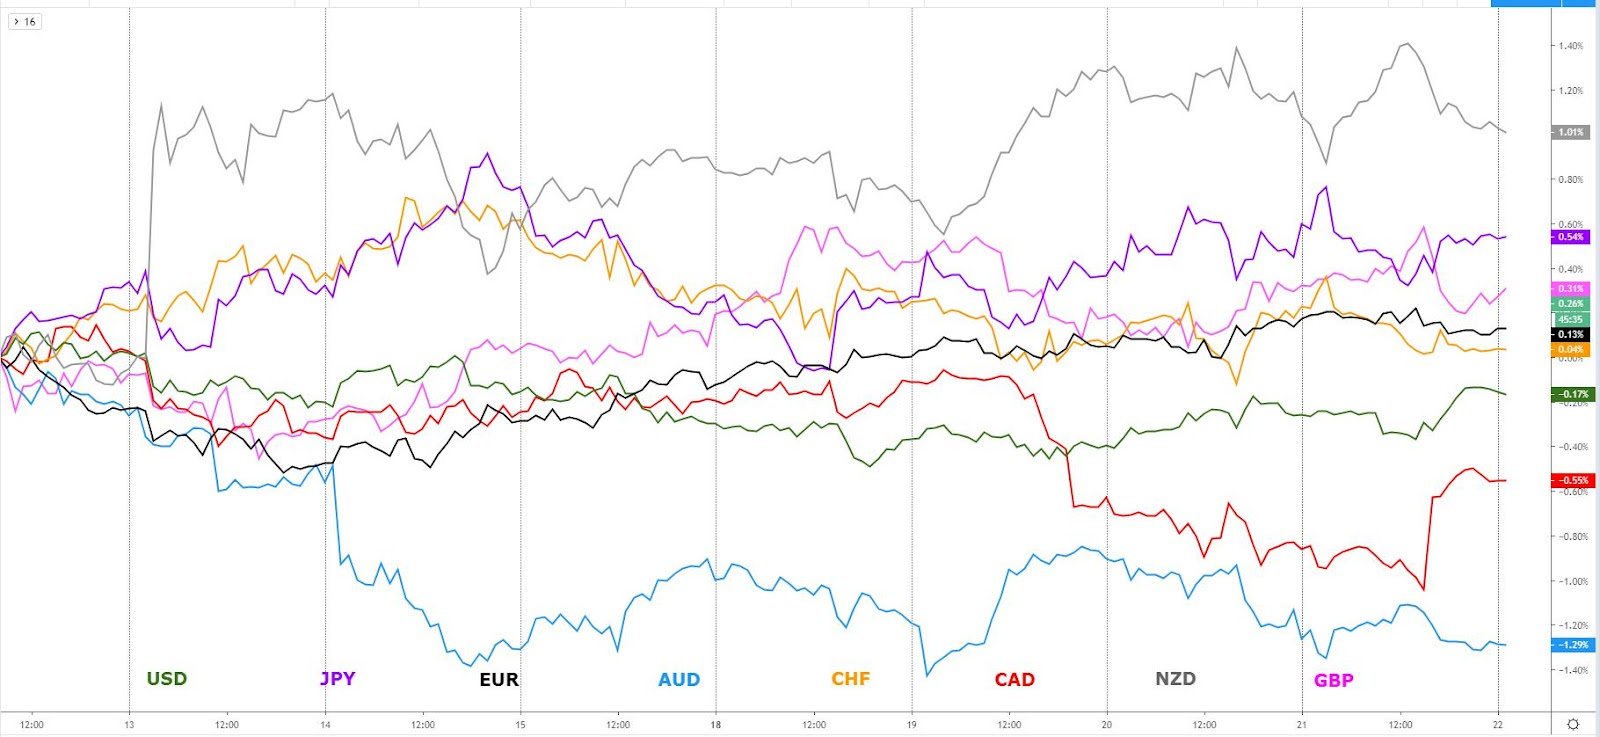
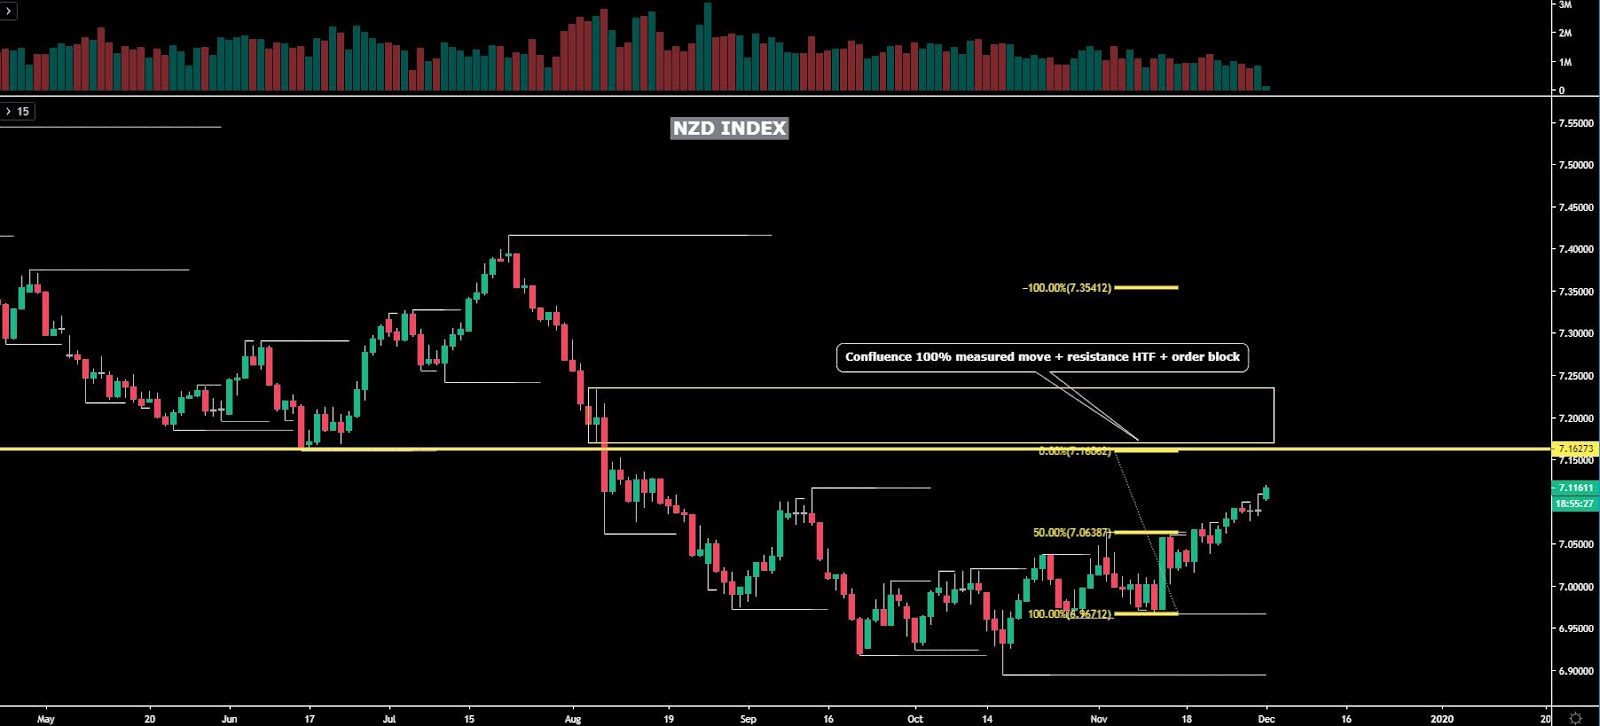
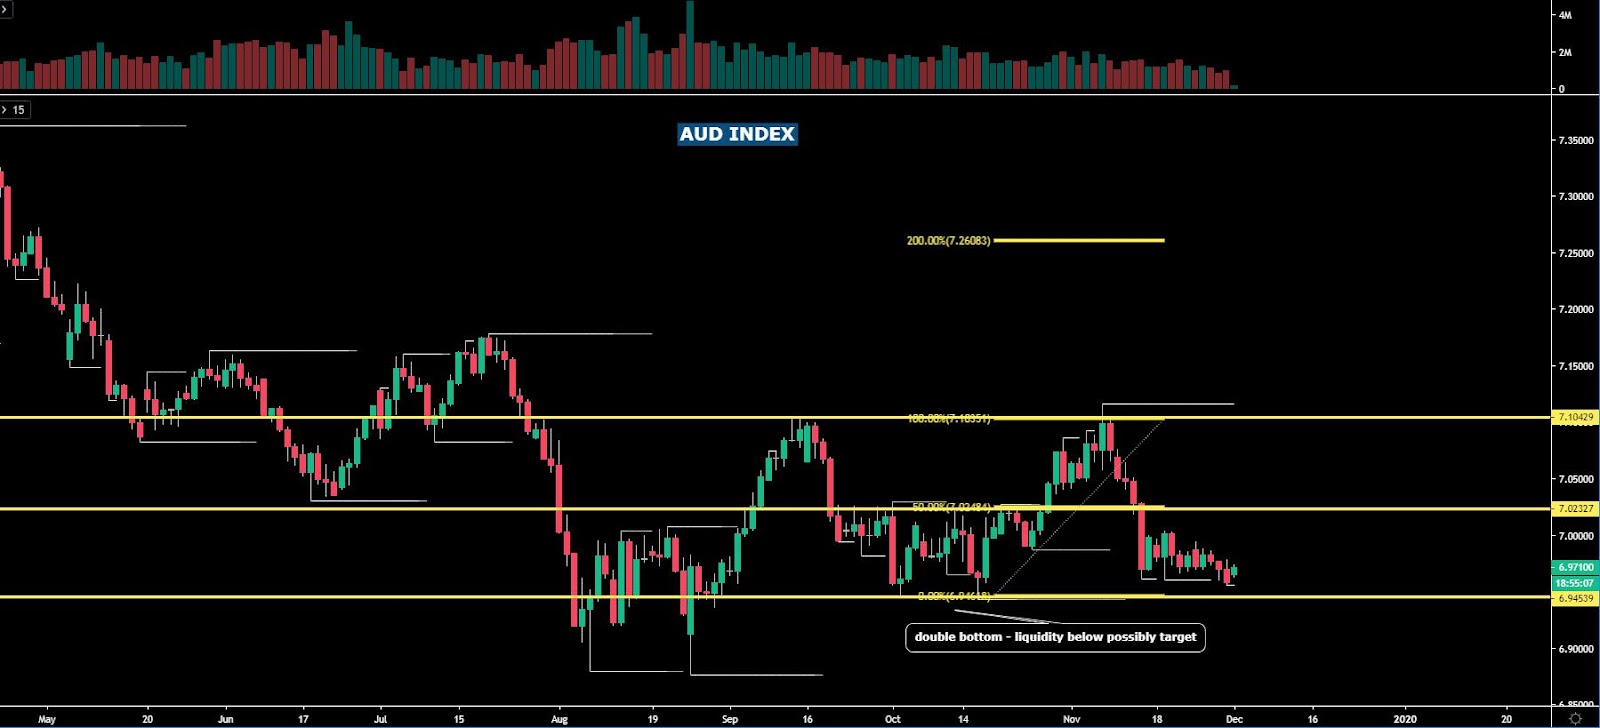
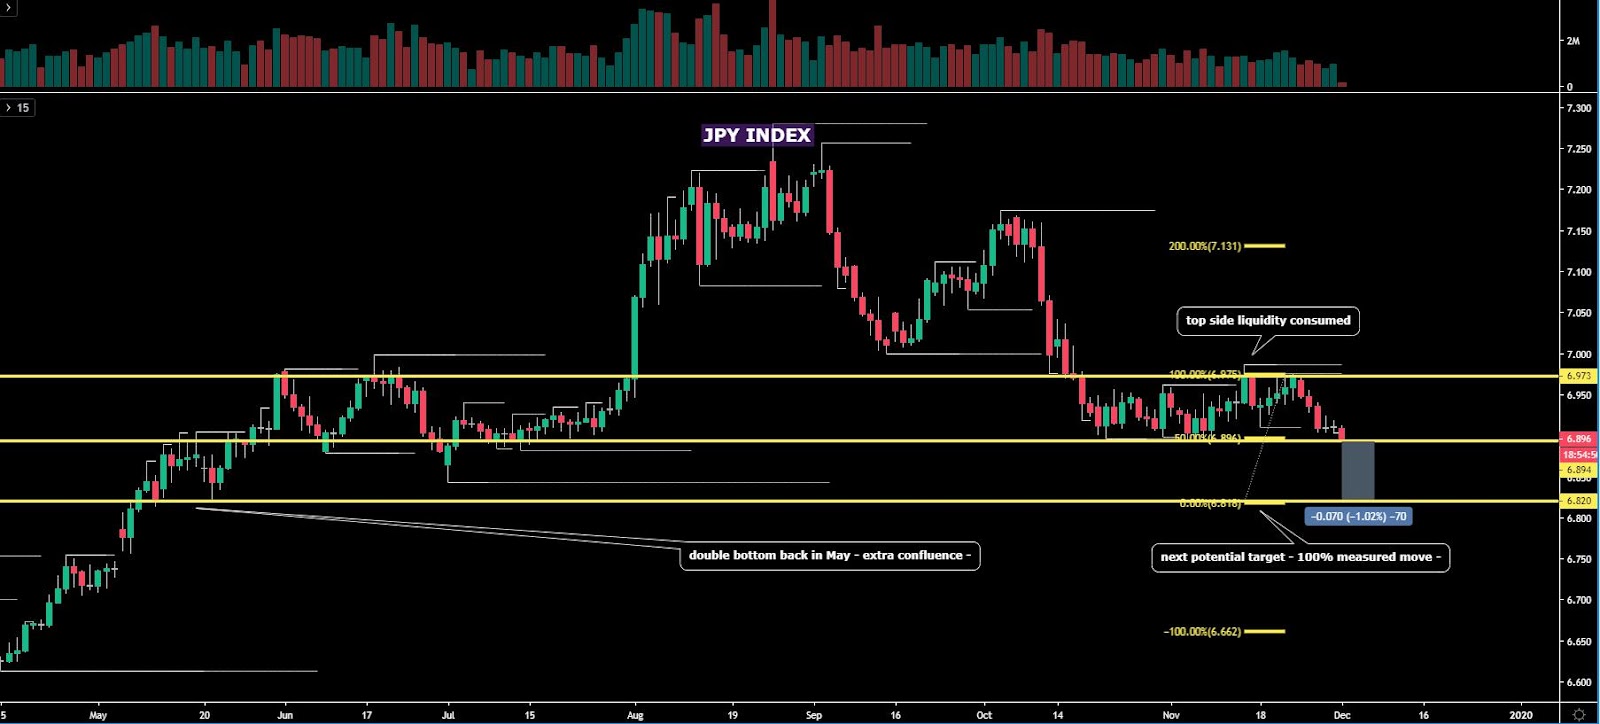
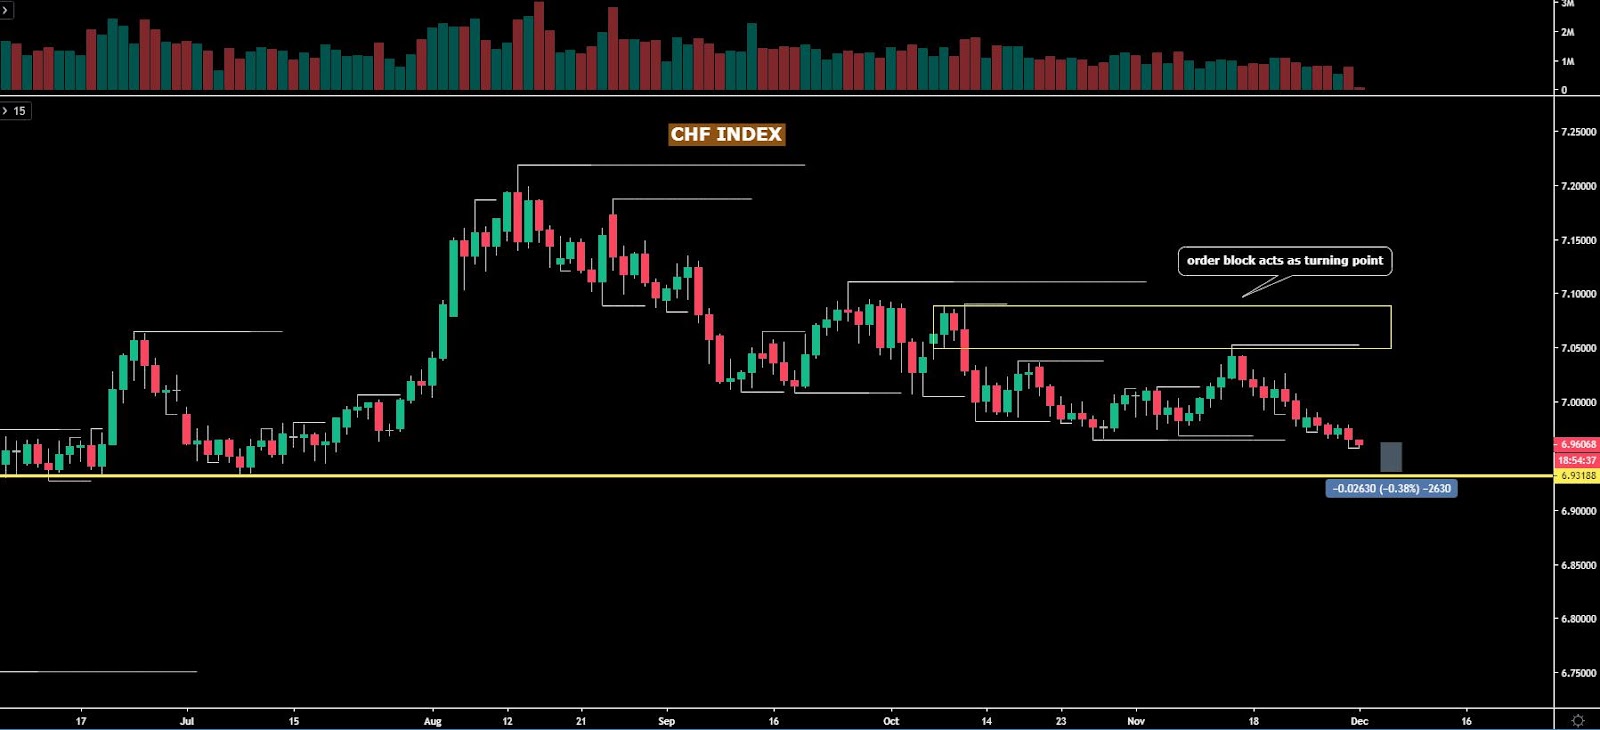
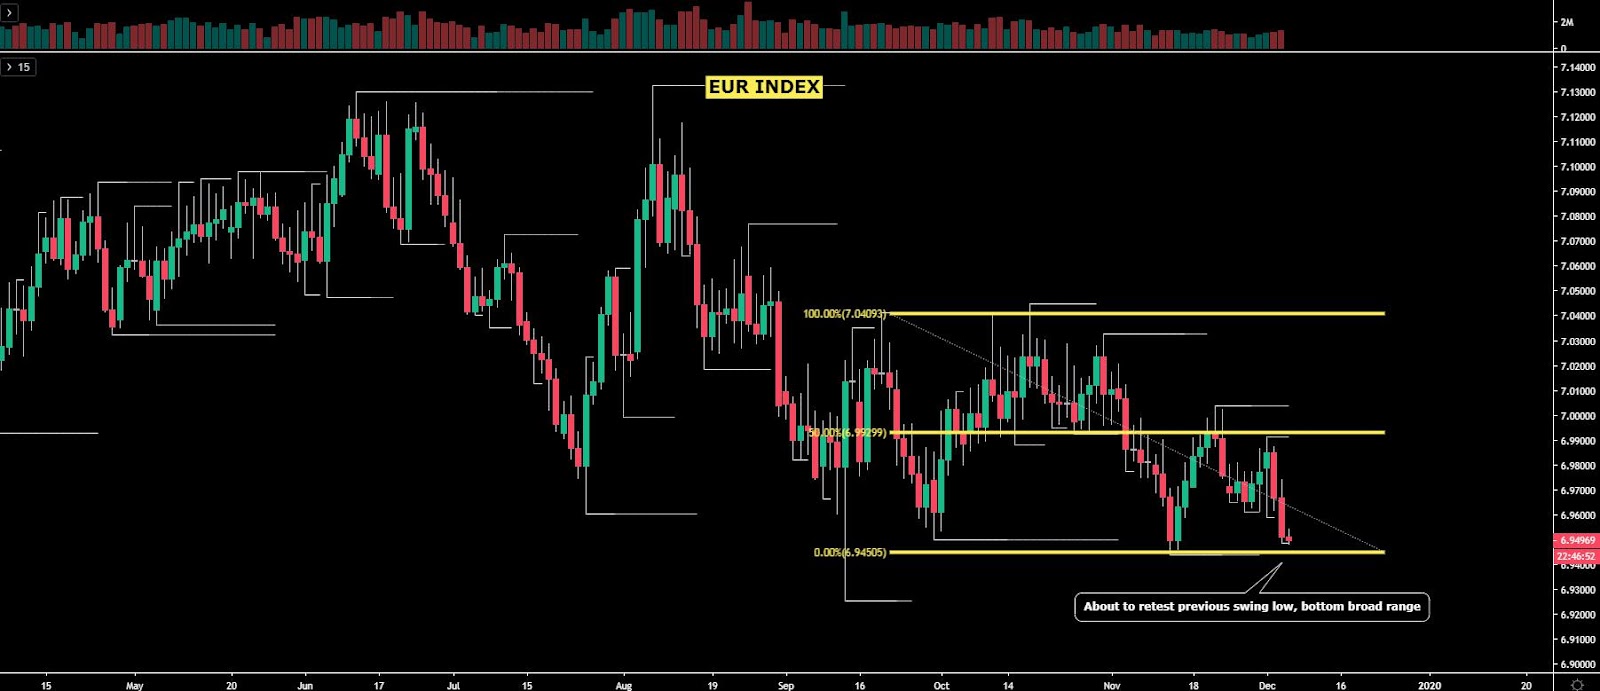
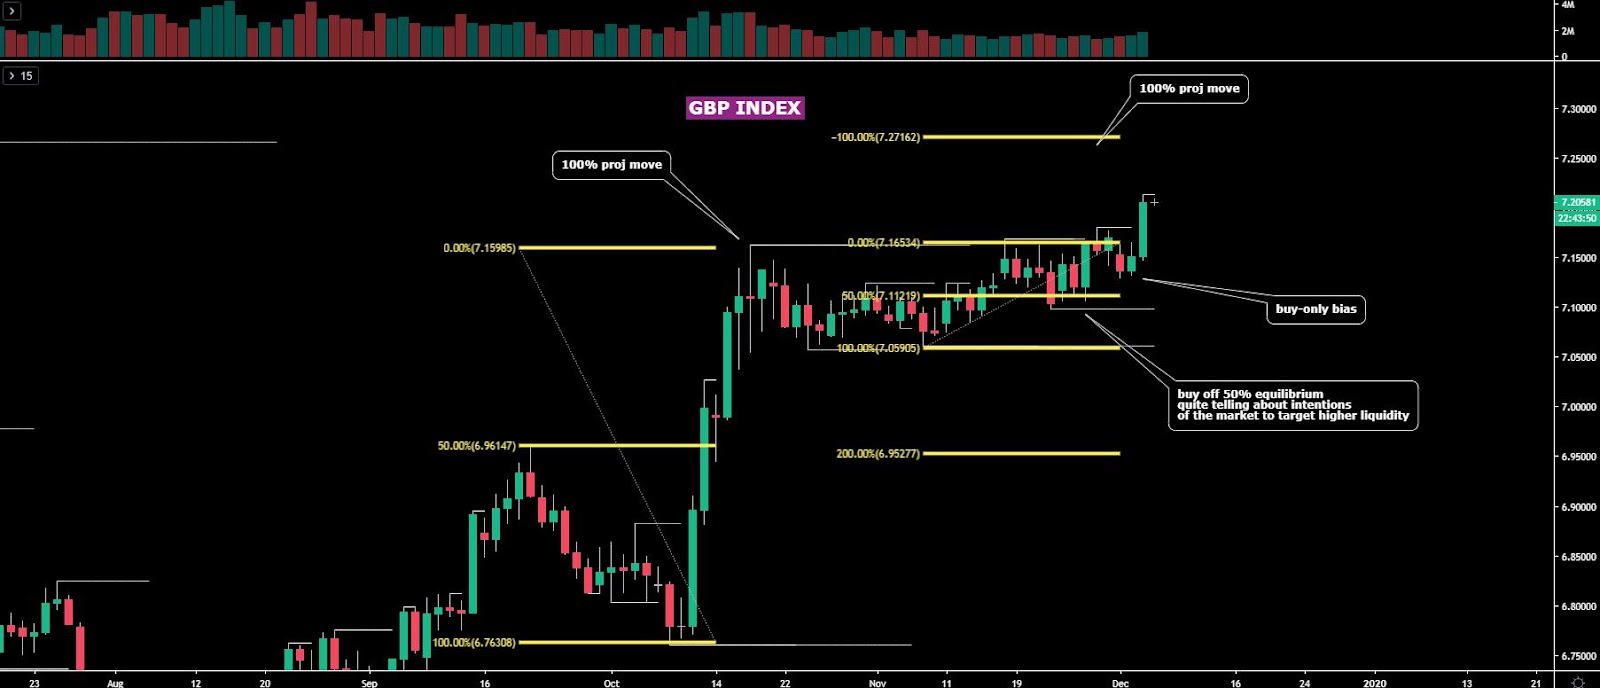
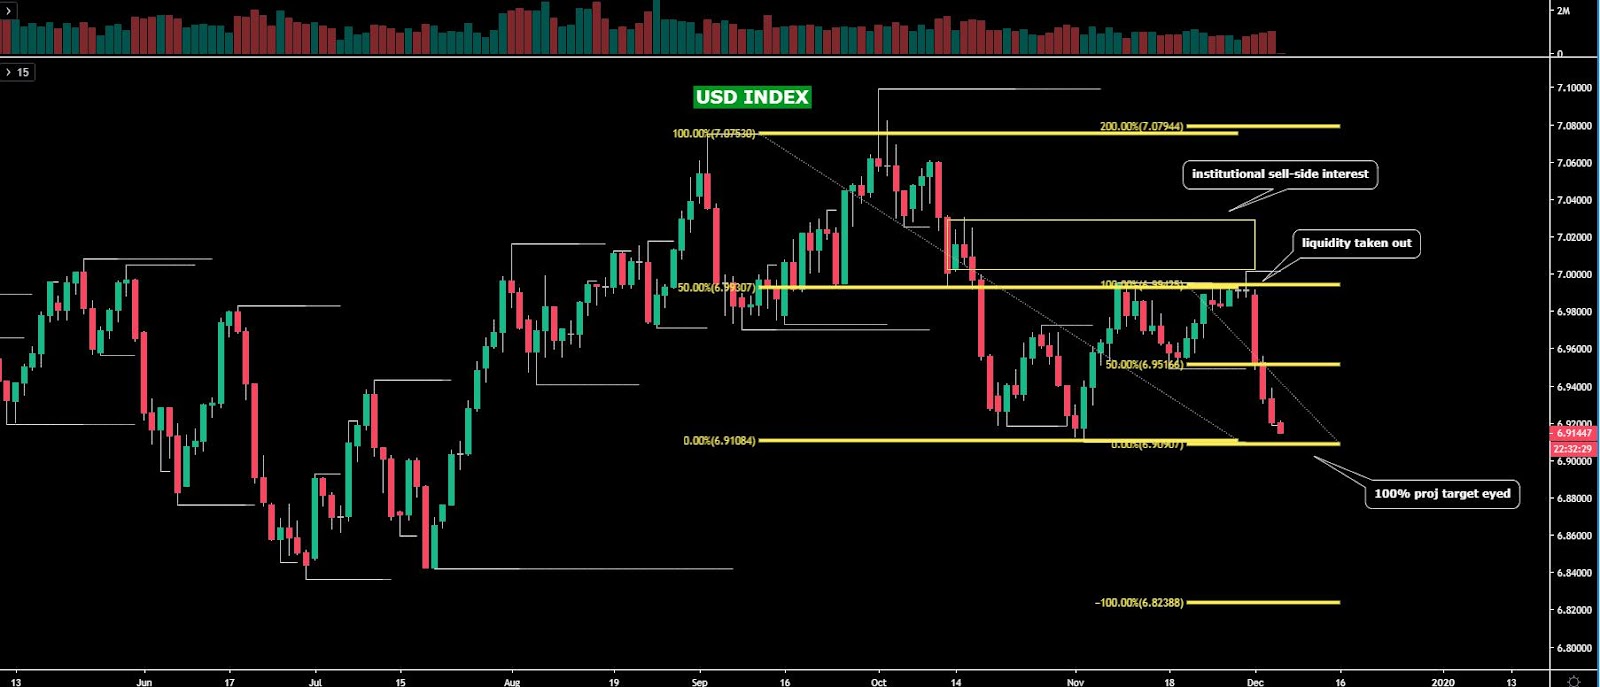
The indices show the performance of a particular currency vs G8 FX. An educational video on how to interpret these indices can be found in the Global Prime's Research section.
Narratives In Financial Markets
* The Information is gathered after scanning top publications including the FT, WSJ, Reuters, Bloomberg, ForexLive, Institutional Bank Research reports.
Glass half-full in the US-China trade saga: Despite the topsy-turvy state of affairs in the US-China trade negotiations, the market is still giving the two nations the benefit of the doubt. A headline overnight by China's head trade negotiator Liu saying that he remains "cautiously optimistic" about reaching a trade deal lifted the mood, even if he also said to be “confused about US demands.”
China keeps hopes alive a deal is possible: The fact that China commerce ministry denied rumours about possible disagreements in trade talks as not accurate also provided a helping hand to the overall mood as Europe came online. Officials said US, China trade teams will continue close communications to conclude phase one.
China extends invite to US trade representatives: As the North American session came online, the WSJ was out with a piece on China reportedly inviting US trade negotiators for more face-to-face talks after a phone call between the two parties last week with Liu He extending the invite to Robert Lighthizer and Steven Mnuchin. The position by the US is that unless China addressed the US demands on IP protection, forced technology transfers and agricultura purchases, they may not be ready for the trip.
Dec tariffs likely to be delayed: A report by the South China Morning Post fueled the optimism further. It notes that even if there's no trade deal, Dec 15 tariffs will be delayed. The report reads: “There is still some optimism that a watered-down deal can be reached before new US tariffs go into effect on December 15, but even if the deal proves elusive, sources say it is likely they will be at least postponed.”
Will Trump go after EU auto tariffs? Politico reports that Trump considers new trade investigation to justify tariffs on EU. The article notes how Trump is toying with that possibility “as the window closes for hitting Brussels with automobile tariffs, according to multiple people briefed on the issue.”
ECB minutes calls for unity: The latest account of the ECB October monetary policy meeting was published, highlighting how important it is from here on out for the committee to stay united. The Central Bank outlined that “economic data raised questions as to whether weakness would continue for longer than anticipated during September meeting”, and that “there was wide agreement that more information is needed to reassess the inflation outlook and impact of ECB measures.” As per further clues on the course of policy settings, “there was a plea made for patience to let the September package do its job, suggesting a "wait and see" stance in the near term.
BOC Poloz tames near-term rate cut expectations: The market walked back the rising expectation of a BOC rate cut in December after BOC's Governor Poloz threw a curveball to those in the dovish camp. The key headline read that Poloz “thinks monetary conditions are about right”, implying that the Central Bank does not perceive just yet the case to lower interest rates. The Canadian Dollar recovered its early losses, which had been exacerbated at the margin by a poor reading in the Canadian ADP October employment, which came at -22.6K vs +28.2K prior.
If you found this fundamental summary helpful, just click here to share it!
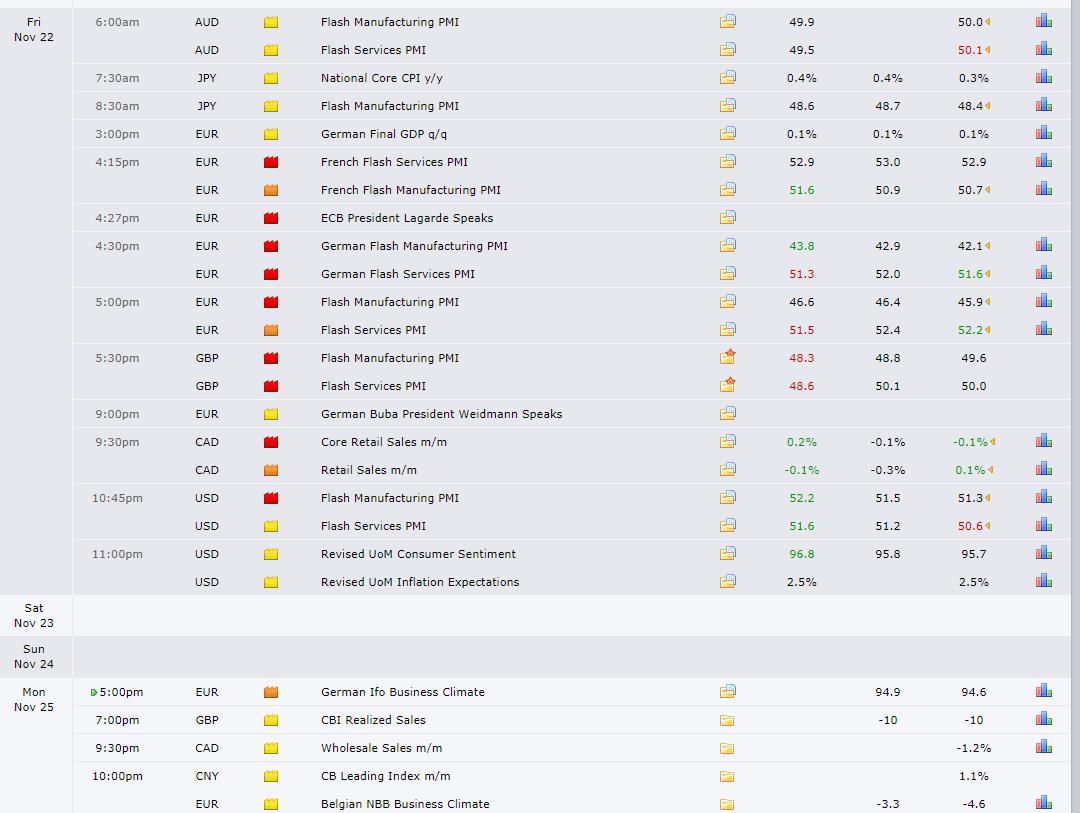
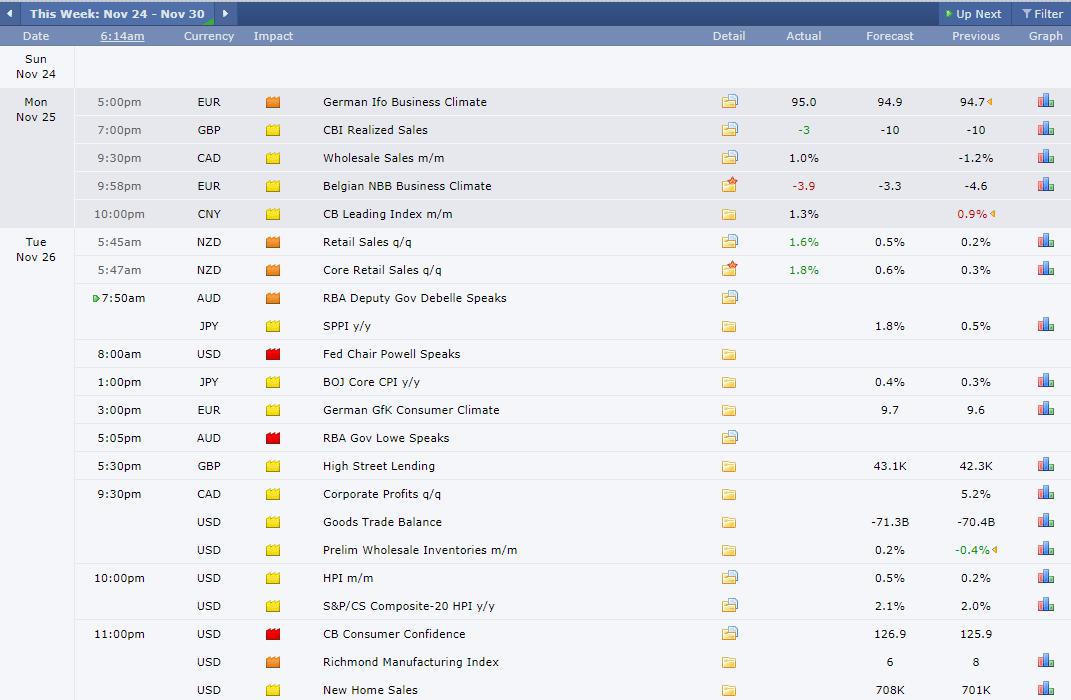
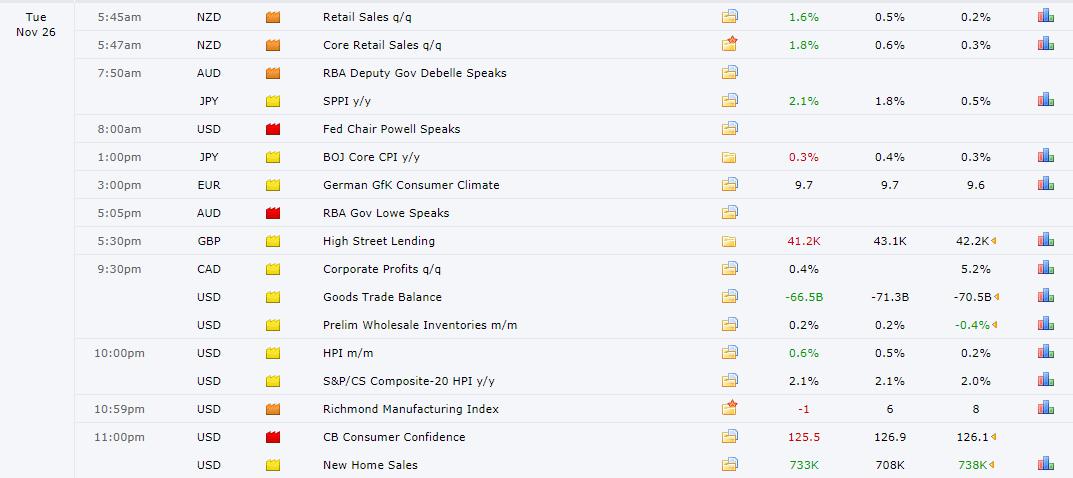
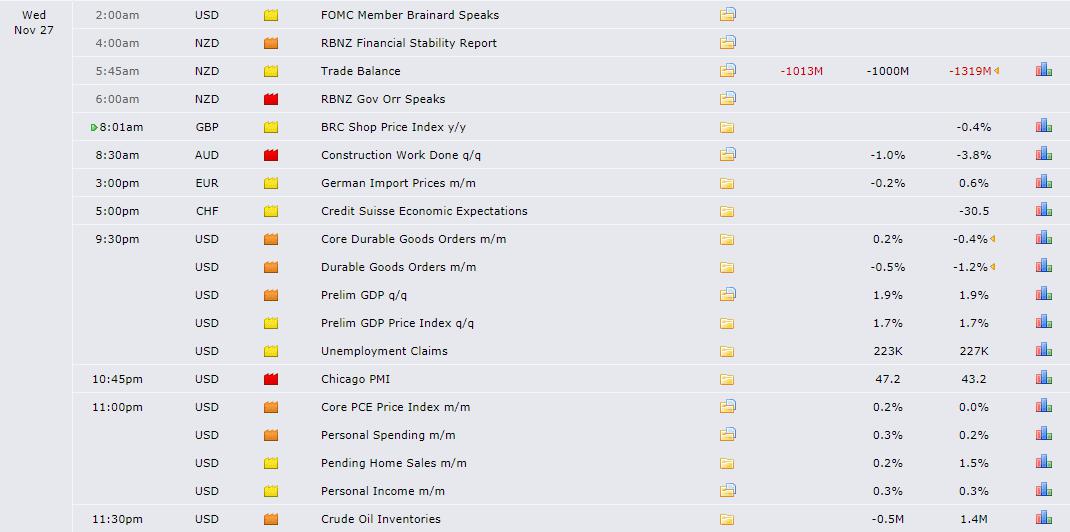
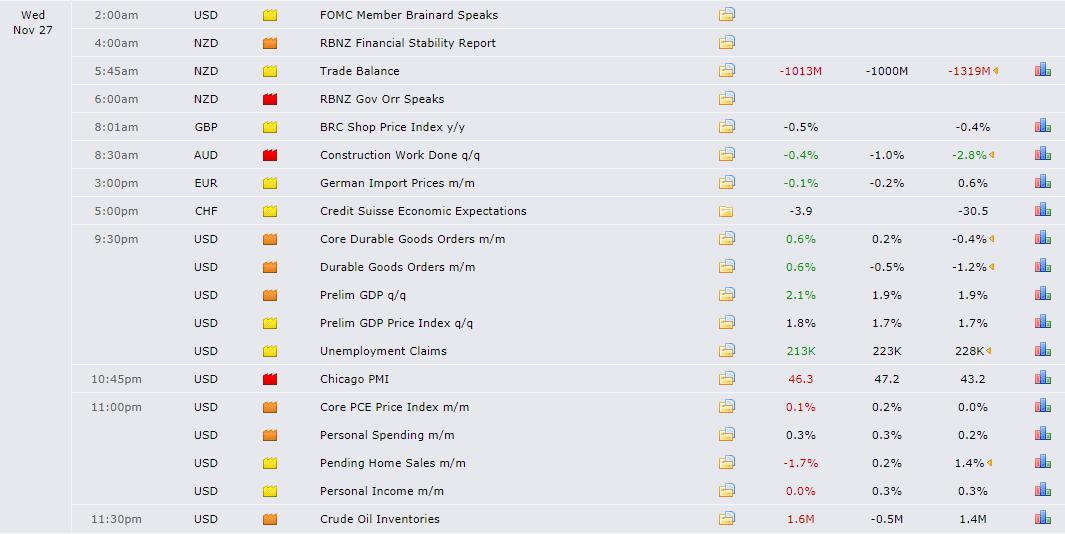
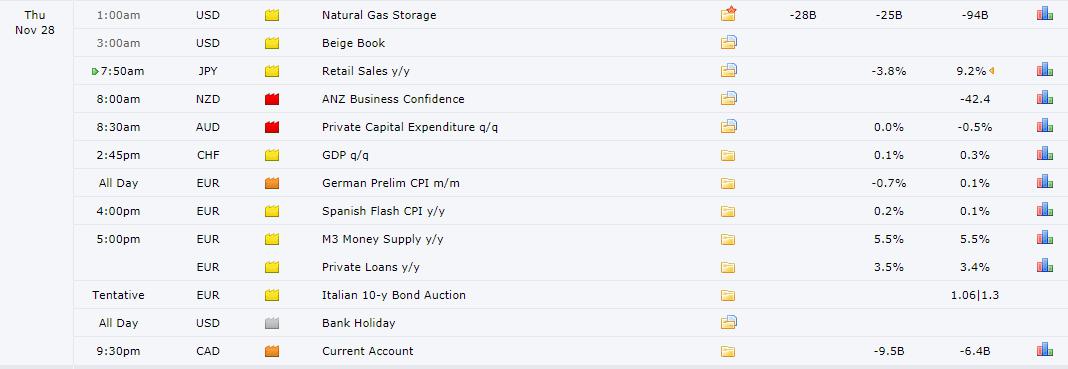
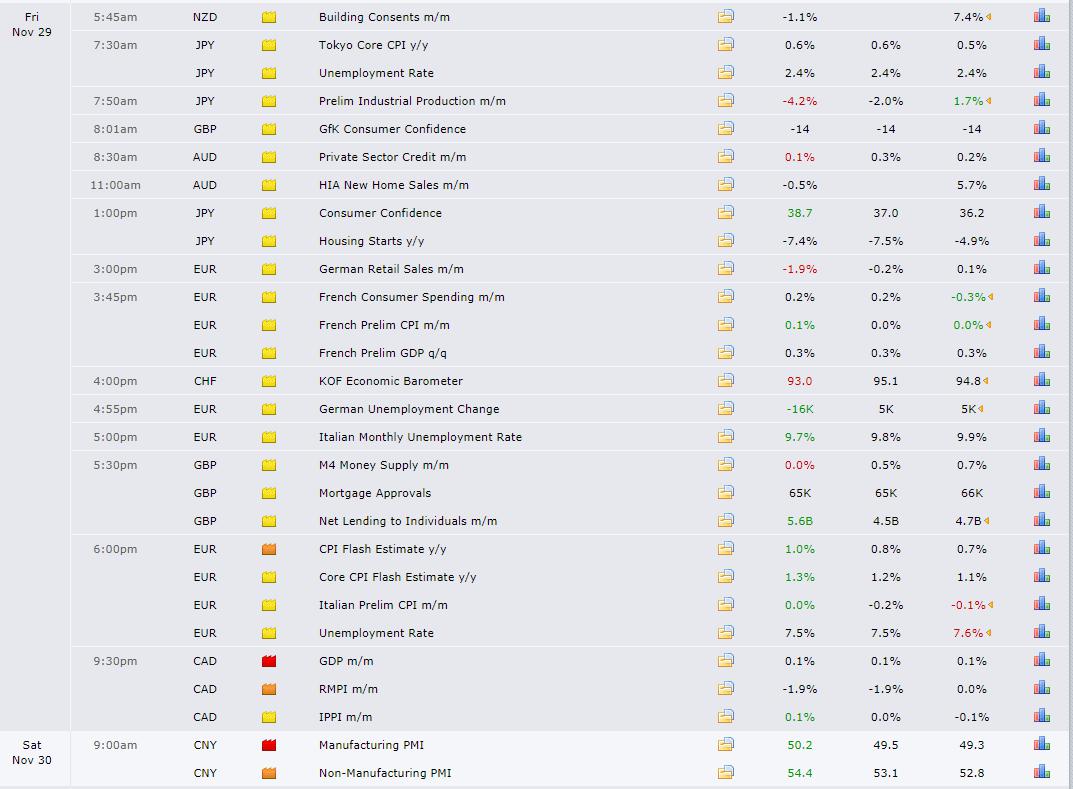
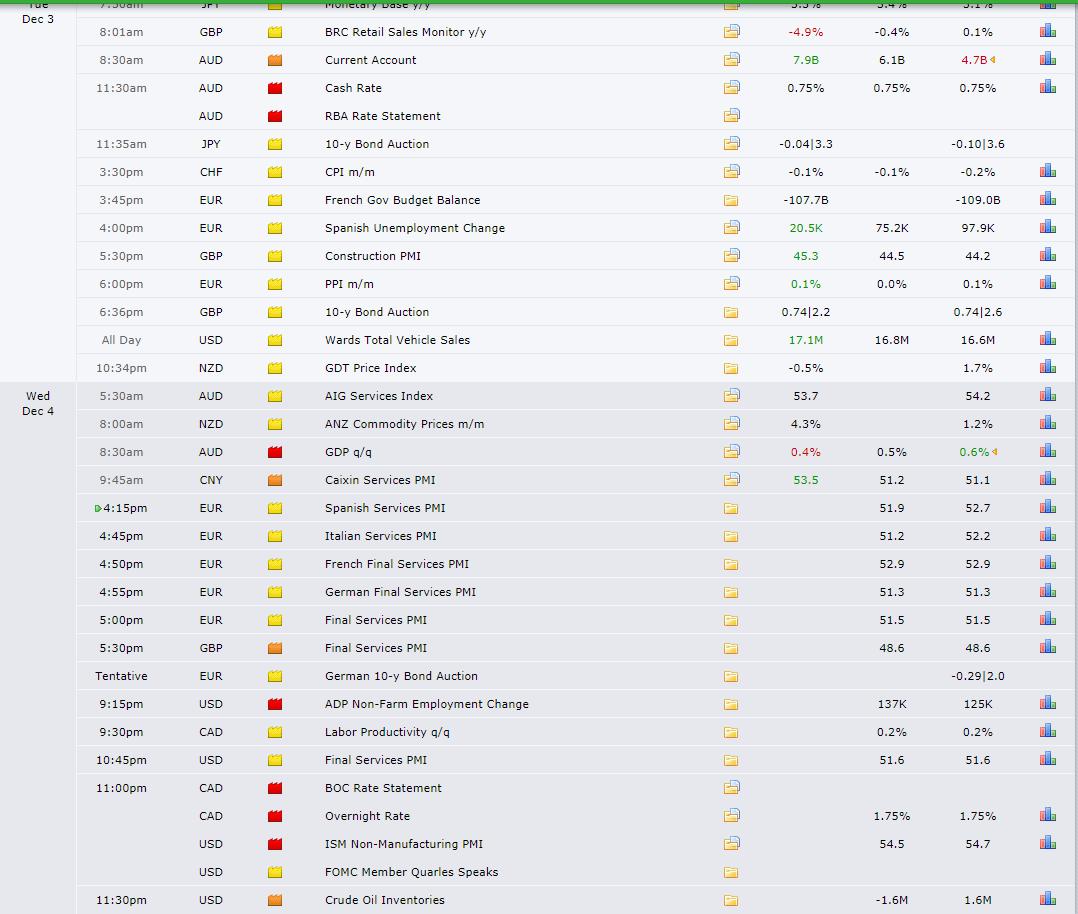
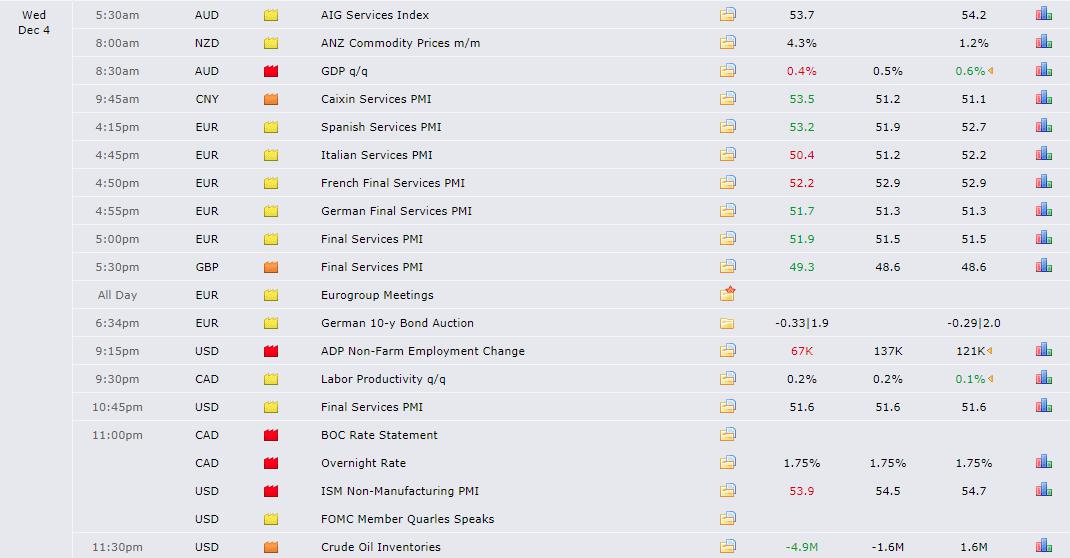
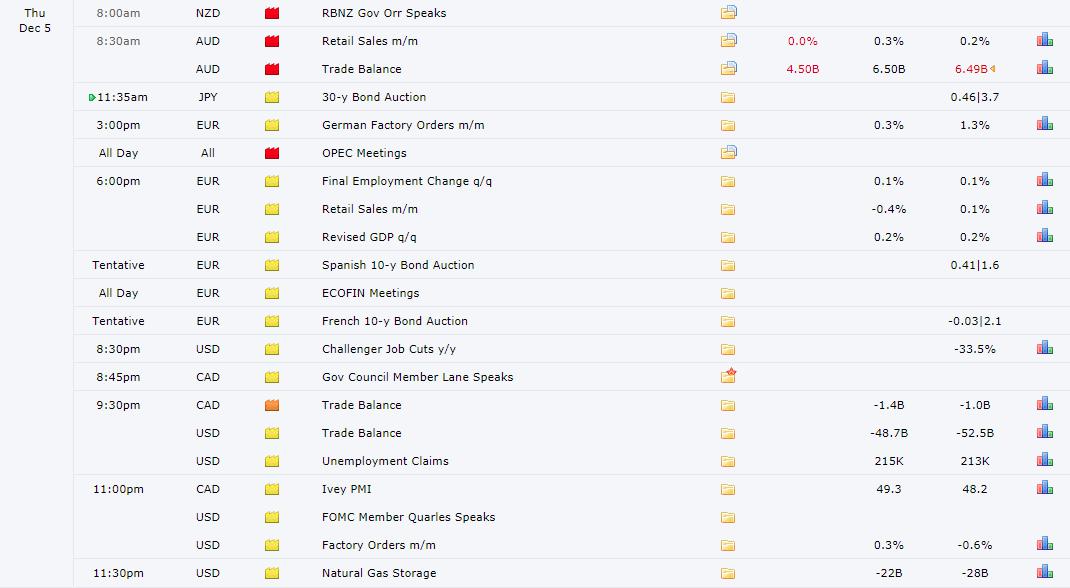
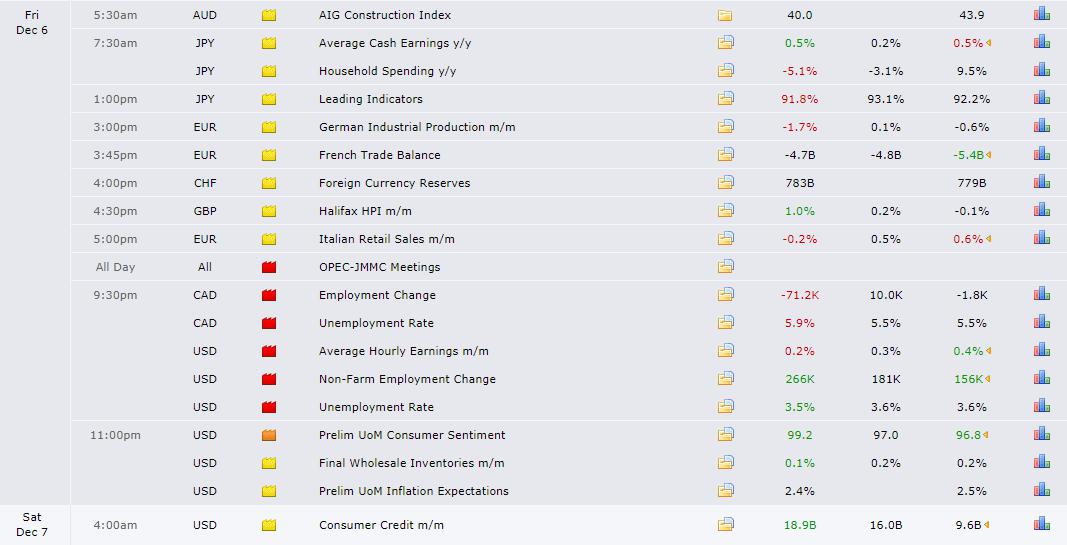
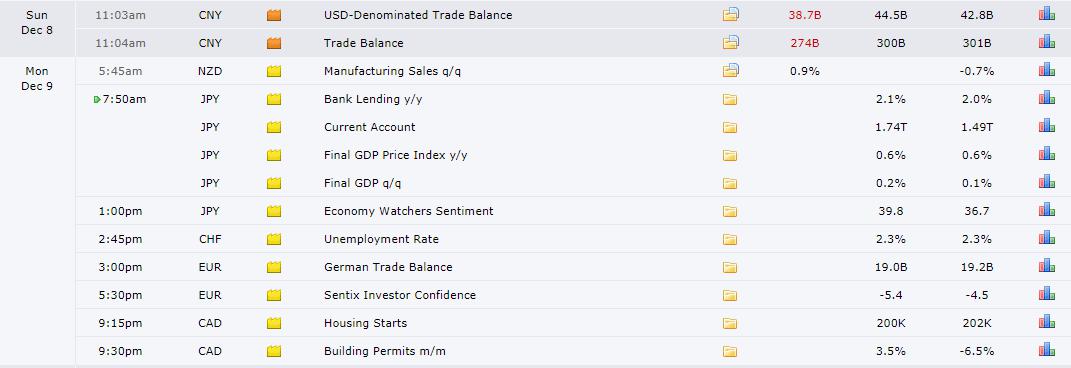
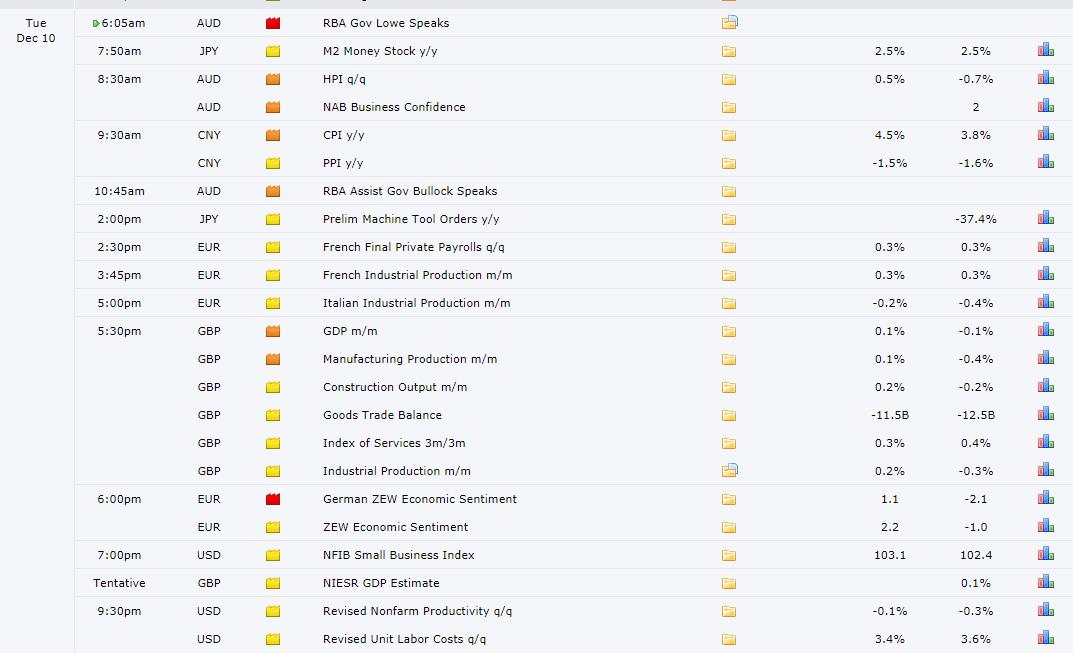
Recent Economic Indicators & Events Ahead
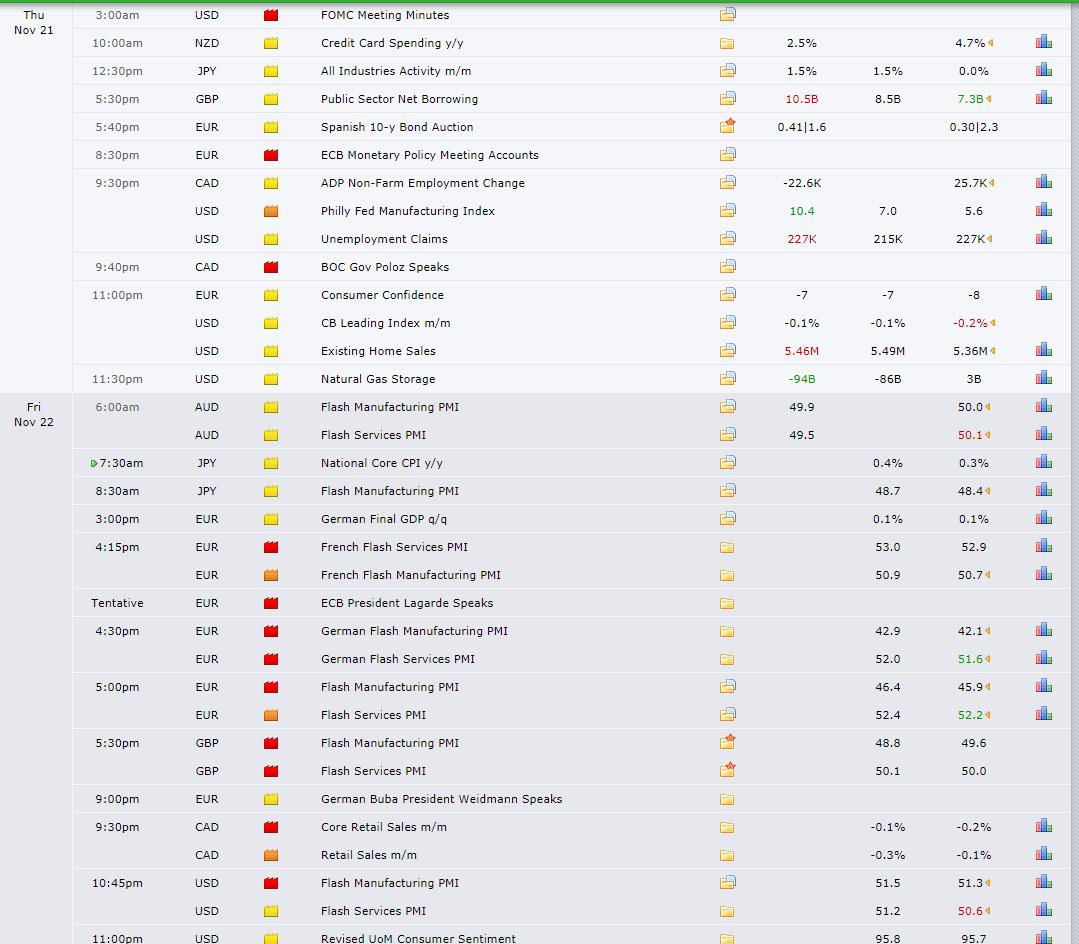
Source: Forexfactory
Professional Insights Into FX Charts
If you found the content in this section valuable, give us a share by just clicking here!
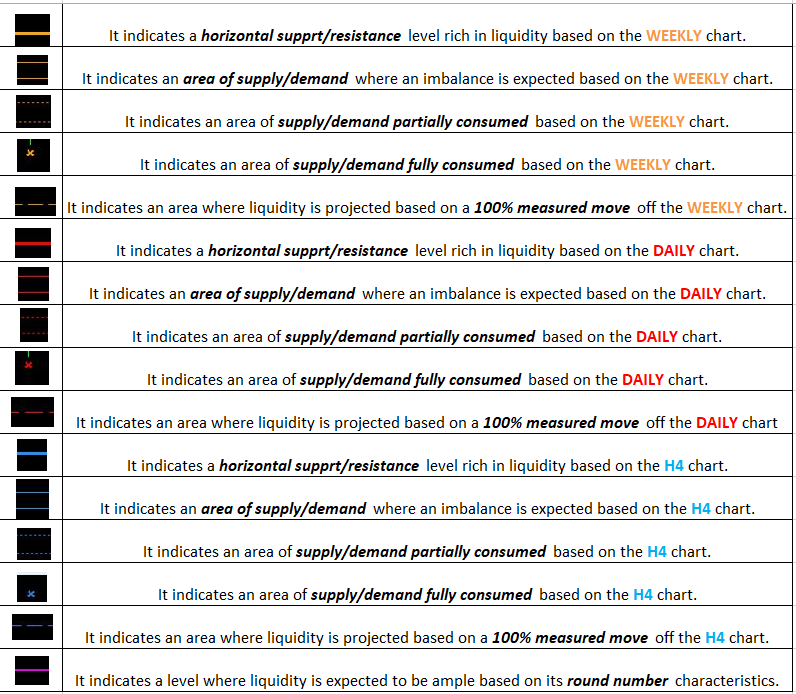
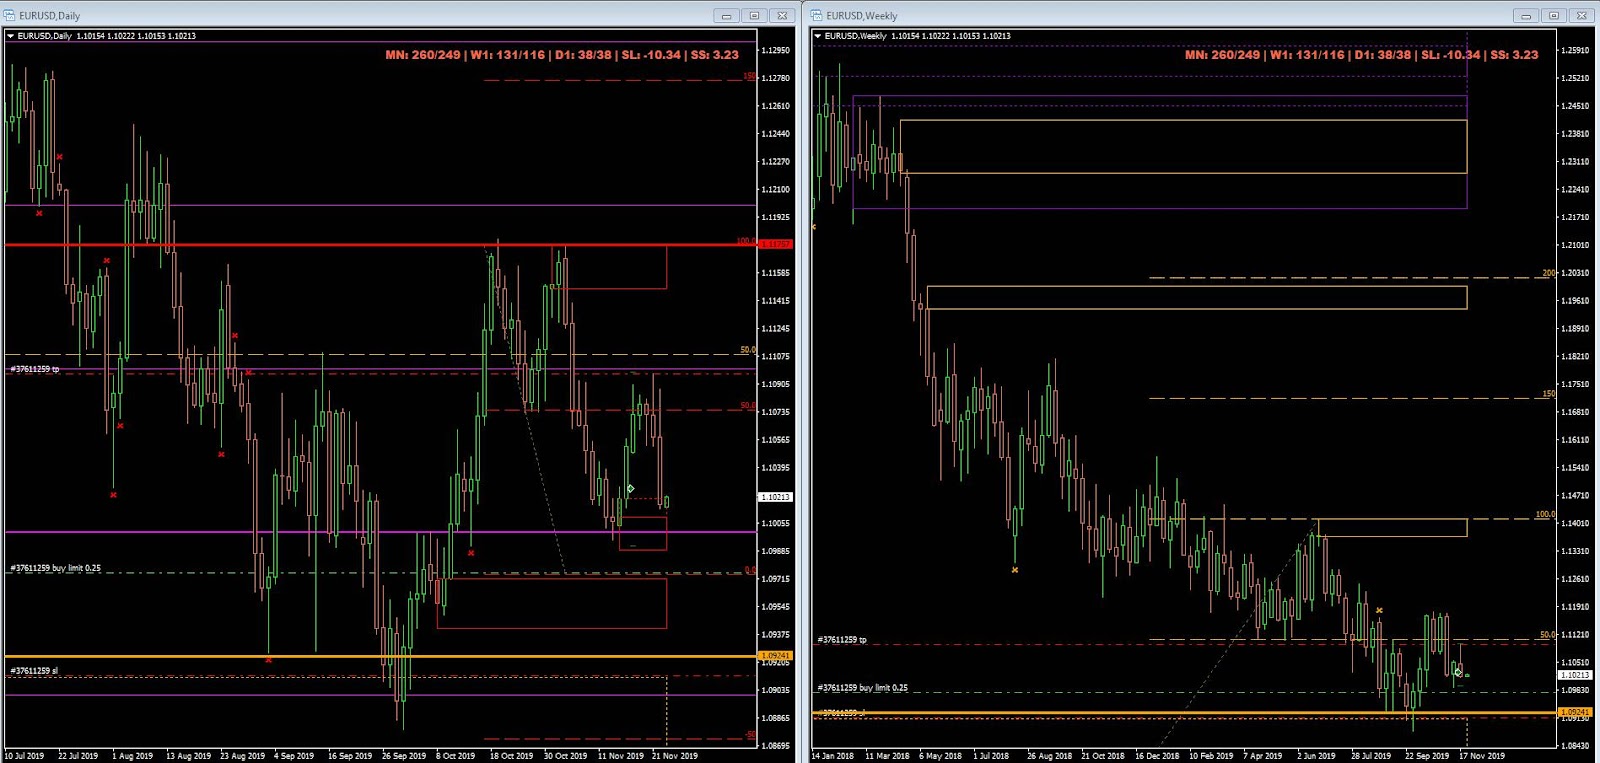
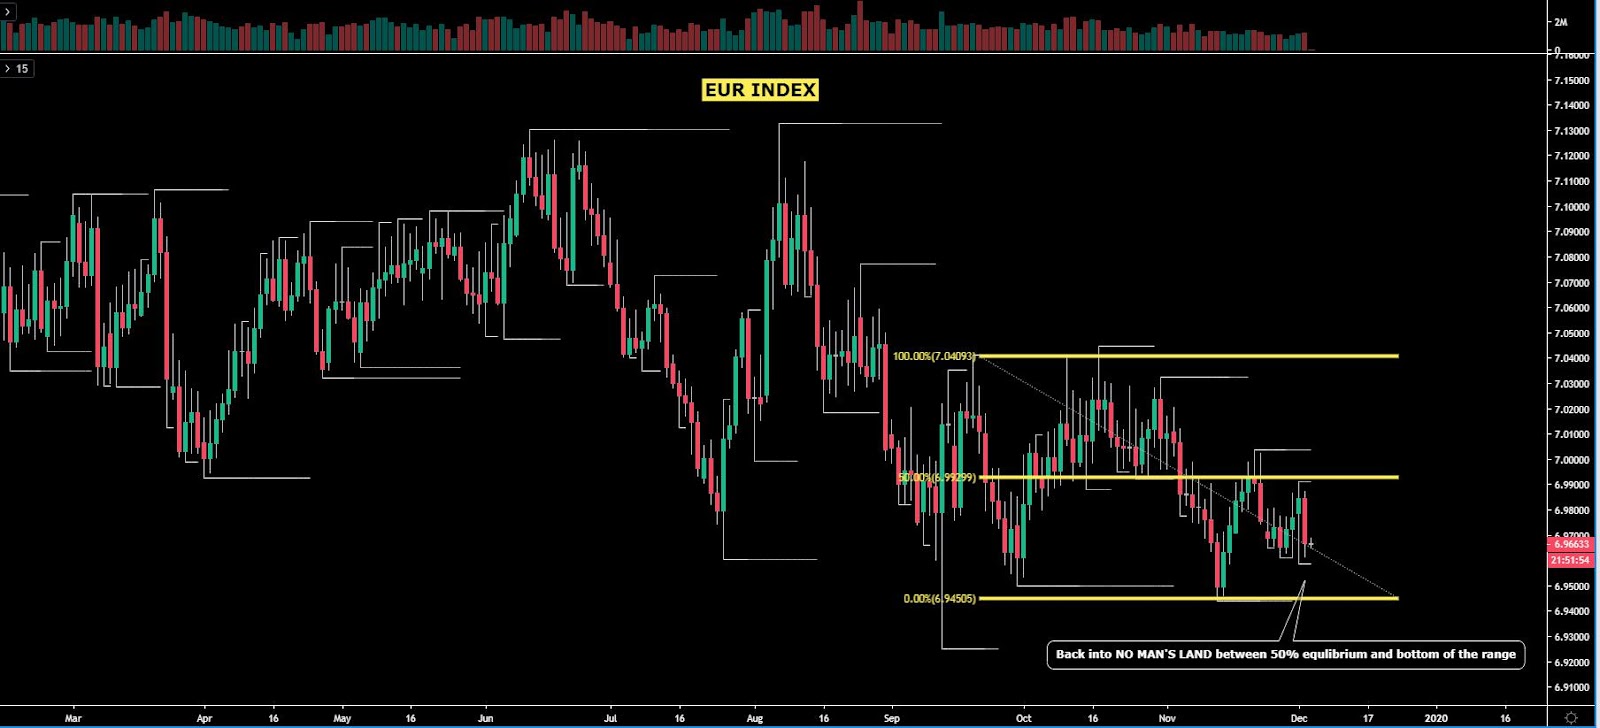
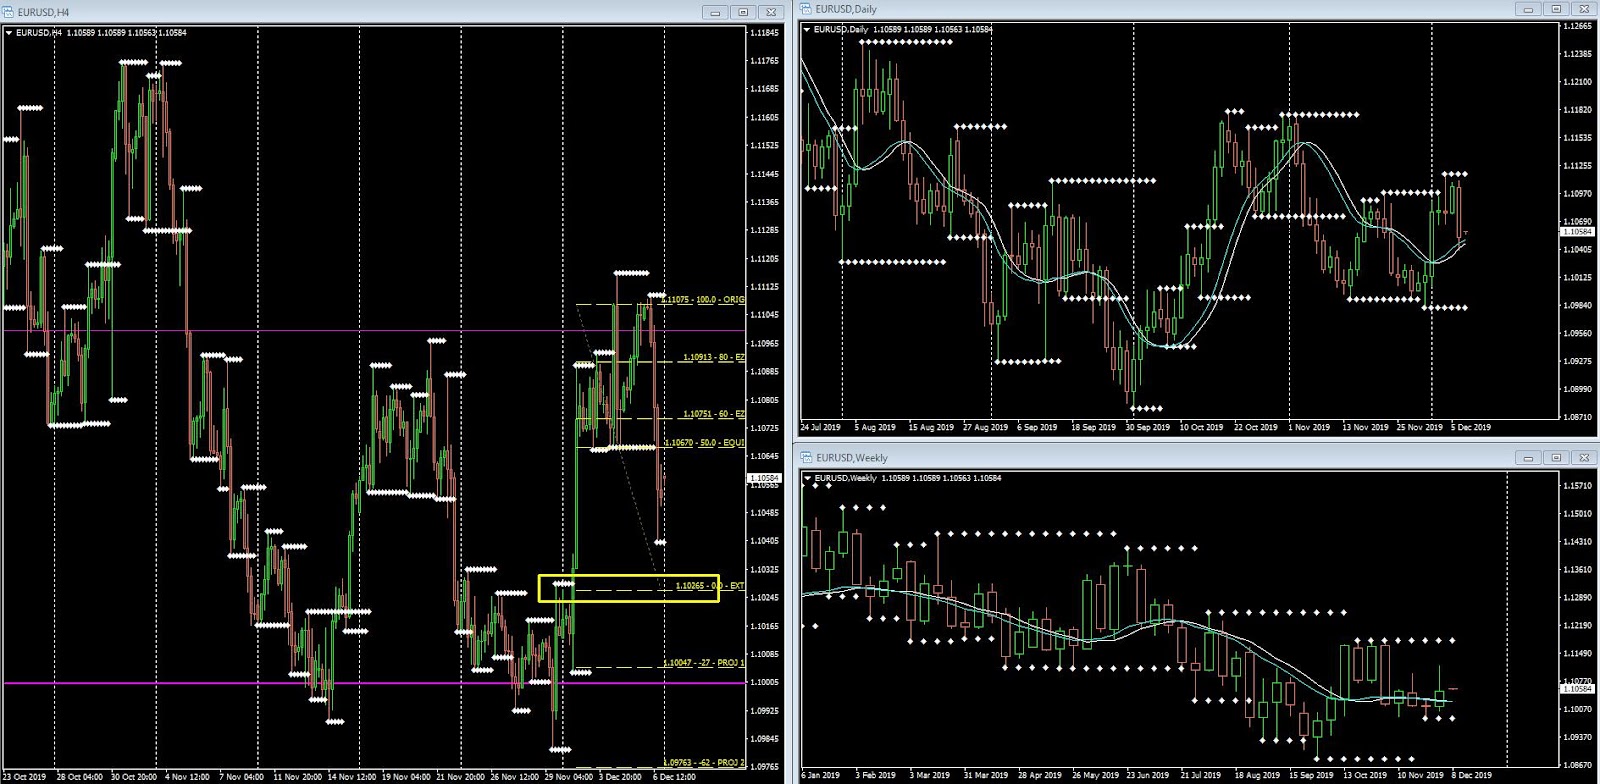
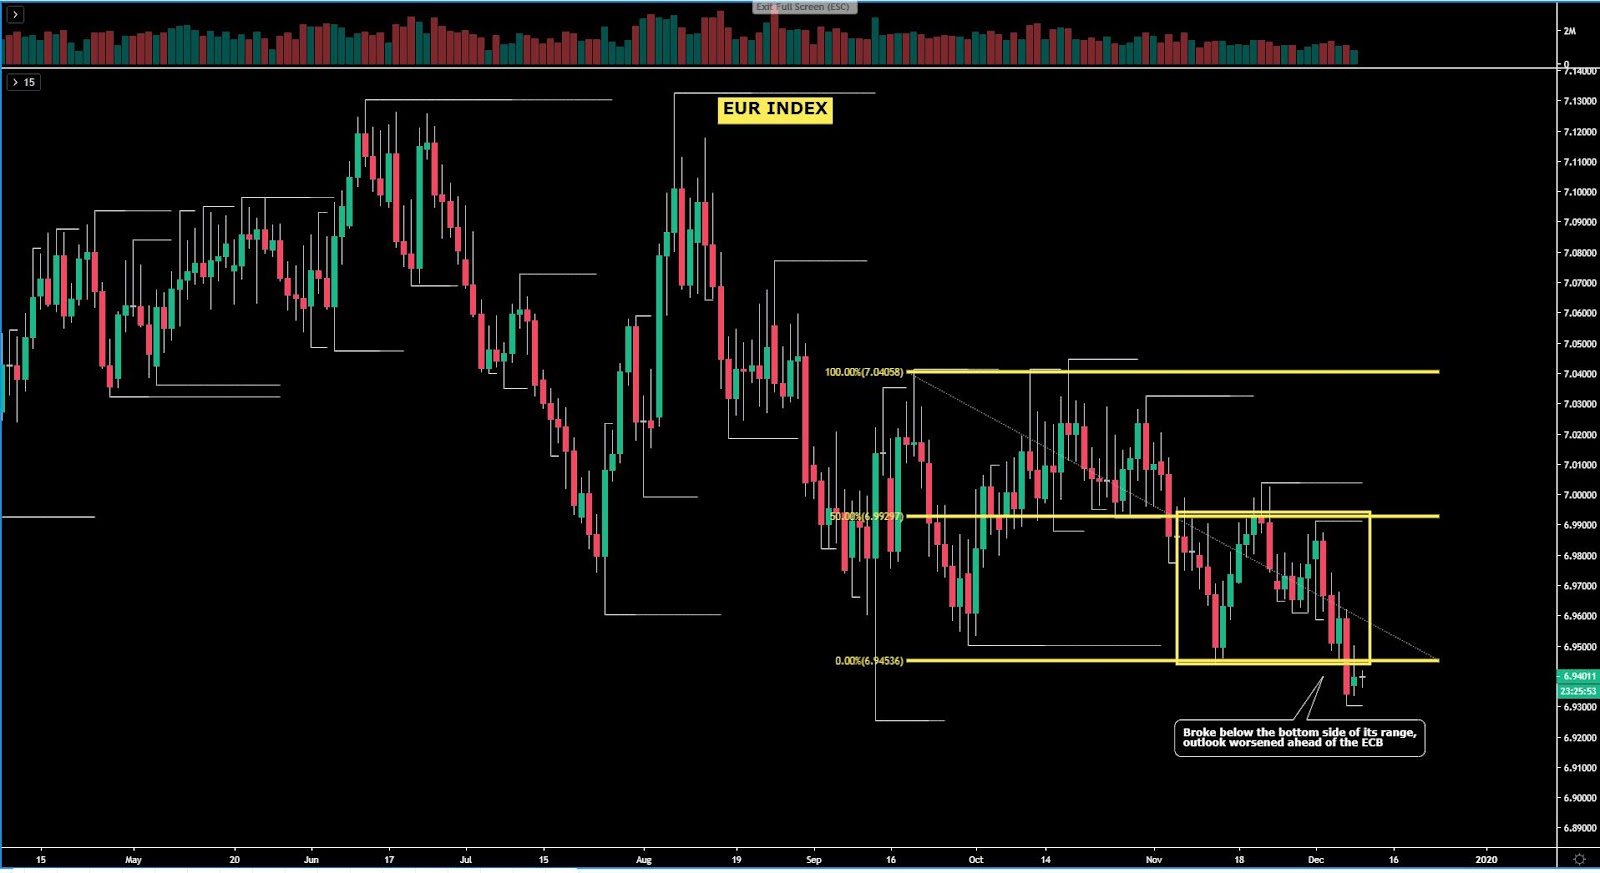
During yesterday’s live streaming, I talked extensively about the analysis of market structure, hence why I want to focus in this domain in today’s report. First, let’s distill the current environment in the EUR/USD hourly chart. As the chart below illustrates, the pair is currently confined in a range worth 35 pips, with market makers in control of the extremes. By drawing a 100% projection target from the recent accepted top through the prior swing low, you’d notice the area where the EUR landed at as weakness settled in coincided with the 100% measured move but also an H4 demand area that had been previously partially absorbed.
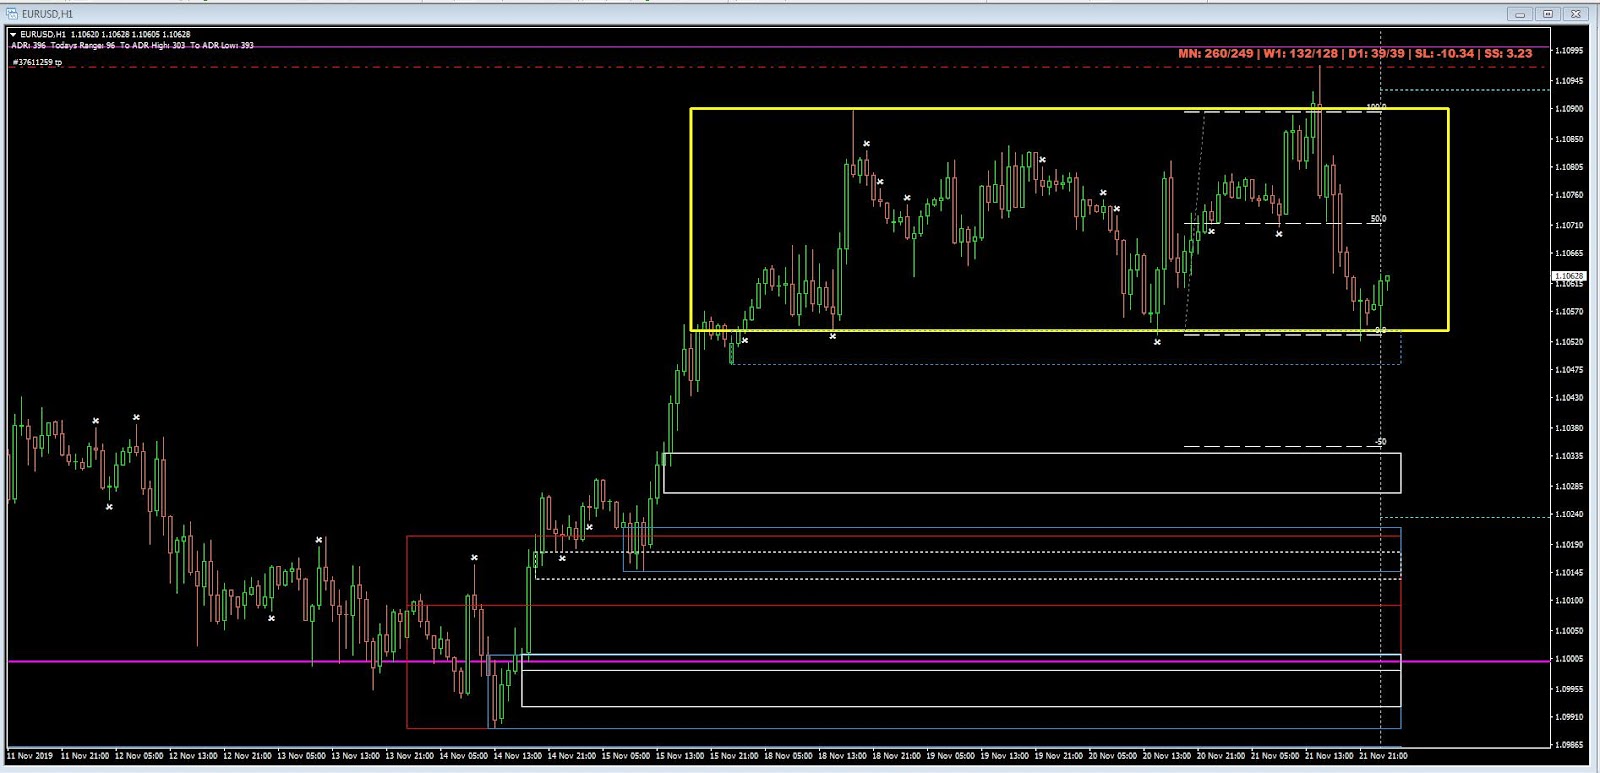
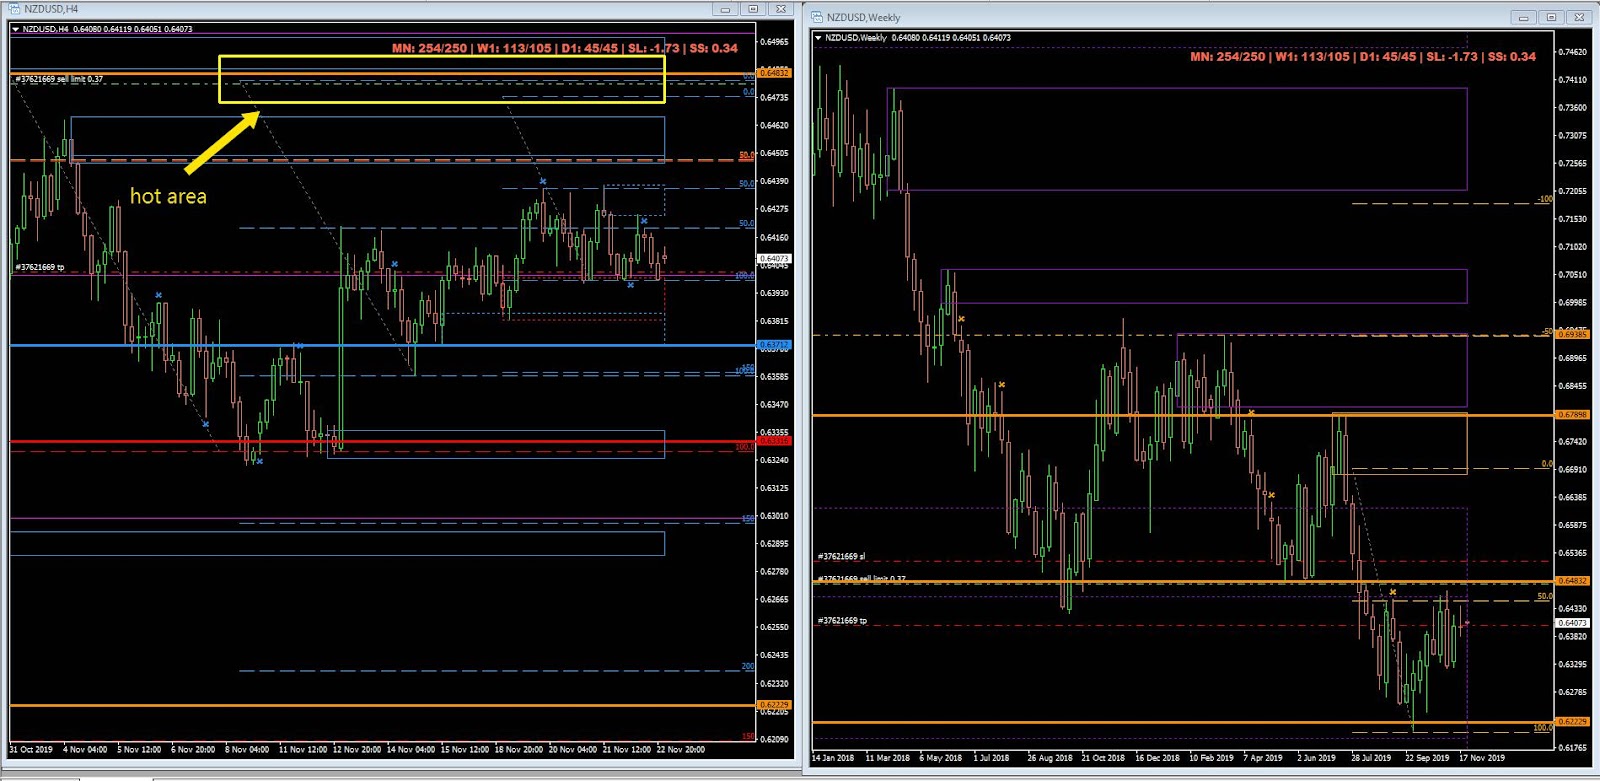
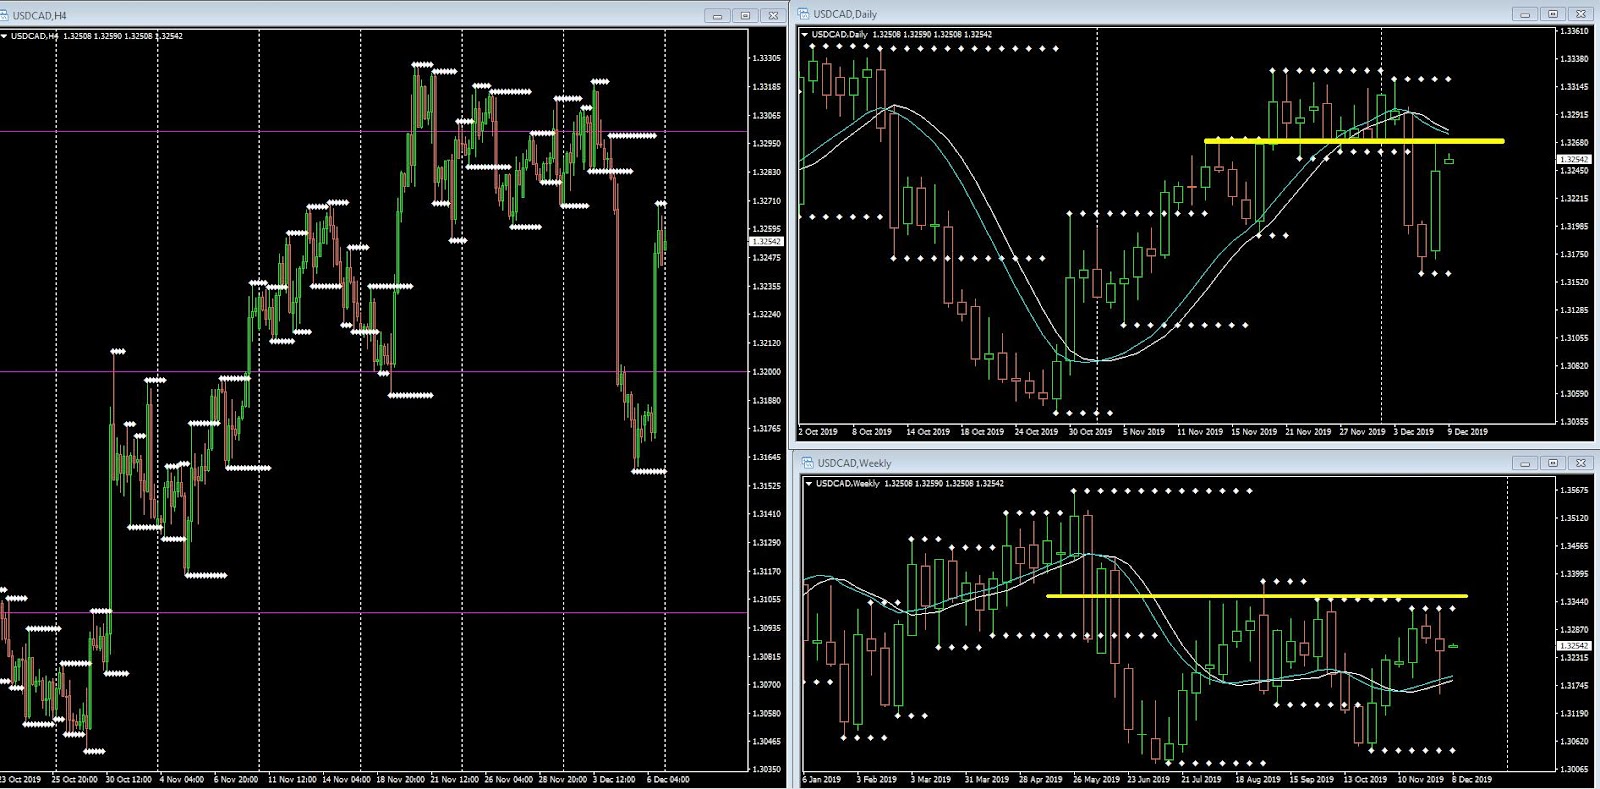
A pair that is starting to show some cracks on its constructive hourly trend is the USD/CAD, marked down after the BOC Poloz speech on Thursday. The price landed at the previous resistance turned support, also aligning with the 100% measured move. It’s worth noting that the pair is also pulling back from a daily area of supply after a 3-leg upcycle, which shows potential maturity of the bullish cycle, reinforced by the decreasing length of each extension.
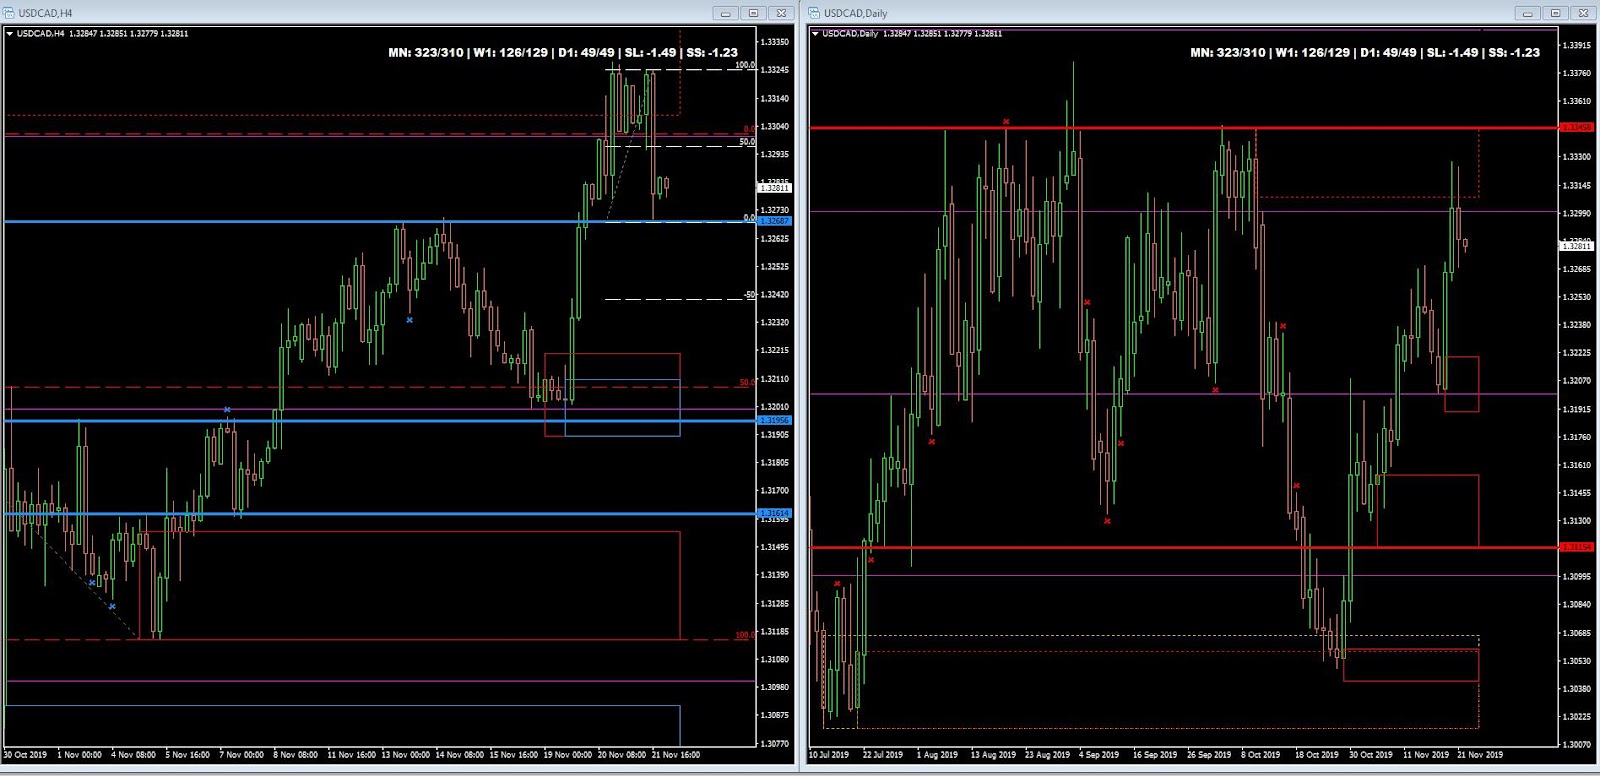
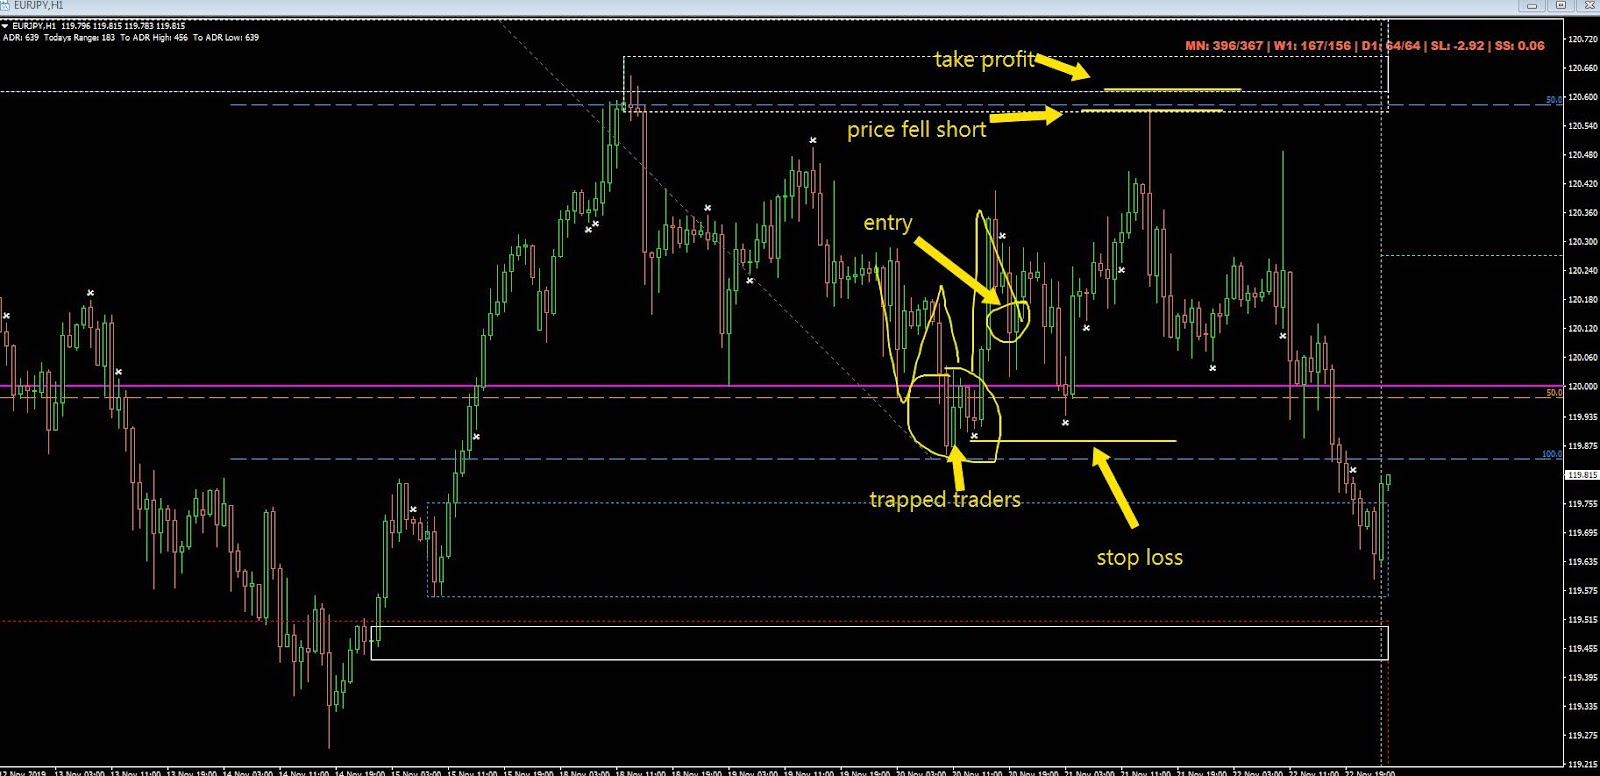
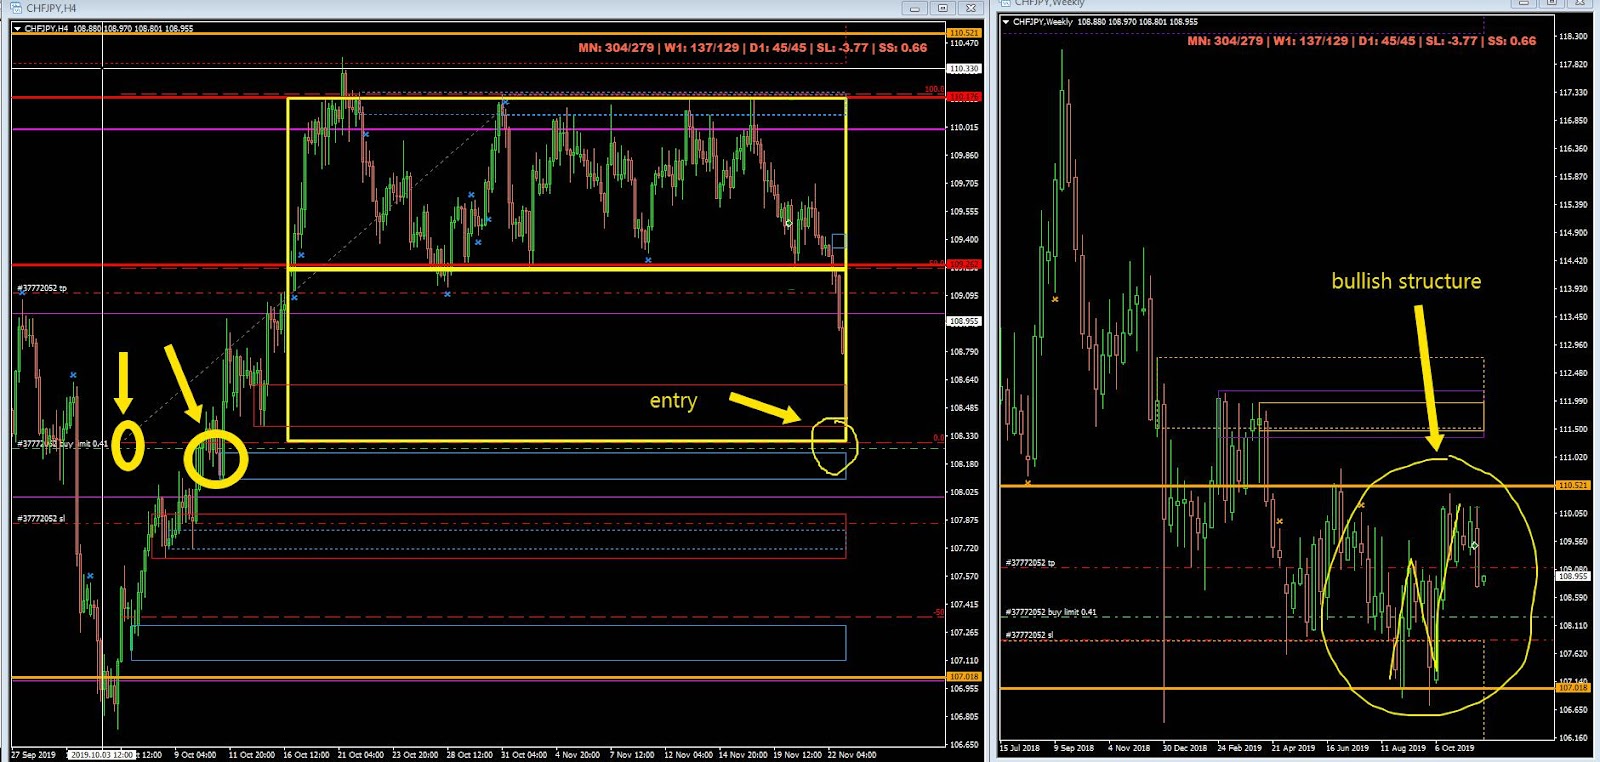
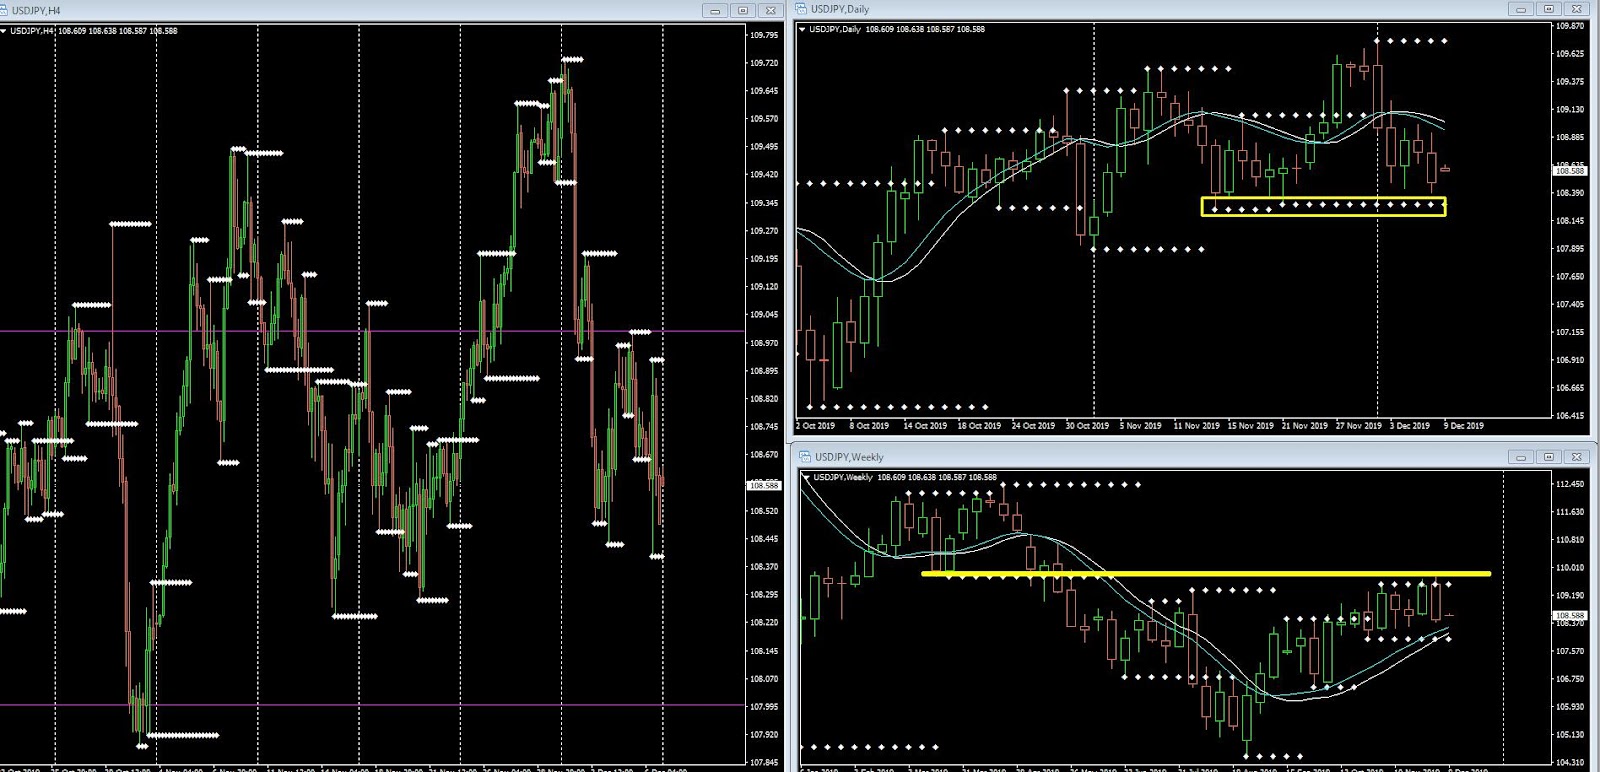
Lastly, the long EUR/JPY play on the basis of a ‘trapped traders’ pattern led to an eventual take off to the next logical area in the chart, that is, an hourly fresh supply imbalance. That area highlighted in the chart below in a white box marked the highest point for the day. Stay on alert to be on the lookout for these areas as they offer a blueprint to identify expected imbalanced.
Important Footnotes
G8 FX Taken Hostage By US-China Trade Rhetoric
The market remains fixated on the US-China trade headline, even if the base case continues to be pricing for an optimistic outcome. However, there is plenty of noise with little to no substance that can anchor the pretense of both sides so far. The lack of G8 FX fundamental drivers (exc CAD) + barrage of conflicting trade headlines led to little net changes for the week. Find out the latest in today's report.
The Daily Edge is authored by Ivan Delgado, 10y Forex Trader veteran & Market Insights Commentator at Global Prime. Feel free to follow Ivan on Twitter & Youtube weekly show. You can also subscribe to the mailing list to receive Ivan’s Daily wrap. The purpose of this content is to provide an assessment of the conditions, taking an in-depth look of market dynamics - fundamentals and technicals - determine daily biases and assist one’s trading decisions.
Let’s get started…
- Quick Take
- Narratives in Financial Markets
- Recent Economic Indicators
- Dive Into Pro FX Chart Insights
- Educational Material
Quick Take
The Canadian Dollar was hands down the top performer as BoC Governor Poloz threw cold water to the prospects of a rate cut in December. The abrupt rise in the CAD came in tandem with an appreciation in the US Dollar index, which made new highs for the week as the market still sees the US-China trade saga as a glass half-full. The Euro kept treading water, encapsulated in a tiny range on Thursday, with a very timid response to the ECB minutes, which called for unity after the recent division in policy views. The Pound was unable to sustain the solid gains printed through the European session, suffering a significant slide as the North American session came to an end. Meanwhile, the Oceanic currencies went through a mixed-bag at an index level amid the lack of fundamental drivers other than the US-China trade headlines, which helped to cap the downside in the Aussie as the Yuan found buyers on dips. The renewed optimism plays into the view that the base case remains pricing for the US-China to eventually seal a deal. Lastly, the funding currencies (JPY, CHF) were both marginally weaker as the risk appetite recovered a tad even if we are far from blaring the trumpets on the trade front.
The indices show the performance of a particular currency vs G8 FX. An educational video on how to interpret these indices can be found in the Global Prime's Research section.
Narratives In Financial Markets
* The Information is gathered after scanning top publications including the FT, WSJ, Reuters, Bloomberg, ForexLive, Institutional Bank Research reports.
Glass half-full in the US-China trade saga: Despite the topsy-turvy state of affairs in the US-China trade negotiations, the market is still giving the two nations the benefit of the doubt. A headline overnight by China's head trade negotiator Liu saying that he remains "cautiously optimistic" about reaching a trade deal lifted the mood, even if he also said to be “confused about US demands.”
China keeps hopes alive a deal is possible: The fact that China commerce ministry denied rumours about possible disagreements in trade talks as not accurate also provided a helping hand to the overall mood as Europe came online. Officials said US, China trade teams will continue close communications to conclude phase one.
China extends invite to US trade representatives: As the North American session came online, the WSJ was out with a piece on China reportedly inviting US trade negotiators for more face-to-face talks after a phone call between the two parties last week with Liu He extending the invite to Robert Lighthizer and Steven Mnuchin. The position by the US is that unless China addressed the US demands on IP protection, forced technology transfers and agricultura purchases, they may not be ready for the trip.
Dec tariffs likely to be delayed: A report by the South China Morning Post fueled the optimism further. It notes that even if there's no trade deal, Dec 15 tariffs will be delayed. The report reads: “There is still some optimism that a watered-down deal can be reached before new US tariffs go into effect on December 15, but even if the deal proves elusive, sources say it is likely they will be at least postponed.”
Will Trump go after EU auto tariffs? Politico reports that Trump considers new trade investigation to justify tariffs on EU. The article notes how Trump is toying with that possibility “as the window closes for hitting Brussels with automobile tariffs, according to multiple people briefed on the issue.”
ECB minutes calls for unity: The latest account of the ECB October monetary policy meeting was published, highlighting how important it is from here on out for the committee to stay united. The Central Bank outlined that “economic data raised questions as to whether weakness would continue for longer than anticipated during September meeting”, and that “there was wide agreement that more information is needed to reassess the inflation outlook and impact of ECB measures.” As per further clues on the course of policy settings, “there was a plea made for patience to let the September package do its job, suggesting a "wait and see" stance in the near term.
BOC Poloz tames near-term rate cut expectations: The market walked back the rising expectation of a BOC rate cut in December after BOC's Governor Poloz threw a curveball to those in the dovish camp. The key headline read that Poloz “thinks monetary conditions are about right”, implying that the Central Bank does not perceive just yet the case to lower interest rates. The Canadian Dollar recovered its early losses, which had been exacerbated at the margin by a poor reading in the Canadian ADP October employment, which came at -22.6K vs +28.2K prior.
If you found this fundamental summary helpful, just click here to share it!
Recent Economic Indicators & Events Ahead
Source: Forexfactory
Professional Insights Into FX Charts
If you found the content in this section valuable, give us a share by just clicking here!
During yesterday’s live streaming, I talked extensively about the analysis of market structure, hence why I want to focus in this domain in today’s report. First, let’s distill the current environment in the EUR/USD hourly chart. As the chart below illustrates, the pair is currently confined in a range worth 35 pips, with market makers in control of the extremes. By drawing a 100% projection target from the recent accepted top through the prior swing low, you’d notice the area where the EUR landed at as weakness settled in coincided with the 100% measured move but also an H4 demand area that had been previously partially absorbed.
A pair that is starting to show some cracks on its constructive hourly trend is the USD/CAD, marked down after the BOC Poloz speech on Thursday. The price landed at the previous resistance turned support, also aligning with the 100% measured move. It’s worth noting that the pair is also pulling back from a daily area of supply after a 3-leg upcycle, which shows potential maturity of the bullish cycle, reinforced by the decreasing length of each extension.
Lastly, the long EUR/JPY play on the basis of a ‘trapped traders’ pattern led to an eventual take off to the next logical area in the chart, that is, an hourly fresh supply imbalance. That area highlighted in the chart below in a white box marked the highest point for the day. Stay on alert to be on the lookout for these areas as they offer a blueprint to identify expected imbalanced.
Important Footnotes
- Cycles: Markets evolve in cycles followed by a period of distribution and/or accumulation. To understand the principles applied in the assessment of cycles, refer to the tutorial How To Read Market Structures In Forex
- Horizontal Support/Resistance: Unlike levels of dynamic support or resistance or more subjective measurements such as fibonacci retracements, pivot points, trendlines, or other forms of reactive areas, the horizontal lines of support and resistance are universal concepts used by the majority of market participants. It, therefore, makes the areas the most widely followed and relevant to monitor. The Ultimate Guide To Identify Areas Of High Interest In Any Market
- Trendlines: Besides the horizontal lines, trendlines are helpful as a visual representation of the trend. The trendlines are drawn respecting a series of rules that determine the validation of a new cycle being created. Therefore, these trendline drawn in the chart hinge to a certain interpretation of market structures.
- Fundamentals: It’s important to highlight that the daily market outlook provided in this report is subject to the impact of the fundamental news. Any unexpected news may cause the price to behave erratically in the short term.
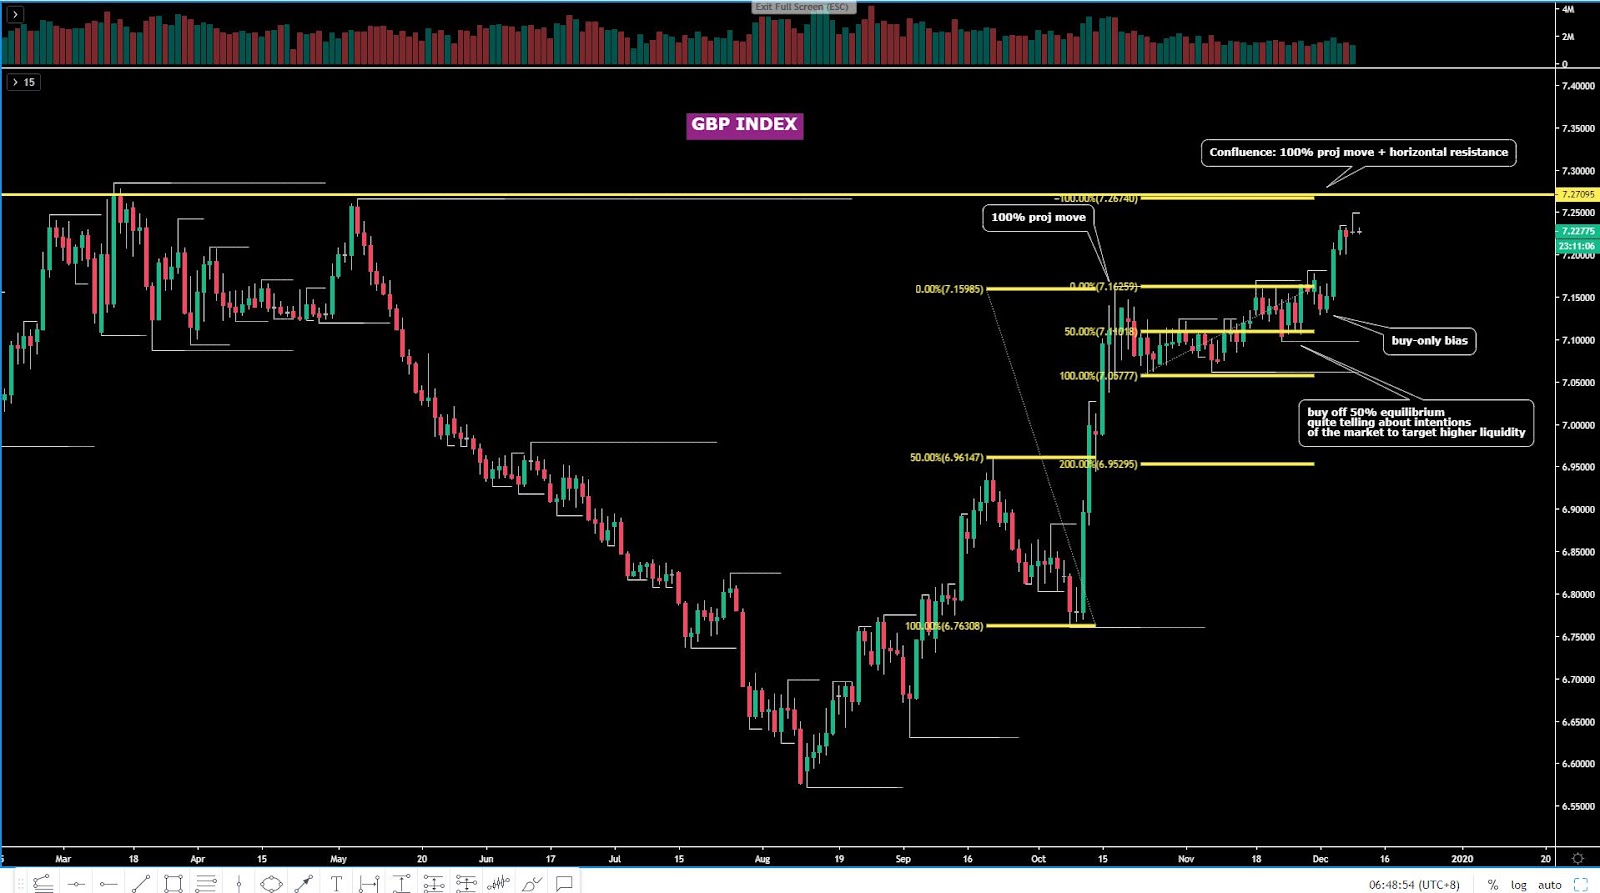
- Projection Targets: The usefulness of the 100% projection resides in the symmetry and harmonic relationships of market cycles. By drawing a 100% projection, you can anticipate the area in the chart where some type of pause and potential reversals in price is likely to occur, due to 1. The side in control of the cycle takes profits 2. Counter-trend positions are added by contrarian players 3. These are price points where limit orders are set by market-makers. You can find out more by reading the tutorial on The Magical 100% Fibonacci Projection