IvanGlobalPrime
Company Representative
- Messages
- 36
Find my latest market thoughts
Euro Capitalizes On Germany's Green Shoots
The EUR was emboldened by the prospects of a 'gentle turning point' in the German economy, with the CHF also benefiting from the ebbs and flows. The GBP showed residual demand only to evaporate Tuesday's gains by a setback in the UK Gov MRP poll. The USD remains lagging behind ahead of today's FOMC as does the AUD as the suspense on the Chinese tariffs continues.
The Daily Edge is authored by Ivan Delgado, 10y Forex Trader veteran & Market Insights Commentator at Global Prime. Feel free to follow Ivan on Twitter & Youtube weekly show. You can also subscribe to the mailing list to receive Ivan’s Daily wrap. The purpose of this content is to provide an assessment of the conditions, taking an in-depth look of market dynamics - fundamentals and technicals - determine daily biases and assist one’s trading decisions.
Let’s get started…
Quick Take
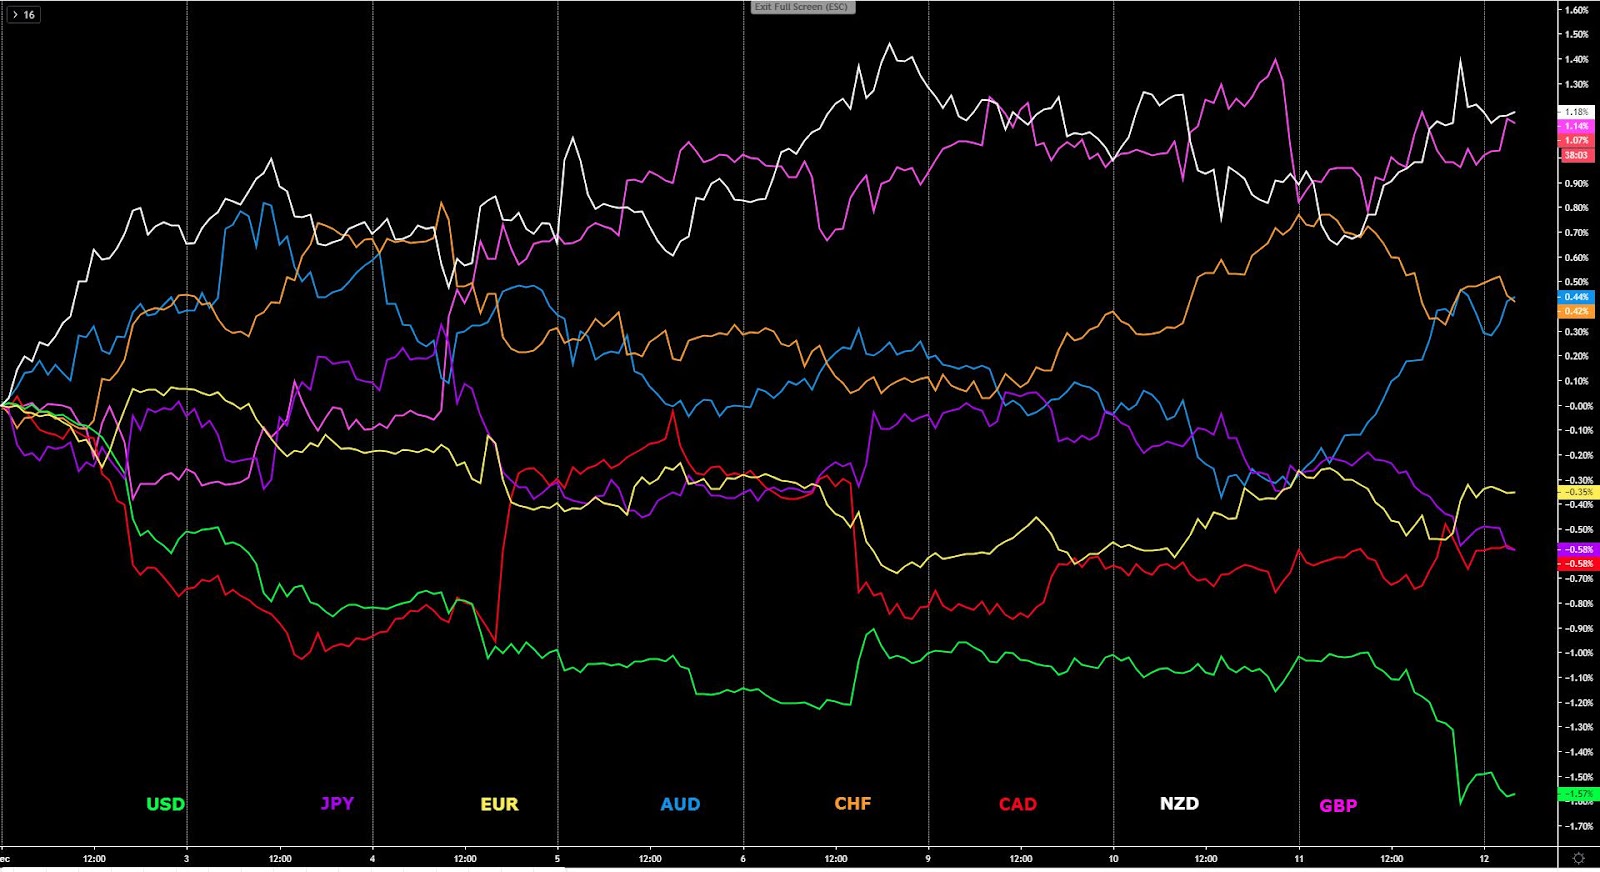
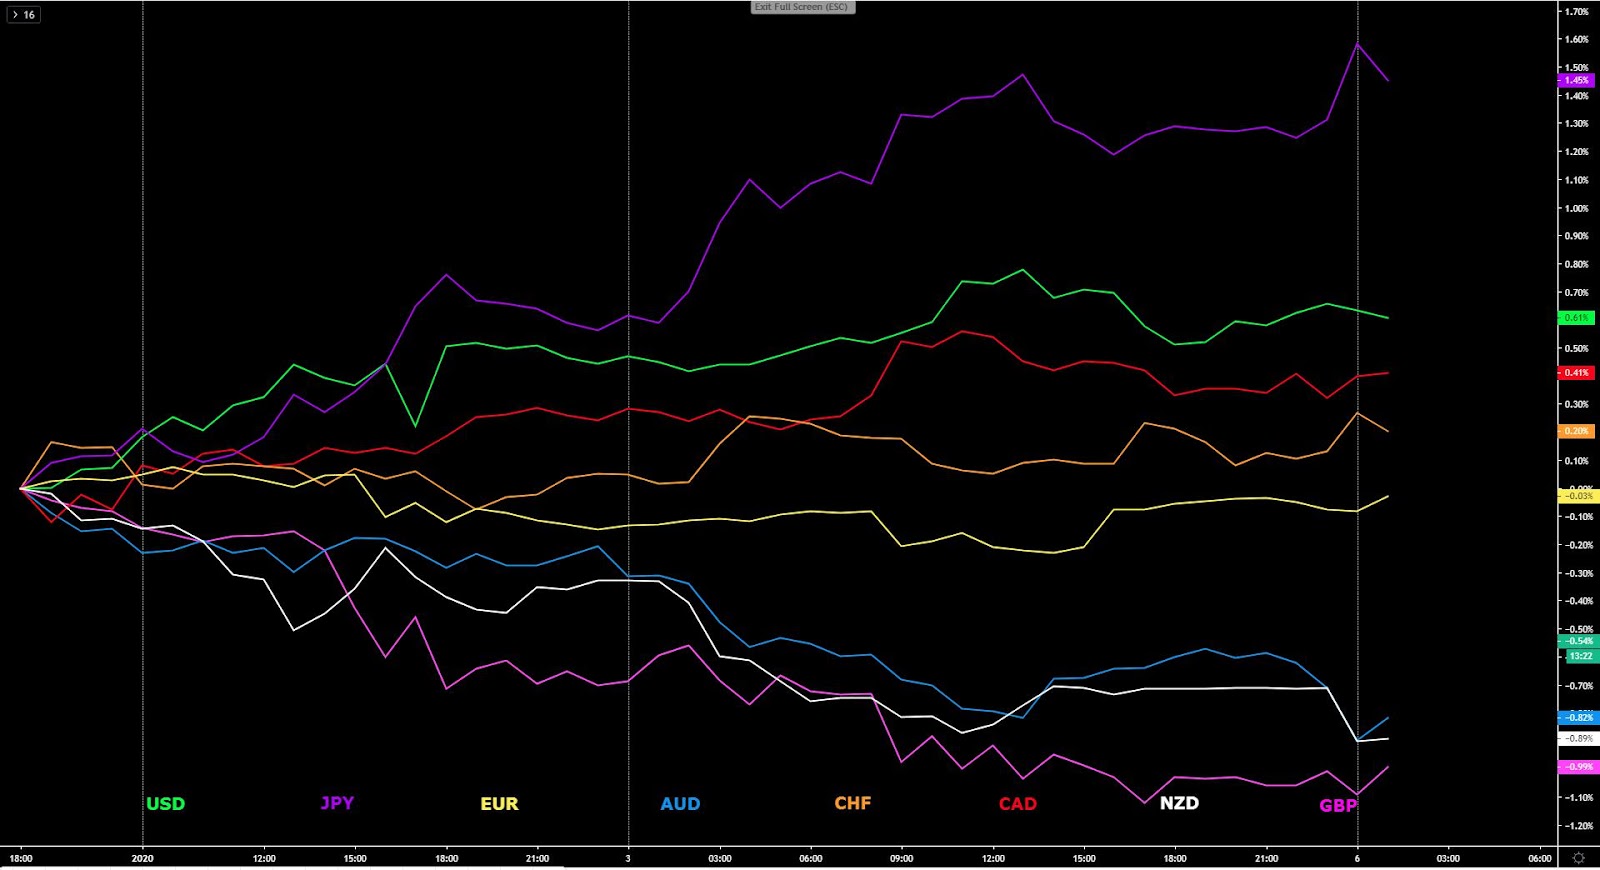
The European currencies were the main winners on Tuesday, with the Swissy leading the pack from the early hours of trading in Asia, only to be followed by a perky Euro as the German data continues to show some very early signs of green shoots in the country. The Sterling remained well supported throughout the day until a moment of reckoning by an overly long market led to a unwinding of positions as the market learned that the benchmark UK Gov MRP model survey came worse than expected for the Conservatives. Their lead is narrowing dangerously, bringing back fears of a hung parliament, even if that is still far from being the base case scenario being priced in by the market. The US Dollar, meanwhile, remains very subdued ahead of today’s FOMC where the market expects very few changes to the statement as the Fed has shifted to a neutral and data dependent stance. It’s worth noting that the USD, as reiterated this week, tends to perform poorly in Dec judging by the collection of historical data in the last 3 decades of price action at this time of the year. The Canadian Dollar was better bid, partly in line with improved technicals, but also getting an extra breather in the way of a new NAFTA deal finally approved by officials. Lastly, the oceanic currencies suffered sell-side pressures since the start of the European session as the market is none the wiser as to whether or not Chinese tariffs will be enacted by Dec 15.
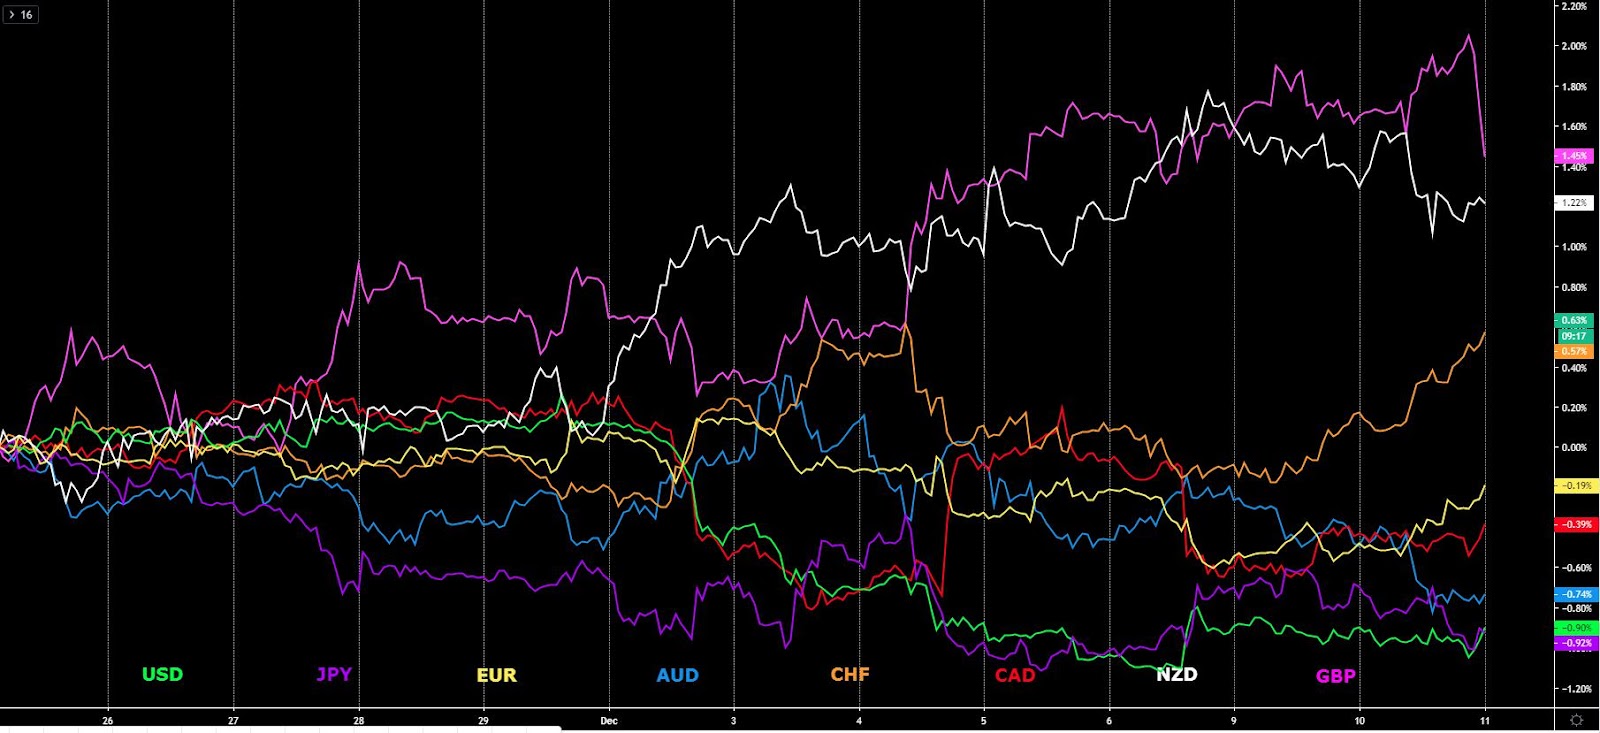
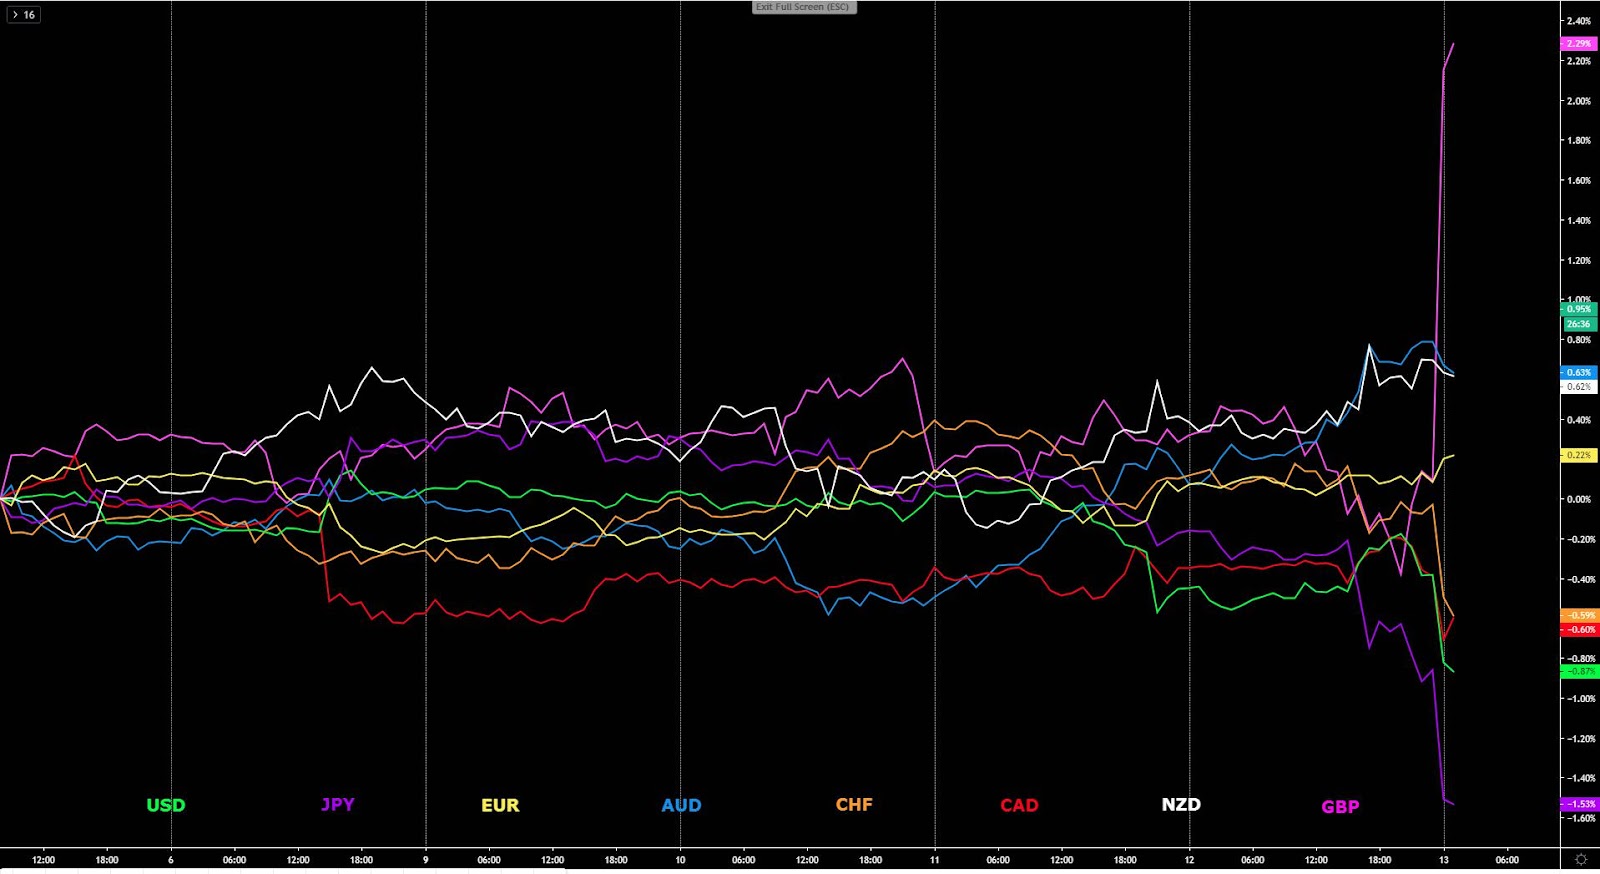
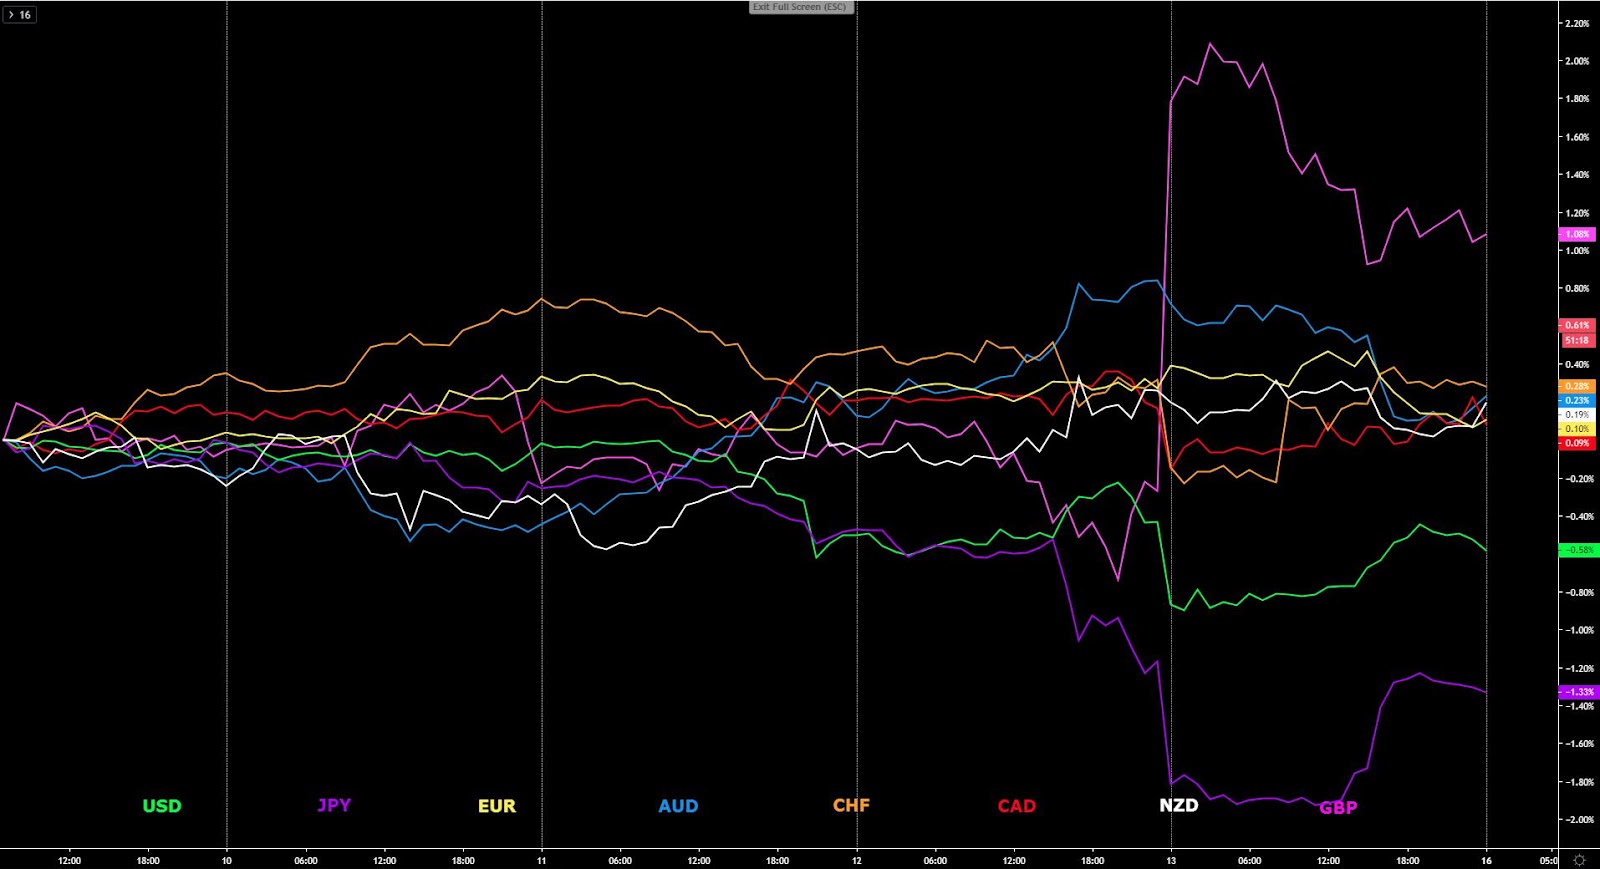
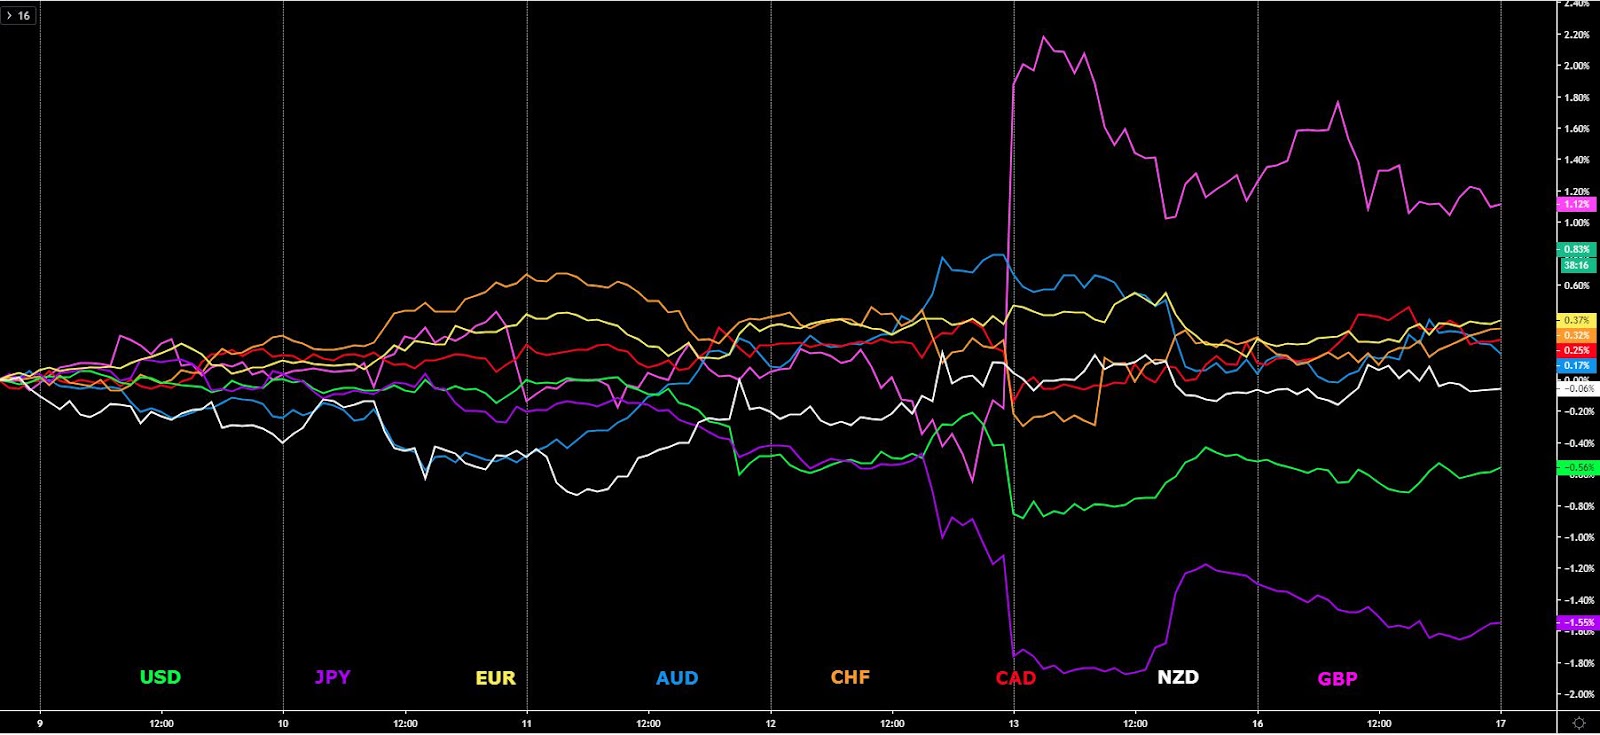
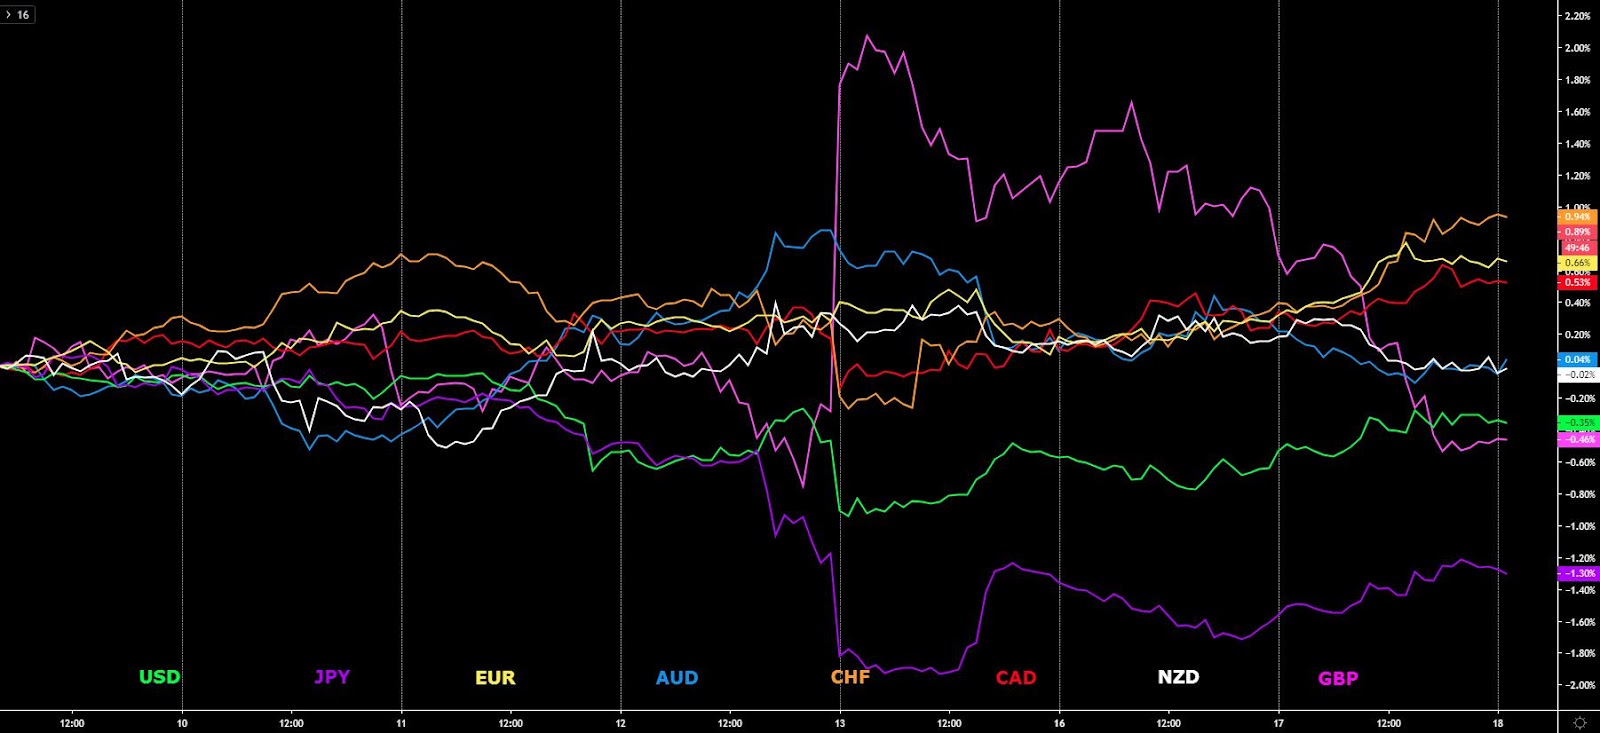
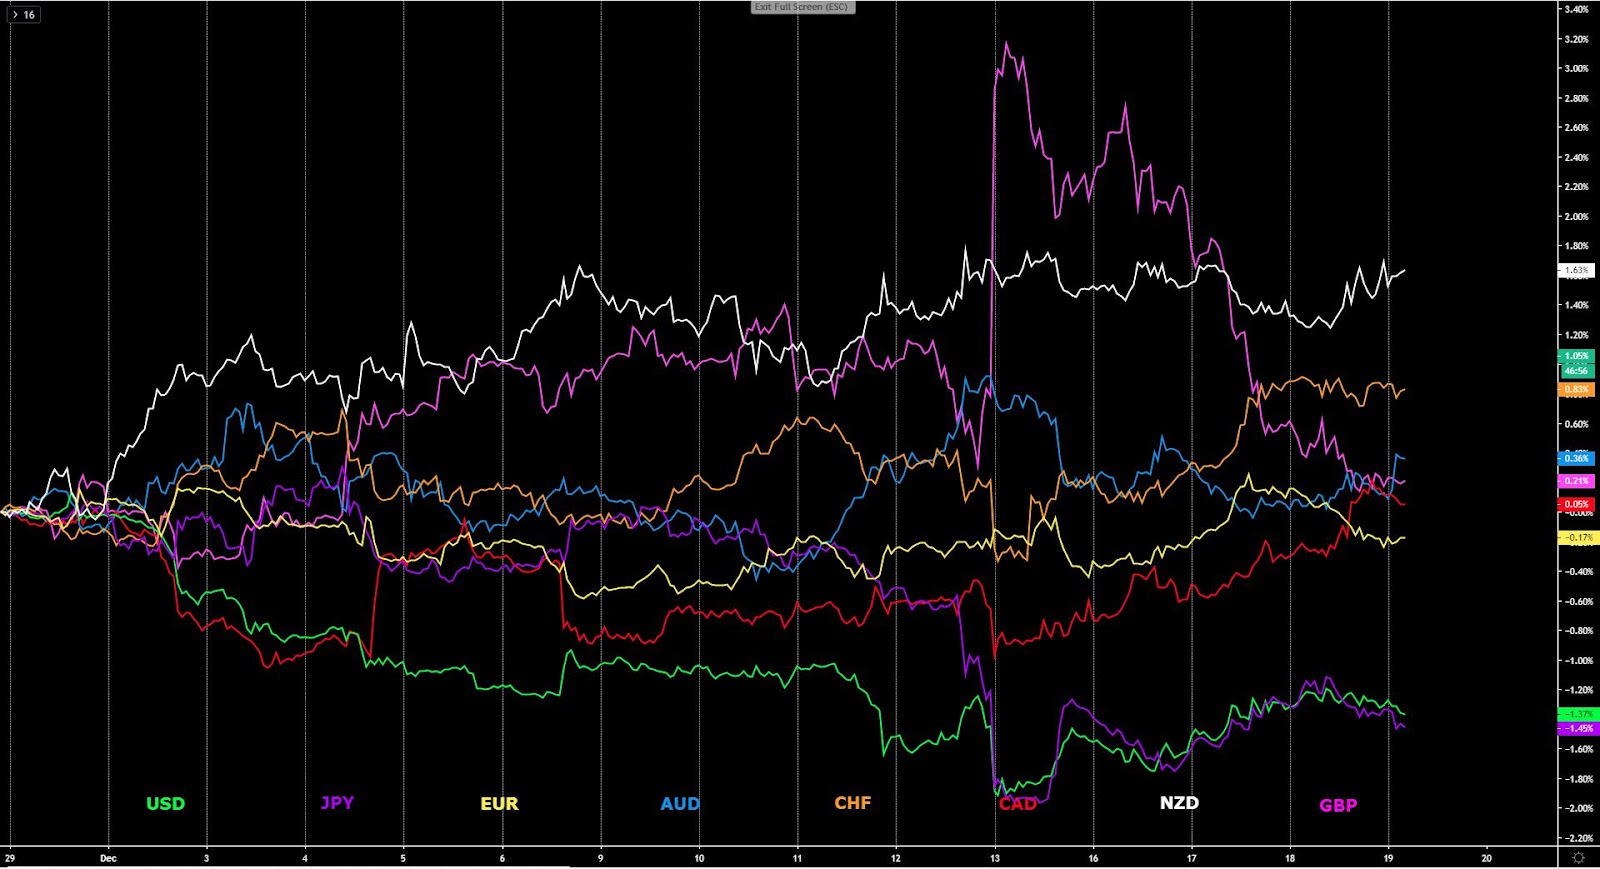
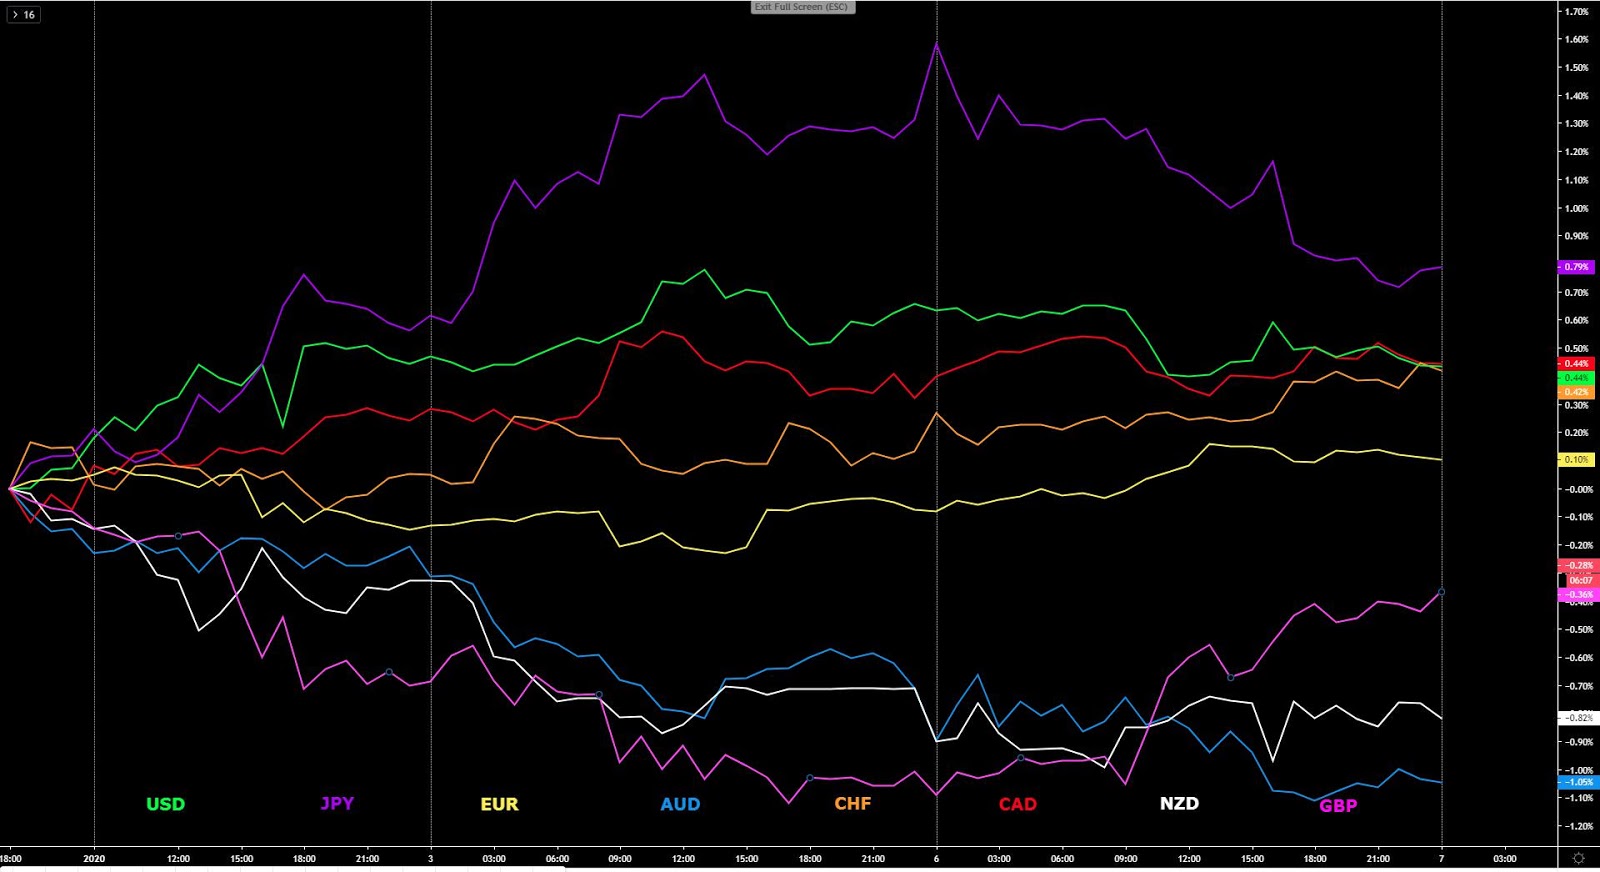
The indices show the performance of a particular currency vs G8 FX. An educational video on how to interpret these indices can be found in the Global Prime's Research section.
Narratives In Financial Markets
* The Information is gathered after scanning top publications including the FT, WSJ, Reuters, Bloomberg, ForexLive, Institutional Bank Research reports.
The green shoots expand to Germany: The German Dec ZEW current situation and economic sentiment kept improving, cementing the tendency of green shoots we are seeing in other corners of the world. The expectations/outlook reading came to its highest level since February 2018. ZEW said that projections for a pick up in German exports and private consumption played a key role as the German foreign trade surplus and the labour market stabilize.
China’s fundamentals keep painting a rosier picture: China’s November credit and money supply data also strengthened the groovy vibes about a global recovery as the broad Aggregate Financing measure rose by ¥1,750bn, way above exp. , which when added to the positive developments in the country's PMIs, it shows the country might be on the cusp of turning a corner, and that keeps the global recovery thematic going.
Divergence in data a trend to keep an eye on: The rebound in the German and Chinese data plays into the view of the remarks made by the research team at Morgan Stanley about emerging divergences in data trends, which should lead to higher volatility ahead as long as these trends are continuing to diverge. “Divergence is a recipe for vol, and we are starting to see signs of the data trends diverging. Global data continue to show signs of stabilization. More than half of global manufacturing PMIs ticked up in Nov, including in China where both manuf PMIs rebounded. Trade activity is also showing signs of bottoming while global credit growth is rising at the fastest pace in three years.”
Officials expect a delay in the Chinese tariffs deadline: According to a report by the WSJ, US and Chinese trade negotiators plan for a delay of the December tariff, citing officials on both sides. The report notes: “Officials have signaled that Sunday is not the final date for reaching a so-called phase-one deal ... Chinese and U.S. officials involved in the talks say they don't have a hard deadline. President Trump, however, hasn't yet made his decision, and he has overridden his advisers on trade several times to add tariffs.” Based on the market behavior, the market is expecting some type of delay to be given.
US-China officials aim for tariffs delay, will Trump agree? A report by Bloomberg notes that Beijing sees a delay of the Dec 15 tariffs along with both sides reducing existing tariffs, even if ambiguity on Trump's side remains. The article details “Chinese officials expect the U.S. will delay a threatened tariff increase set for Sunday as both sides focus on de-escalating tensions by cutting import taxes currently in place rather than removing specific products from the target list, according to people familiar with the matter.”
New NAFTA deal: Officials have finally come to agree in signing a revised NAFTA agreement. CTV news notes: “The agreement on the updated deal was reached between Canada, the U.S, and Mexico, and comes after U.S. Democrats secured adjustments to the deal that was first struck a year ago. This paves the way for the new United States-Canada-Mexico Agreement to finally be ratified.” Senate majority leader Mitch McConnell said that the Senate won’t finish USMCA this year. The Canadian Dollar was barely altered in its value as the focus is in the US-China tariffs.
GBP sold as Conservative lead shrinks: GBP saw an aggressive mark-down between NY and Tokyo as the UK election race is narrowing, according to the latest YouGov UK election poll. This survey is by far the one followed most closely by the market as the model it uses predicted the loss of majority by Theresa May back in 2017, hence the market has assumed this is the main gauge for the Dec 12 outcome. The results show Conservatives losing ground at 339 (-20) against Labour 231 (+20). Remember, earlier polls had projected a much larger majority for Johnson. What this means is that the risk of a hung parliament should not be disregarded, hence the adjustment lower in GBP.
AUD the main laggard in FX: The AUD continues to exhibit weakness following a stabilization in the NAB business survey, which showed confidence and conditions below average levels with a marginal decrease in the confidence measure. We also saw RBA’s Governor Lowe intervene in a Q&A post speech on payments, saying that “The surprise in the GDP data was weakness in consumption growth, given extra income from tax cuts. I’m still confident, given extra time, people will spend extra income. It’s quite possible that spending takes a little longer…in the current environment there’s a high level of debt, and households are paying down debt first. Says weakness of Q3 consumption ‘does not have any particular message for the future.”
FOMC next risk event: The FOMC is scheduled to release its latest decision on monetary policy. The market is not expecting major changes in language. As the economics team at Danske Bank notes: “Following three cuts in a row, we expect the Fed to remain on hold. FOMC members have made it clear that they think the ‘current stance of monetary policy is appropriate’ and that they now want to wait some time and see how things play out before acting again. At the latest meeting in October, the Fed surprised us by removing its easing bias and, as the data has not really painted a different picture, it is difficult to see why FOMC members should change their minds (if anything the strong jobs reports in recent months should calm fears despite subdued ISM/PMI indices). Hence, we do not expect major changes to the statement.”
If you found this fundamental summary helpful, just click here to share it!
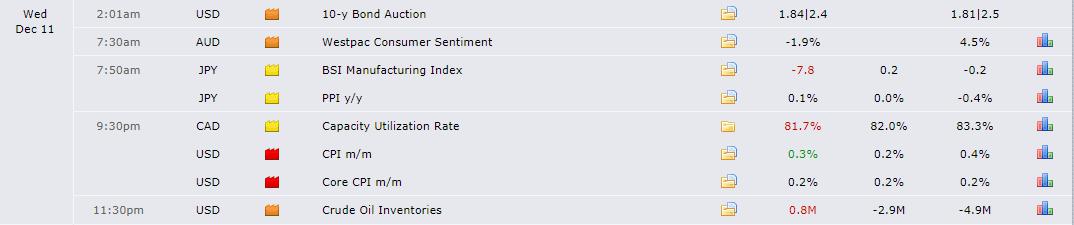
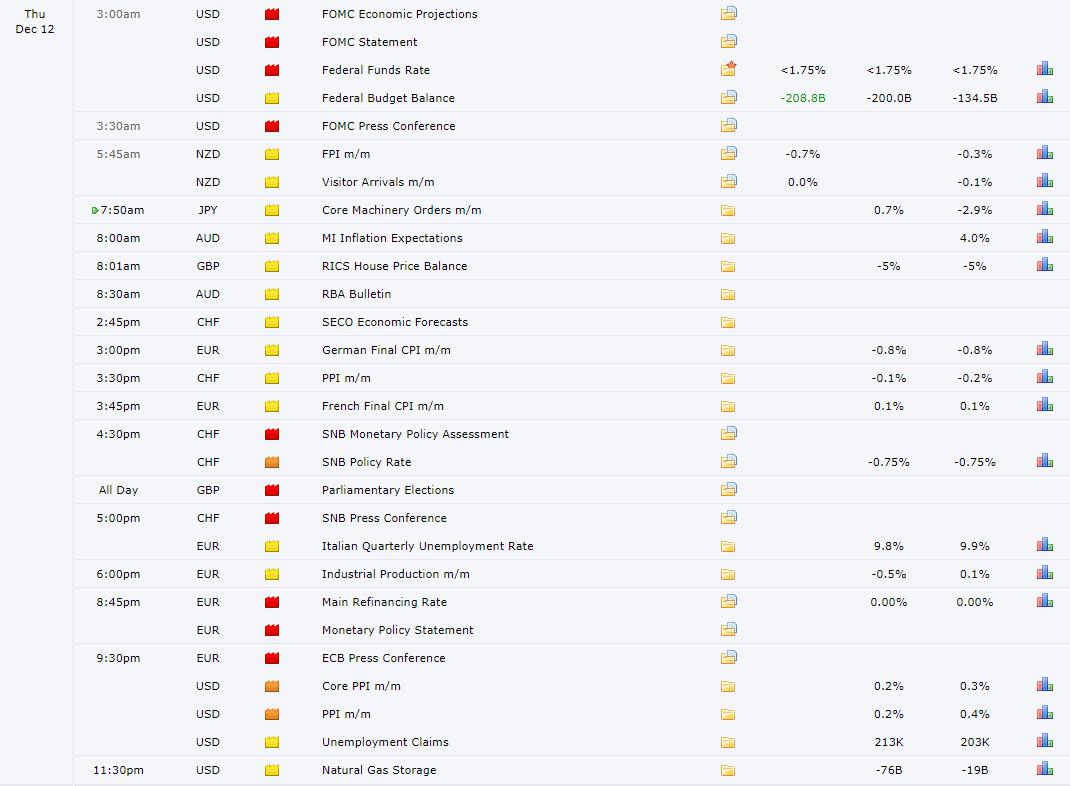
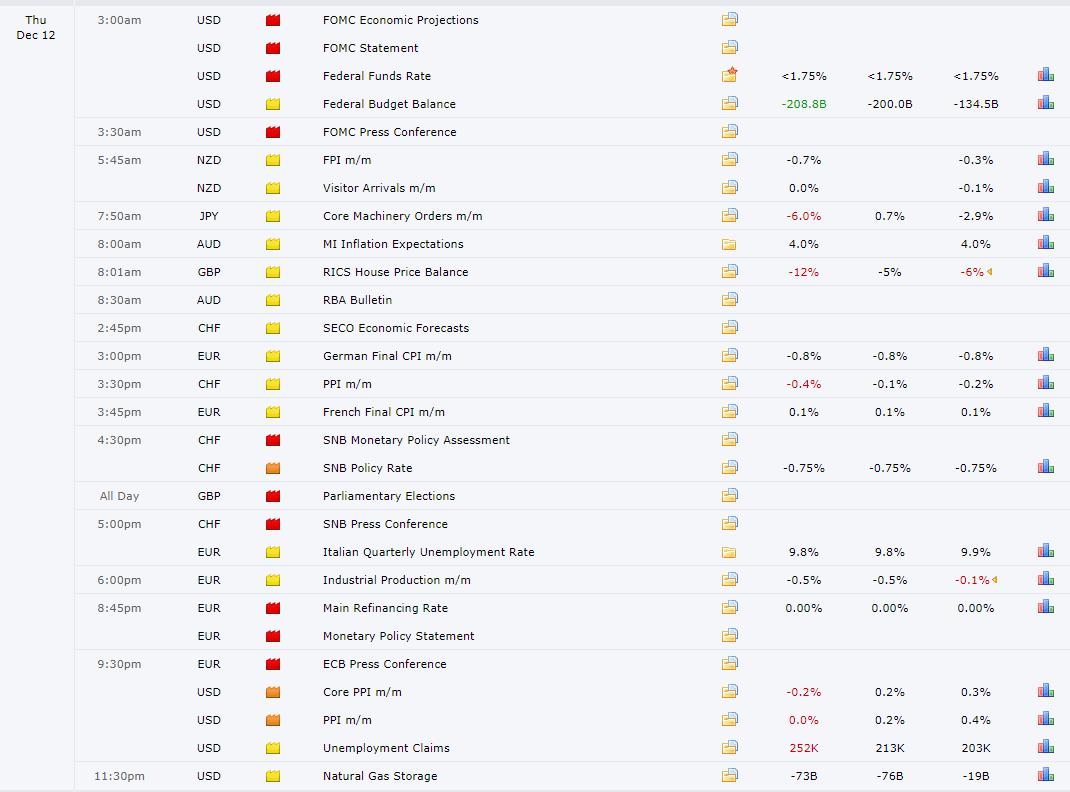
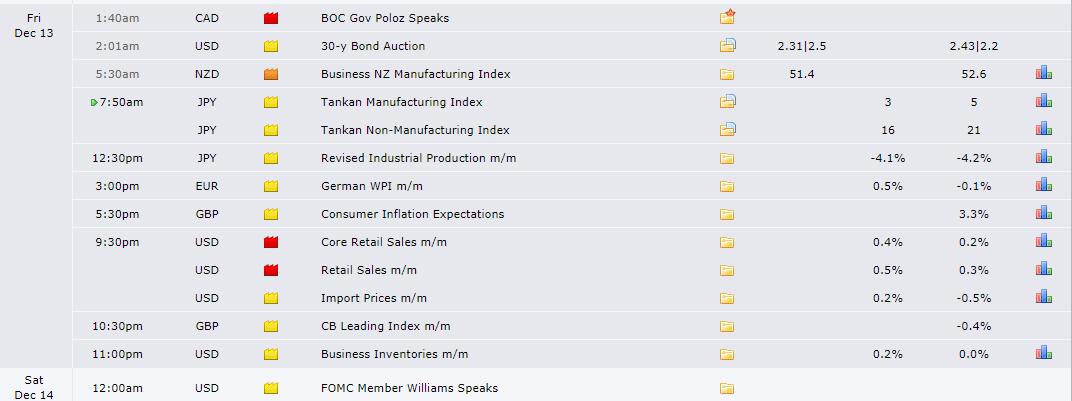
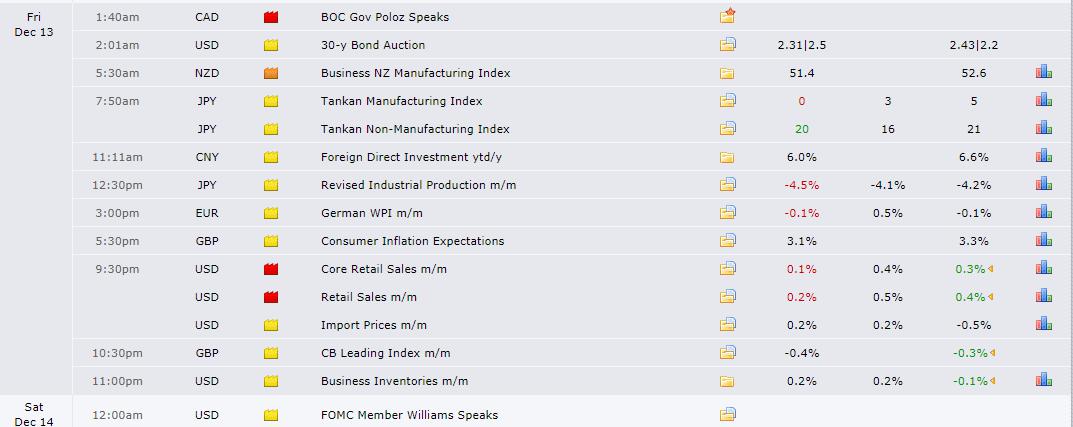
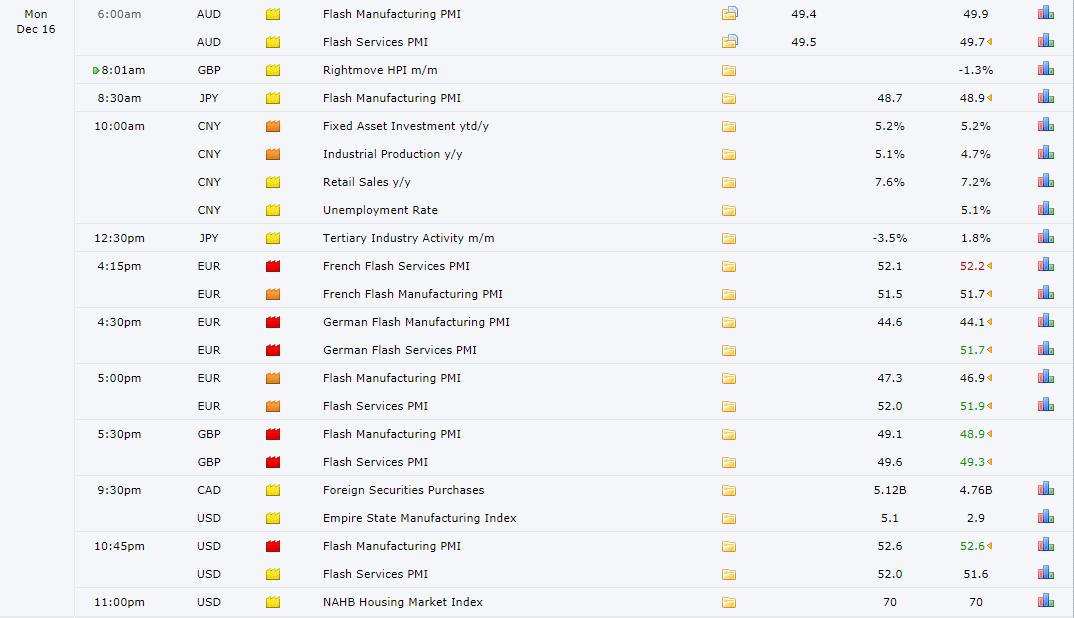
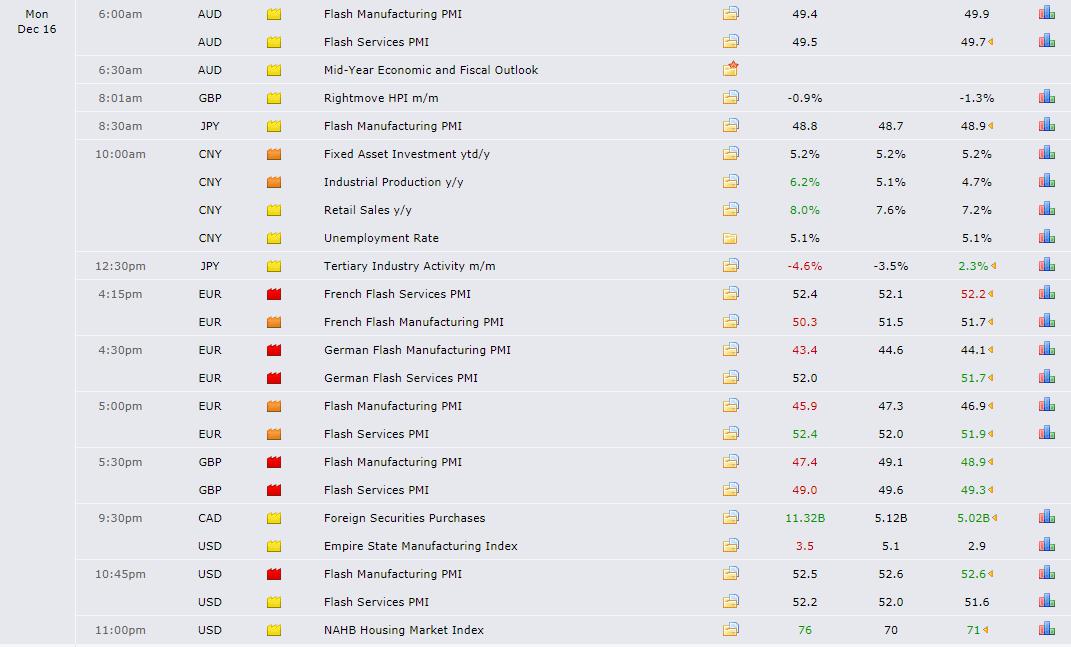
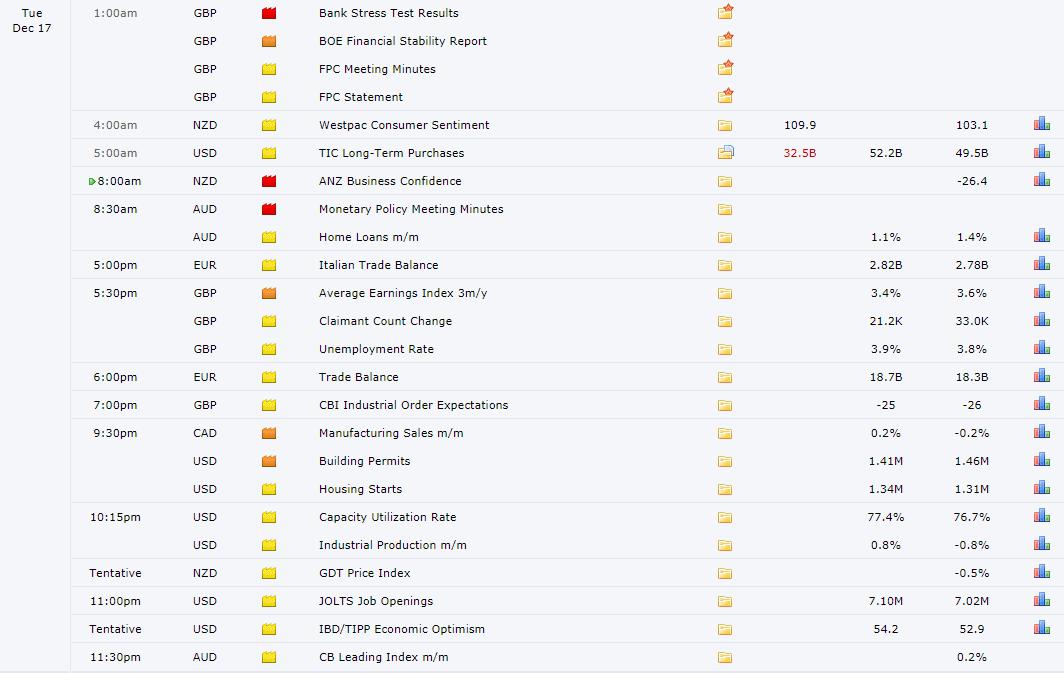
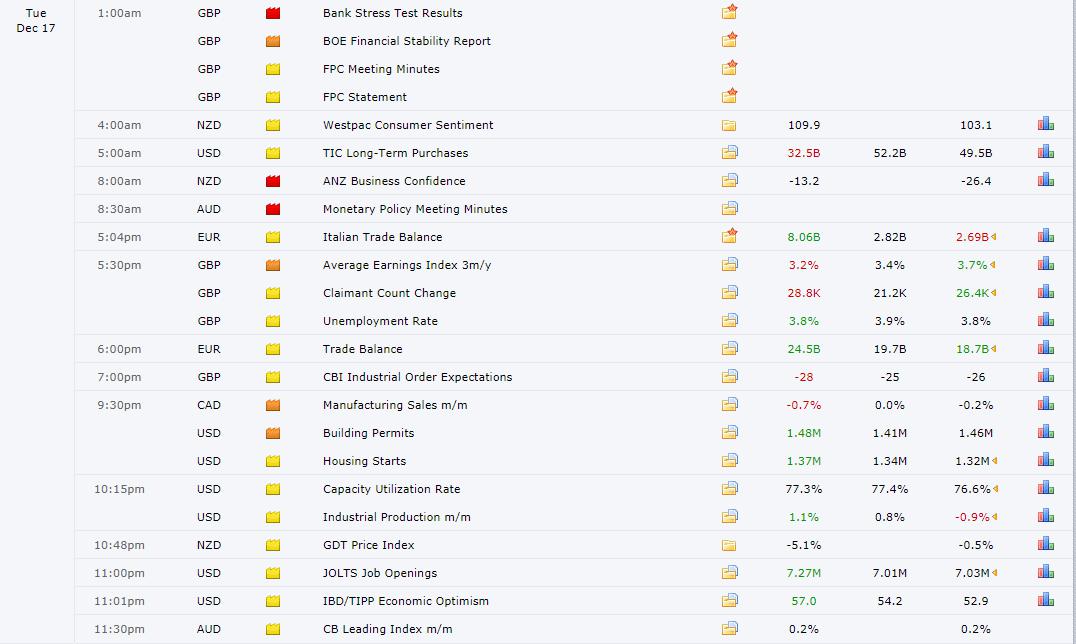
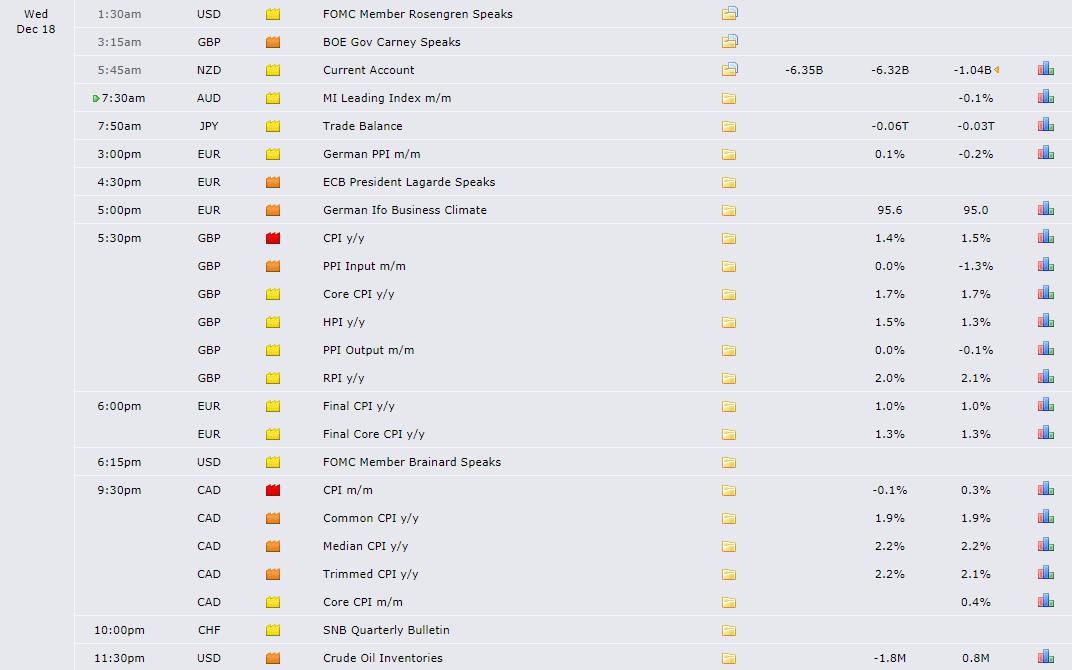
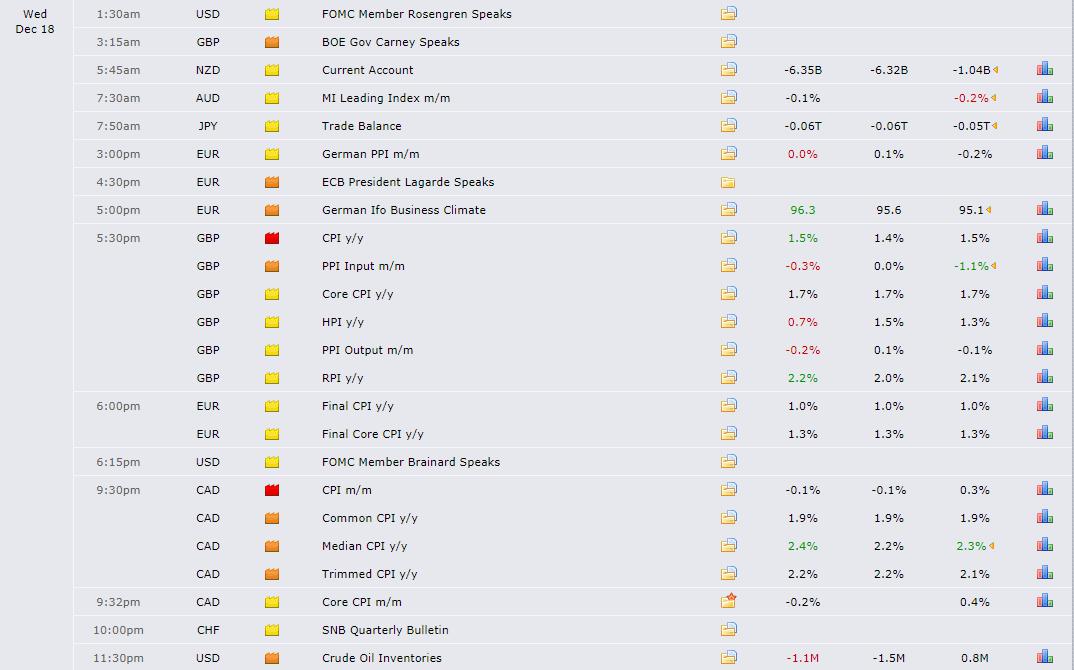
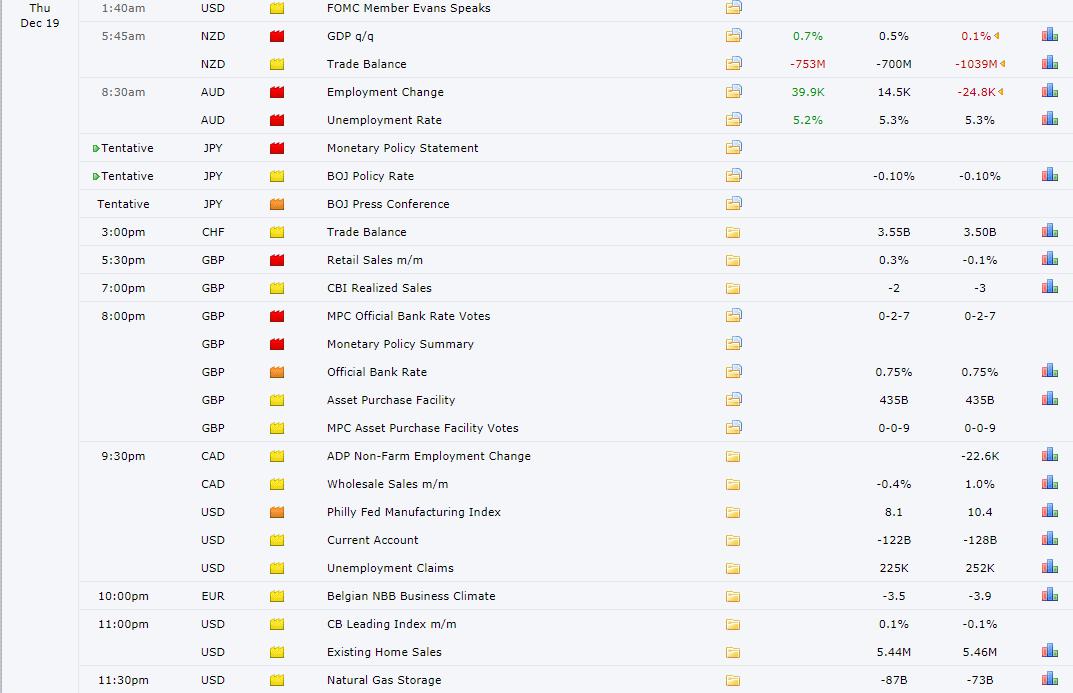
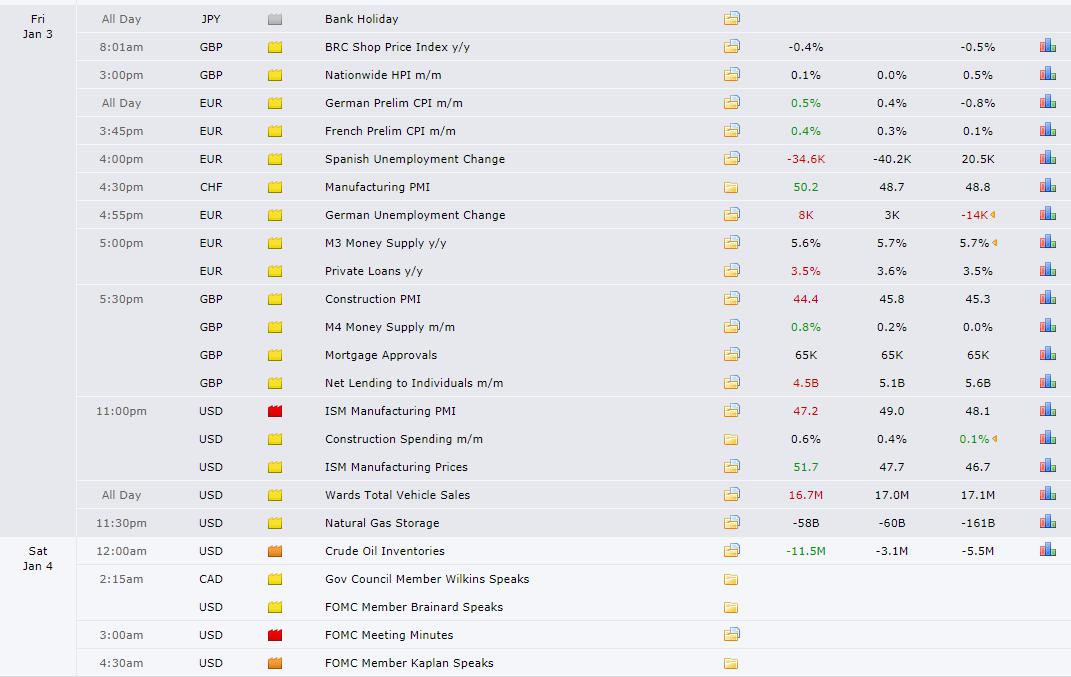
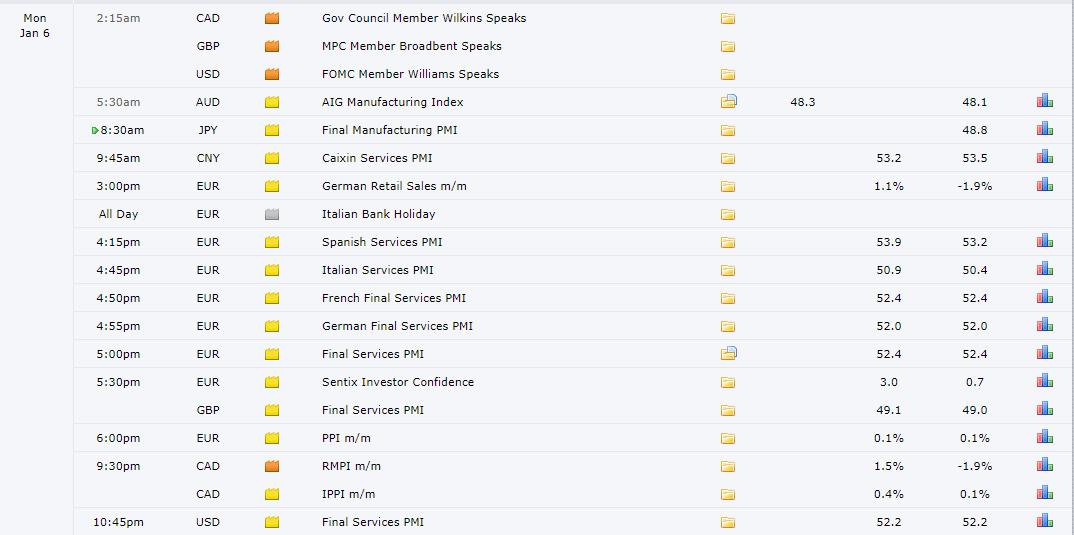
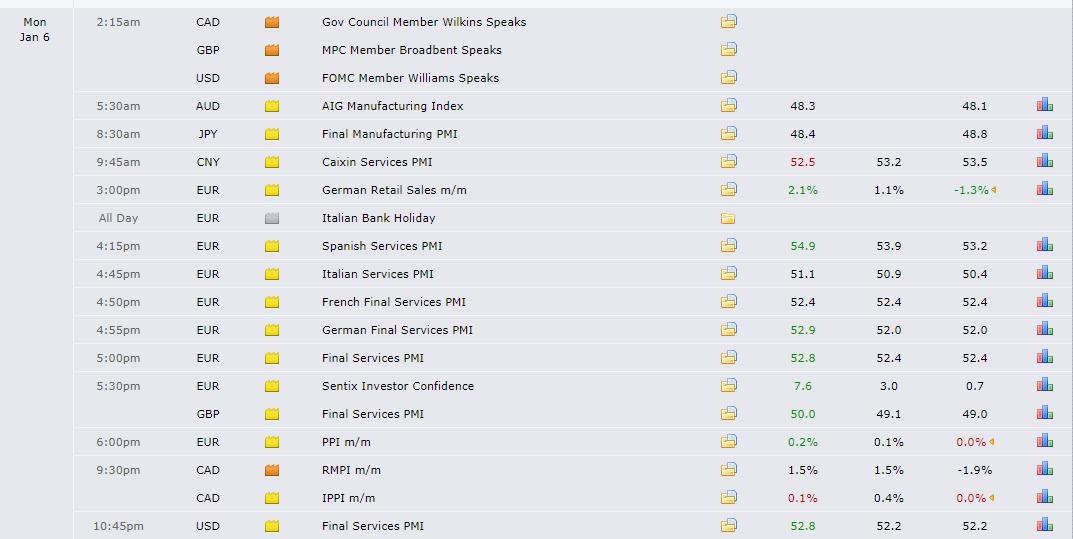
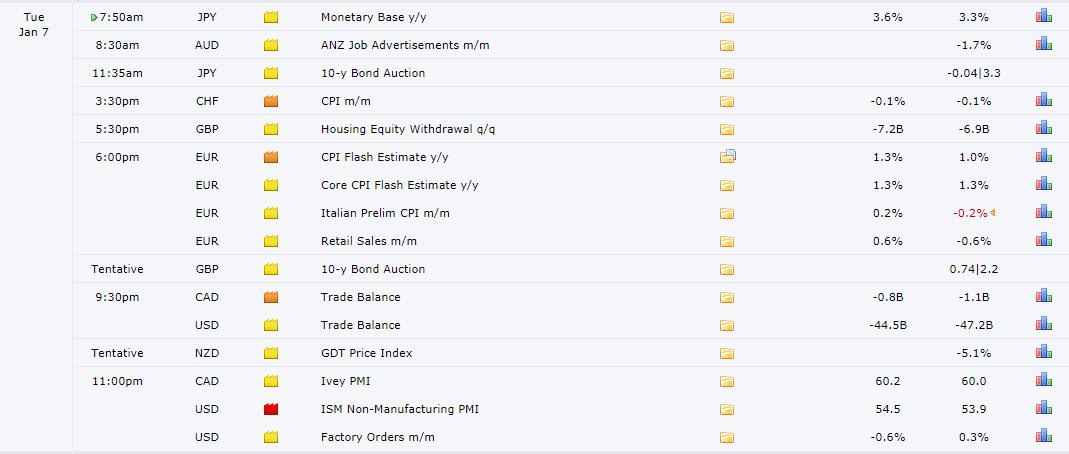
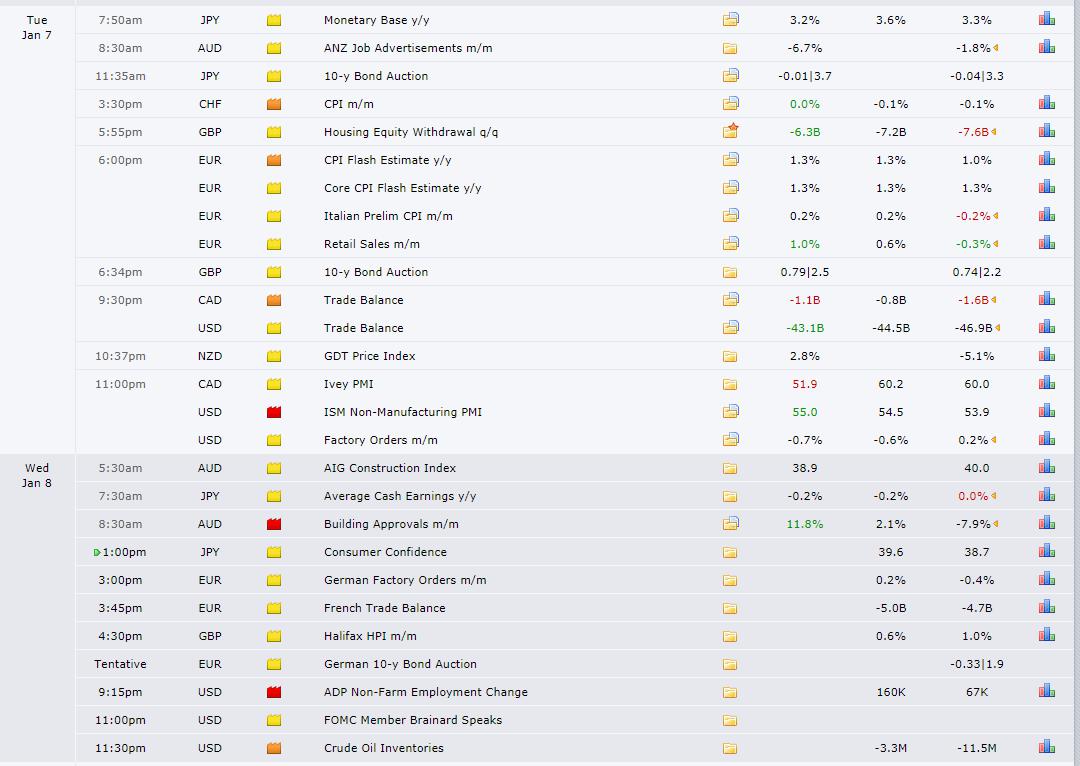
Recent Economic Indicators & Events Ahead
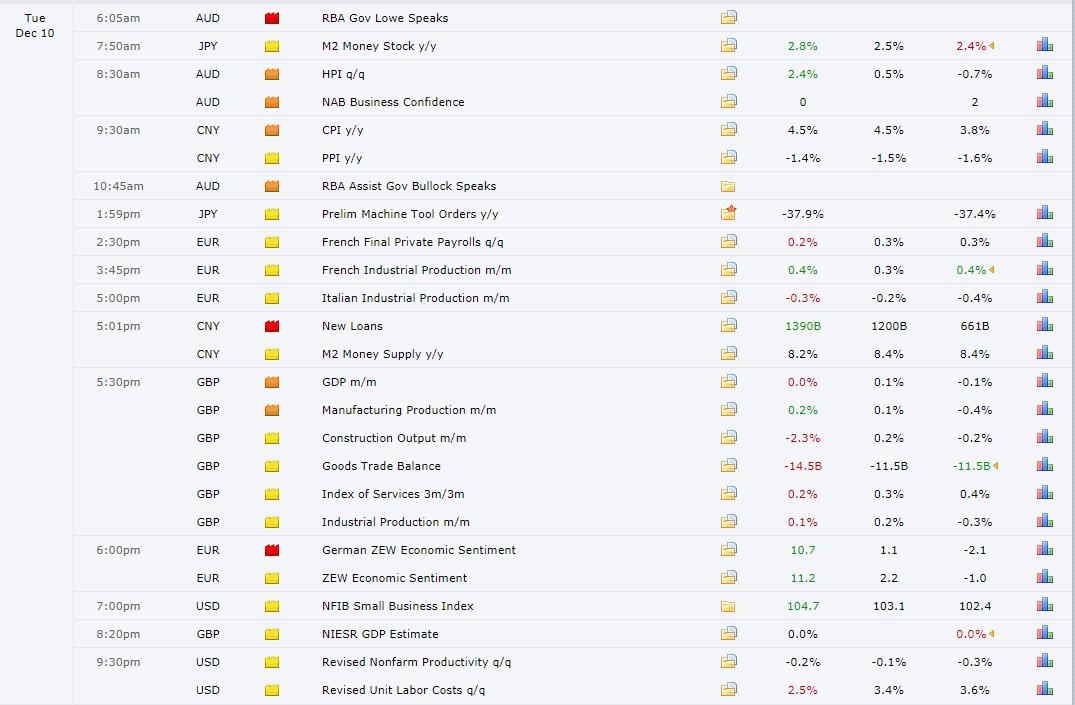
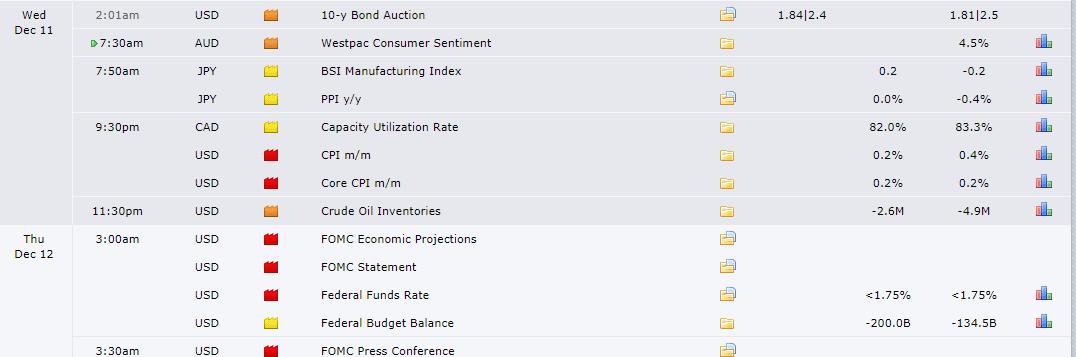
Source: Forexfactory
Professional Insights Into FX Charts
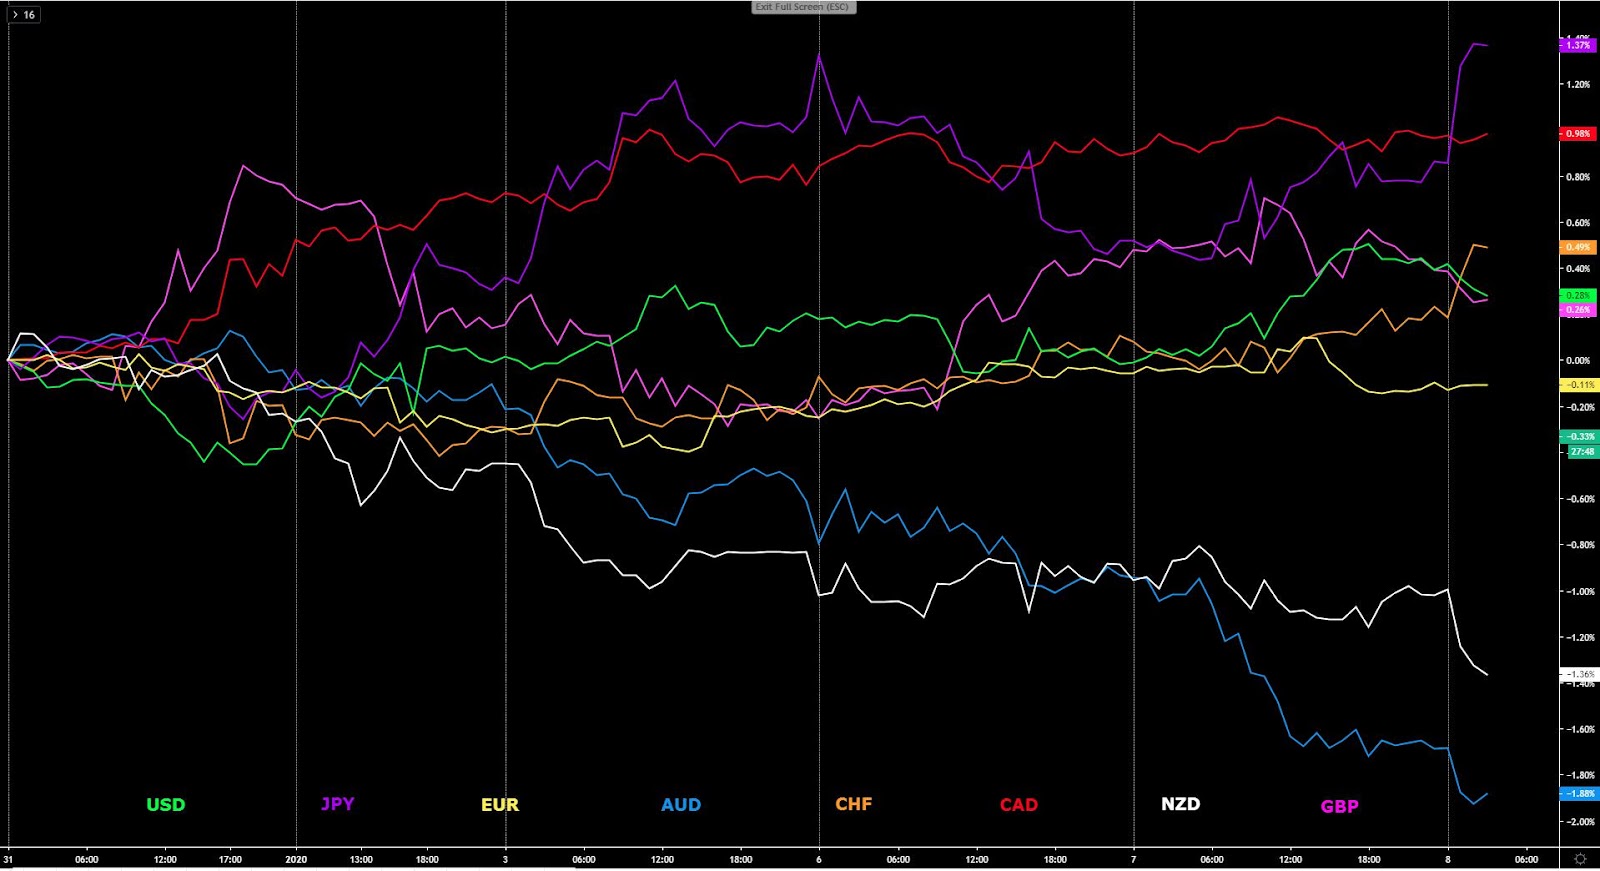
The indices show the performance of a particular currency vs G8 FX. An educational video on how to interpret these indices can be found in the Global Prime's Research section.
If you found the content in this section valuable, give us a share by just clicking here!
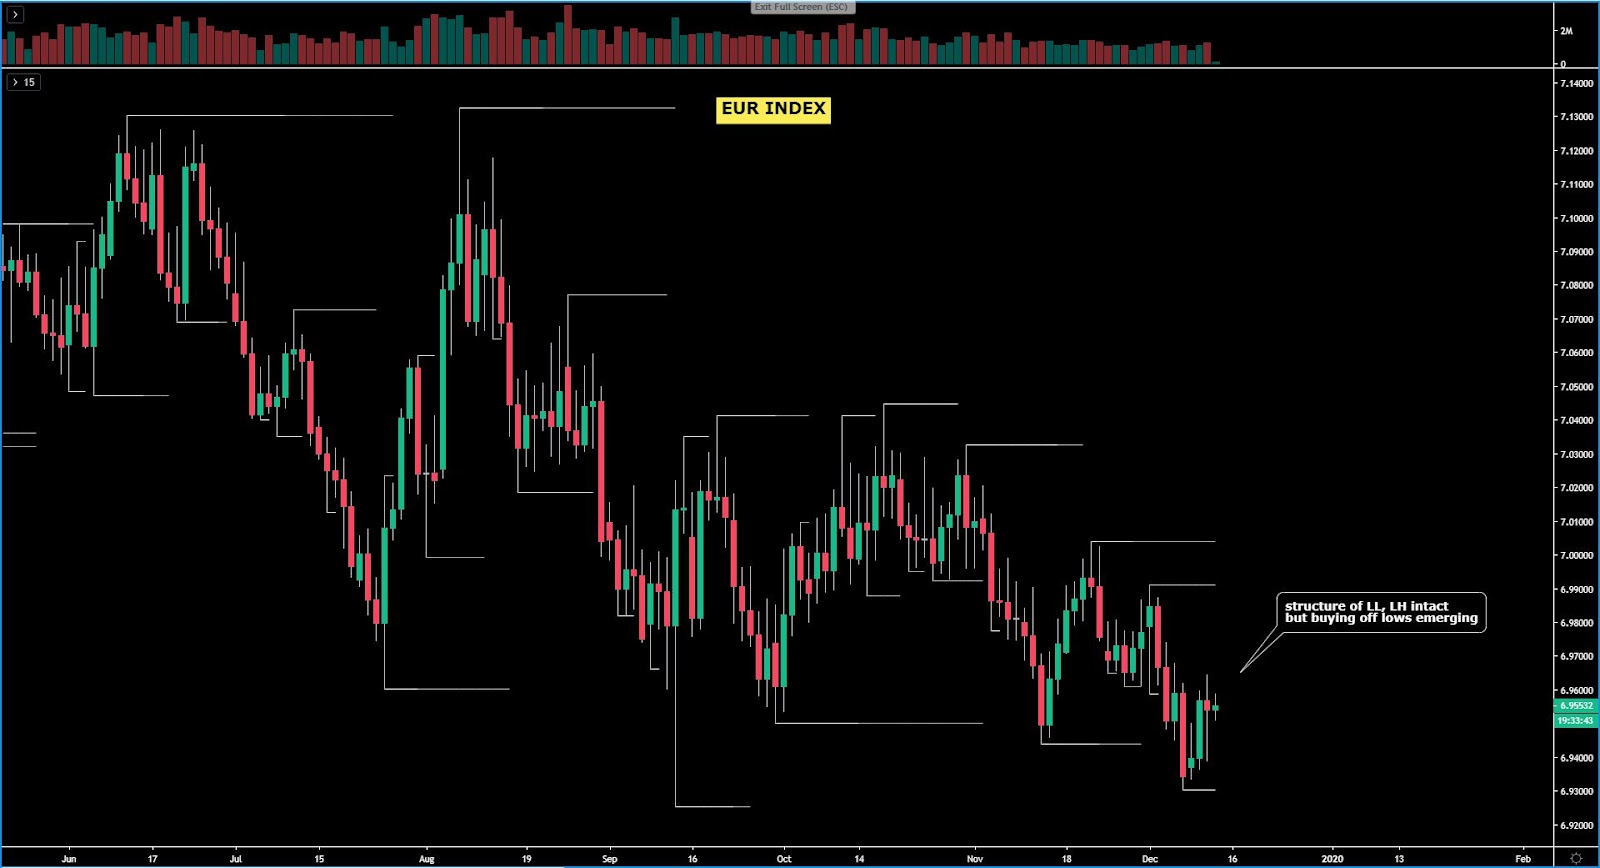
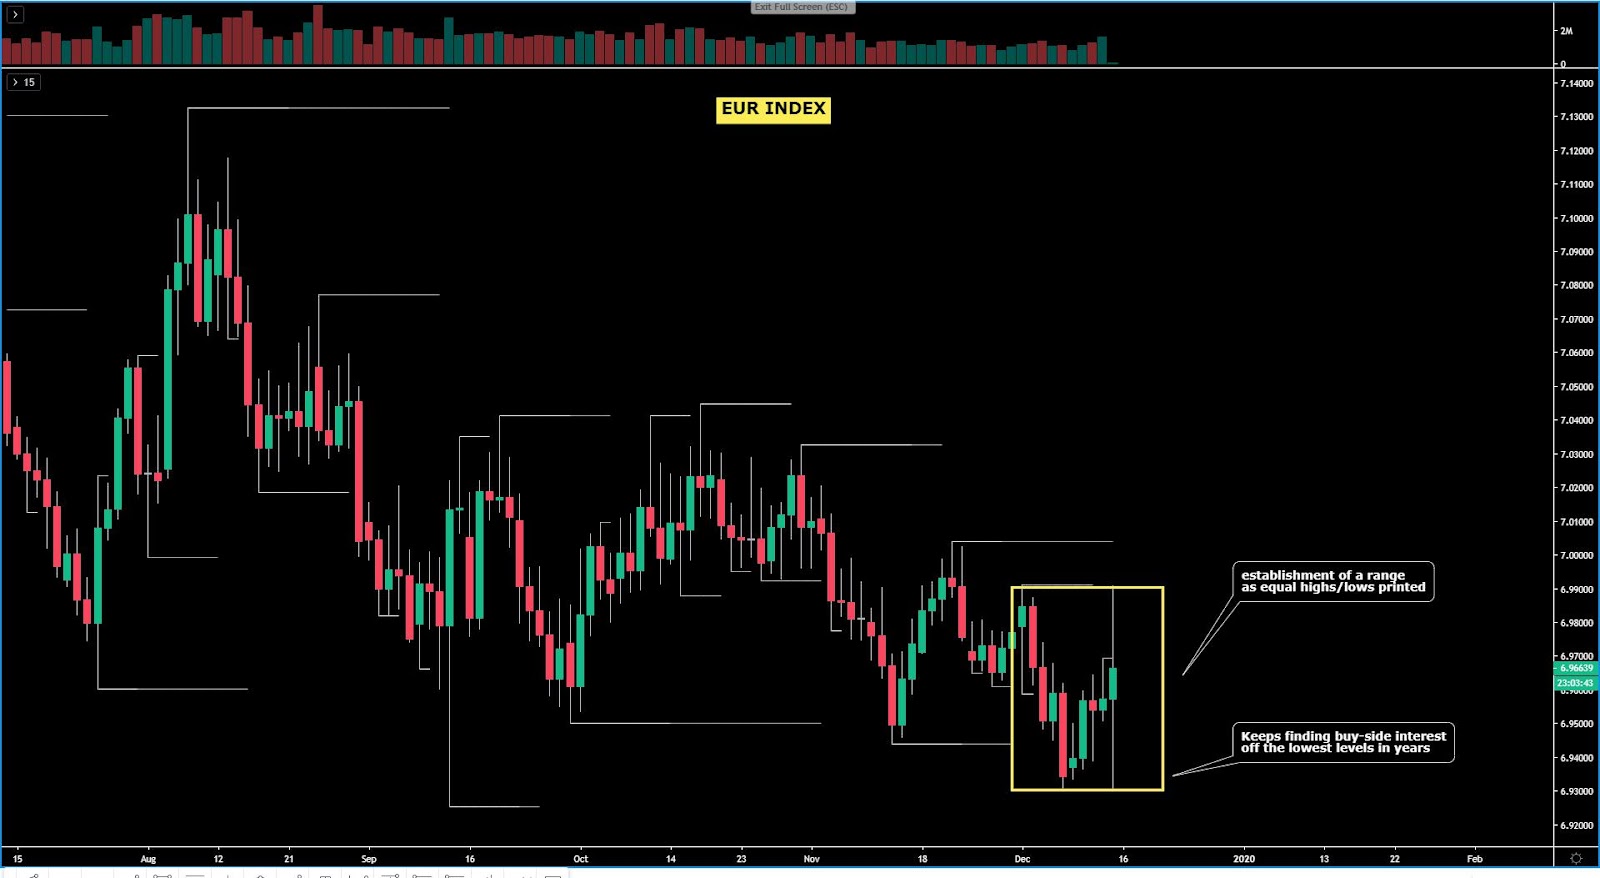
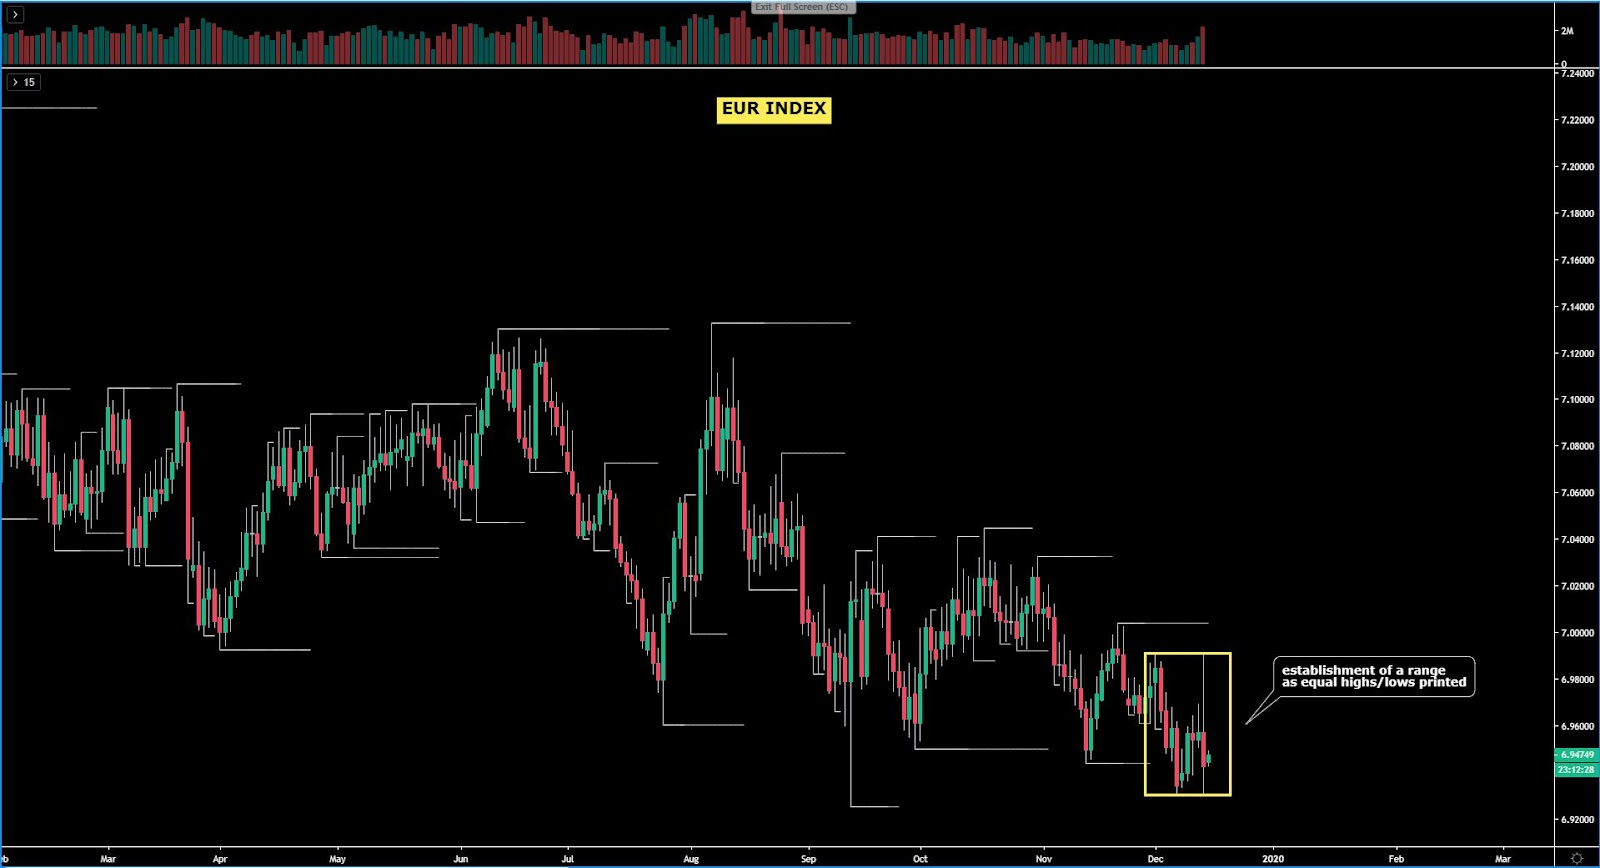
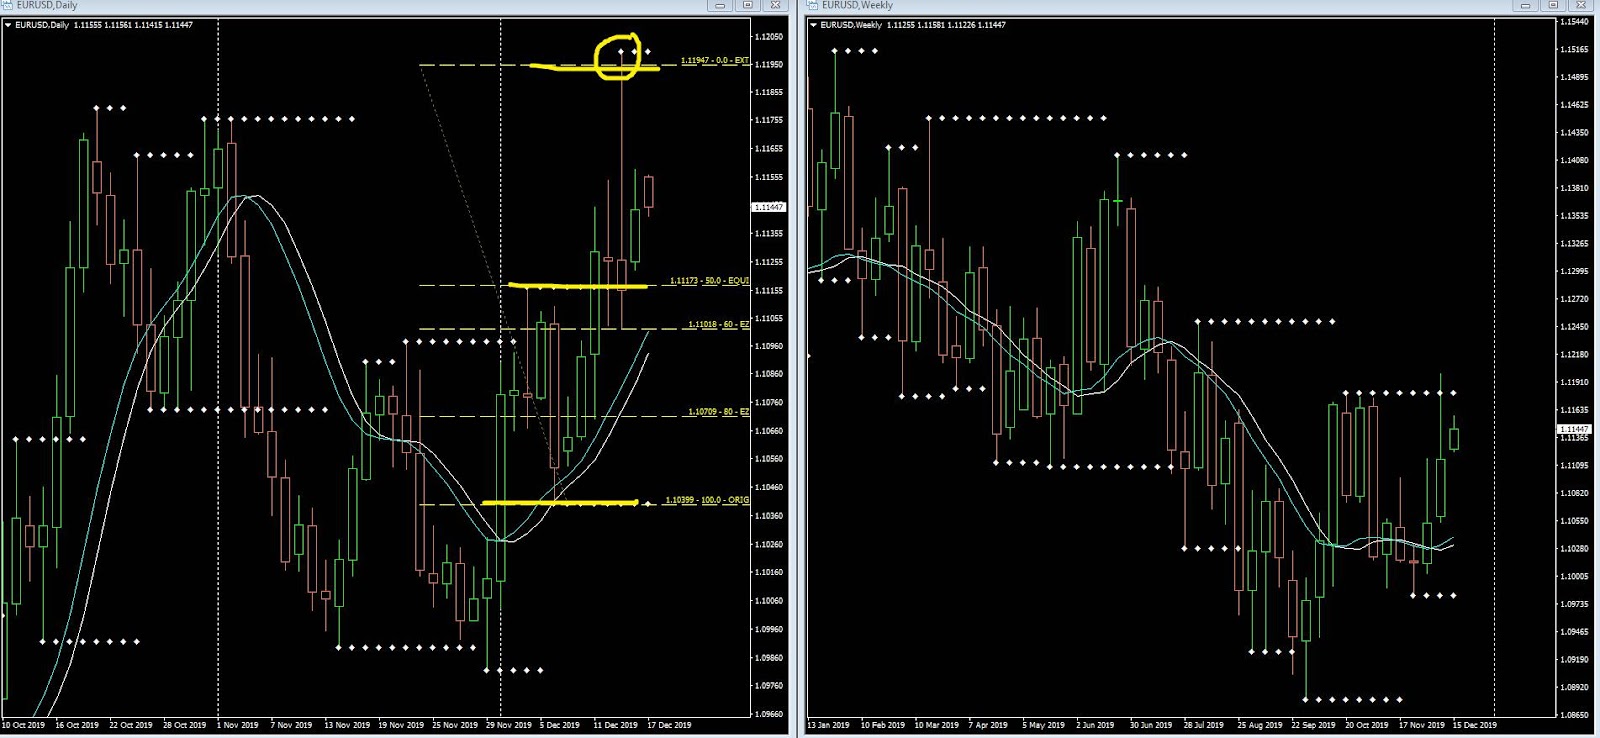
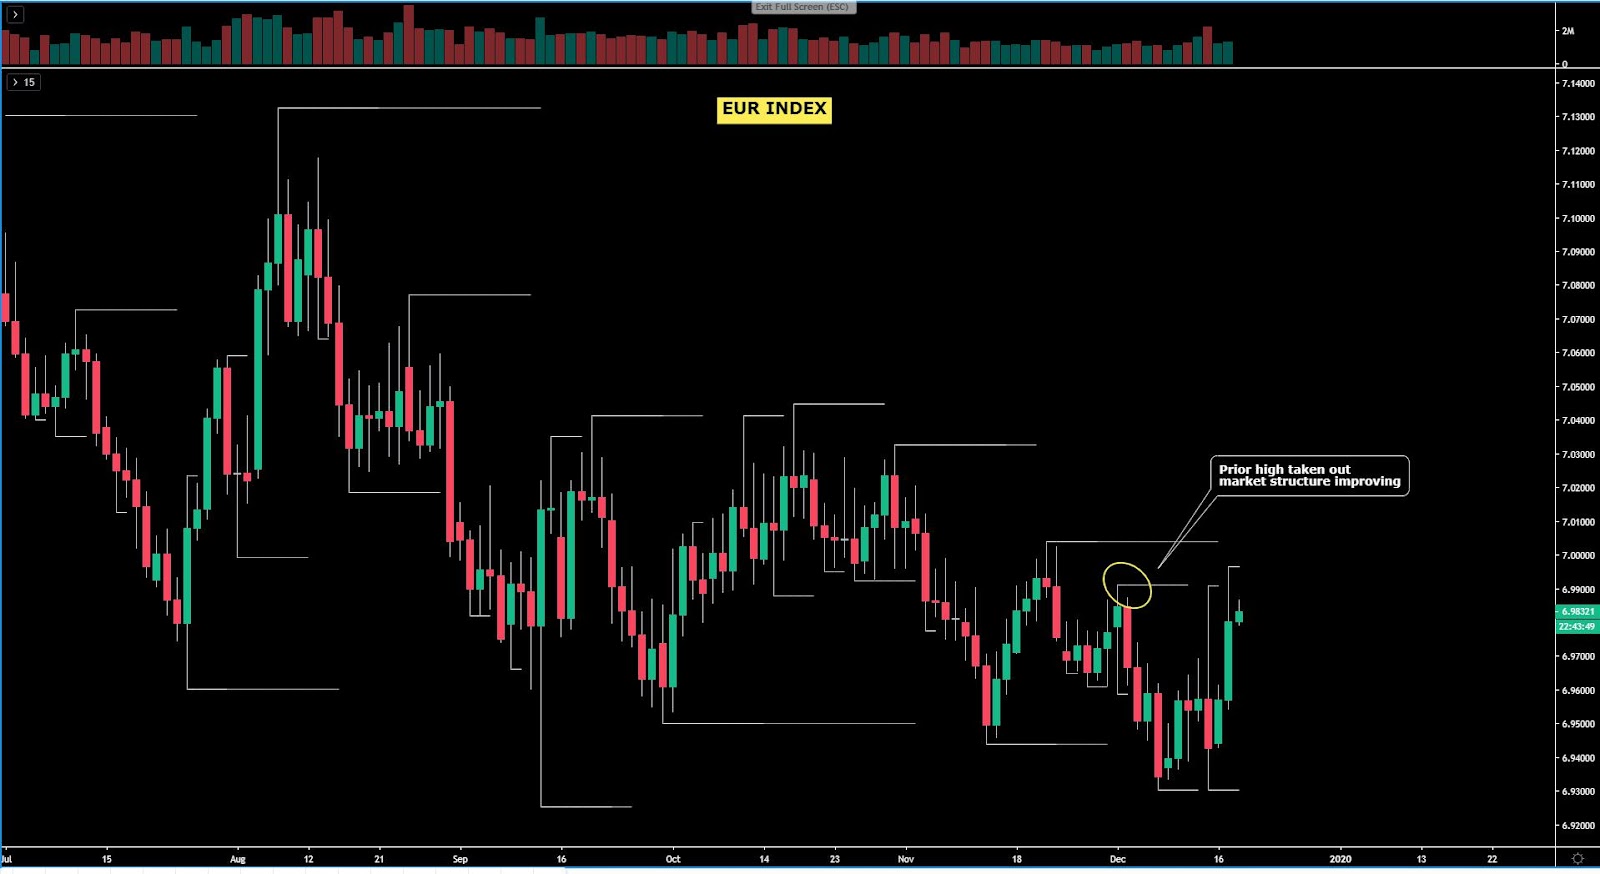
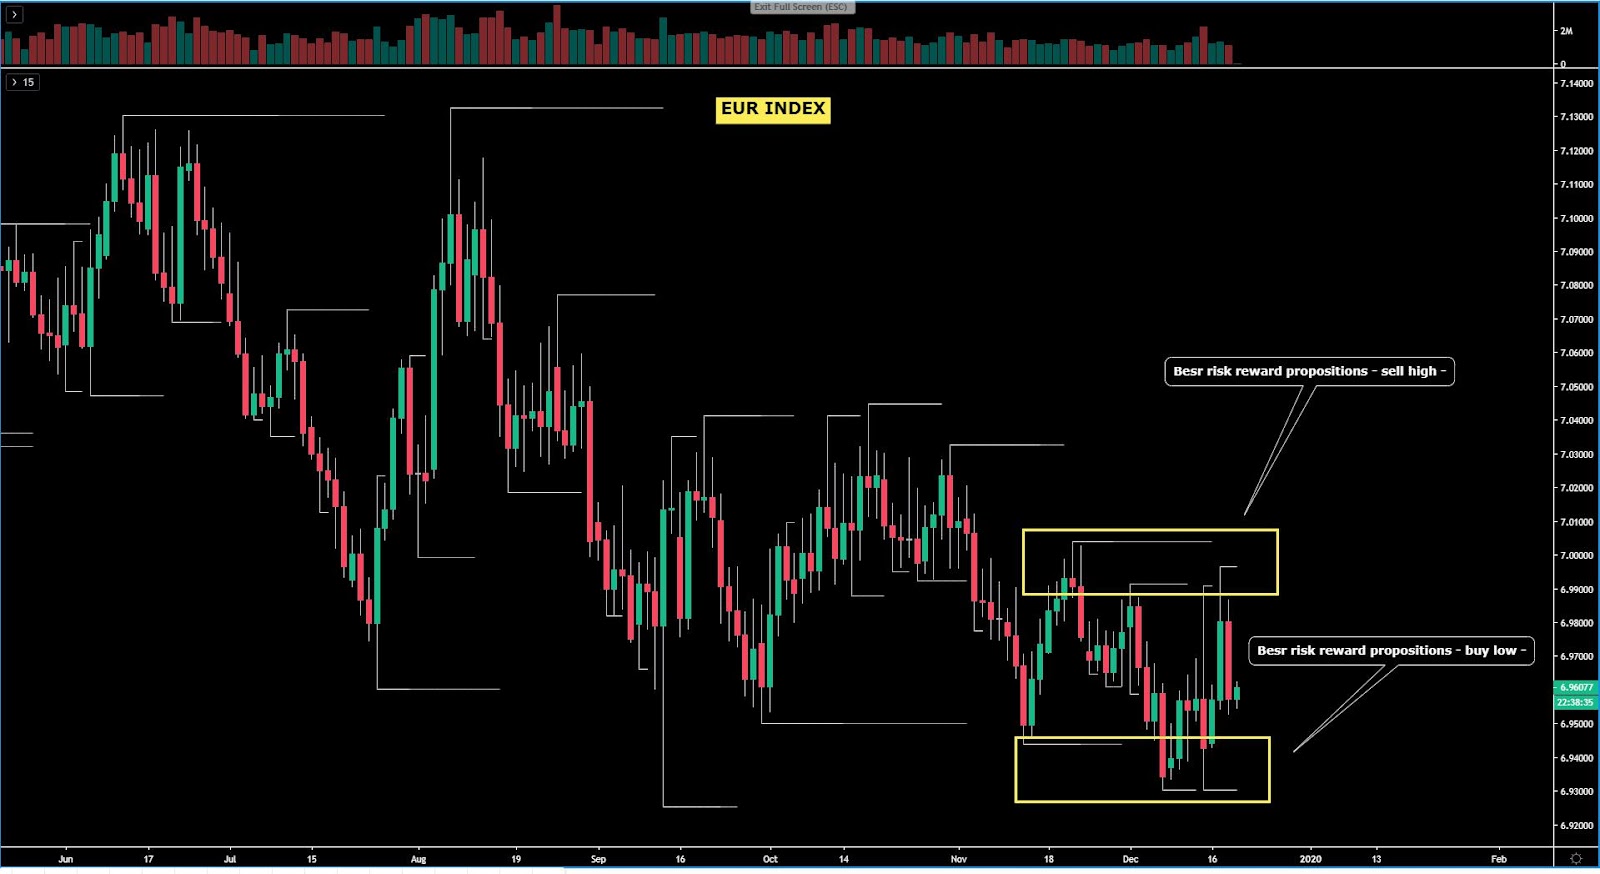
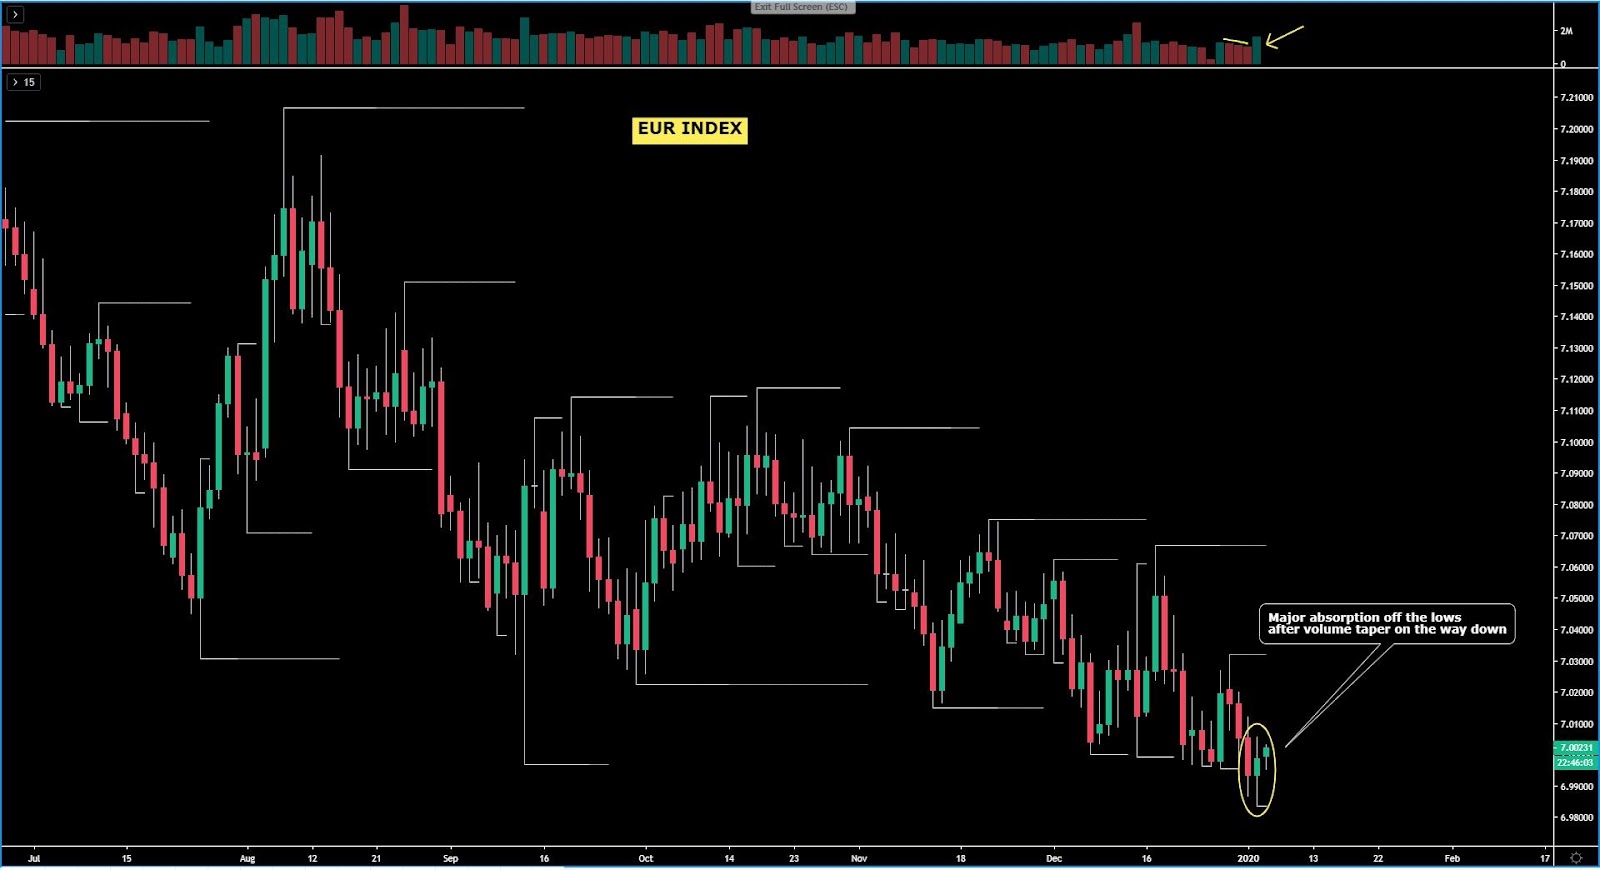
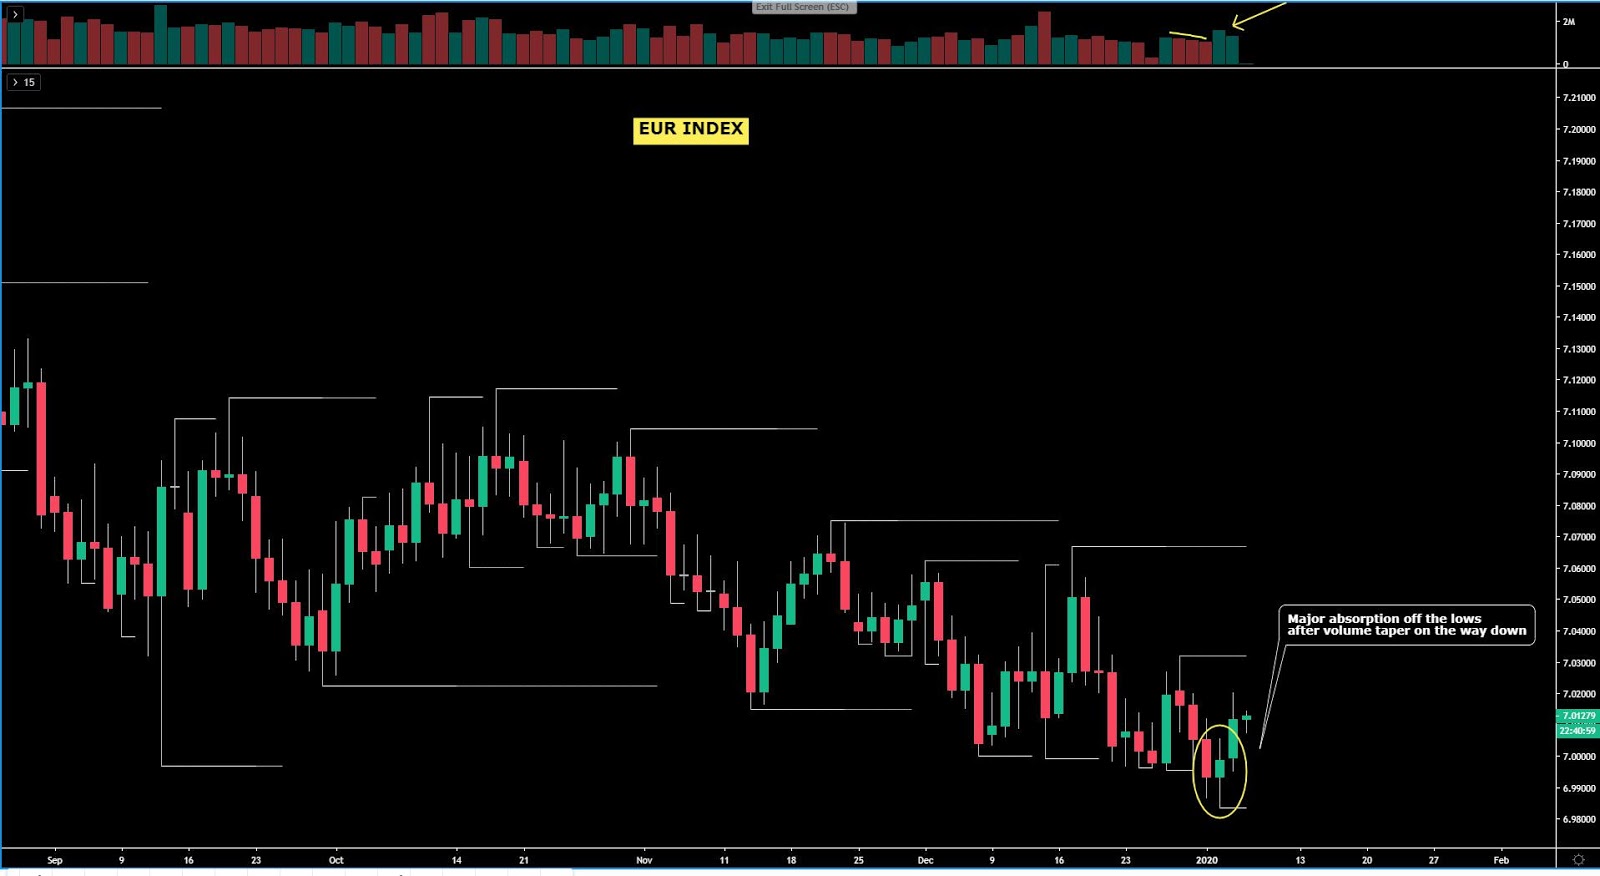
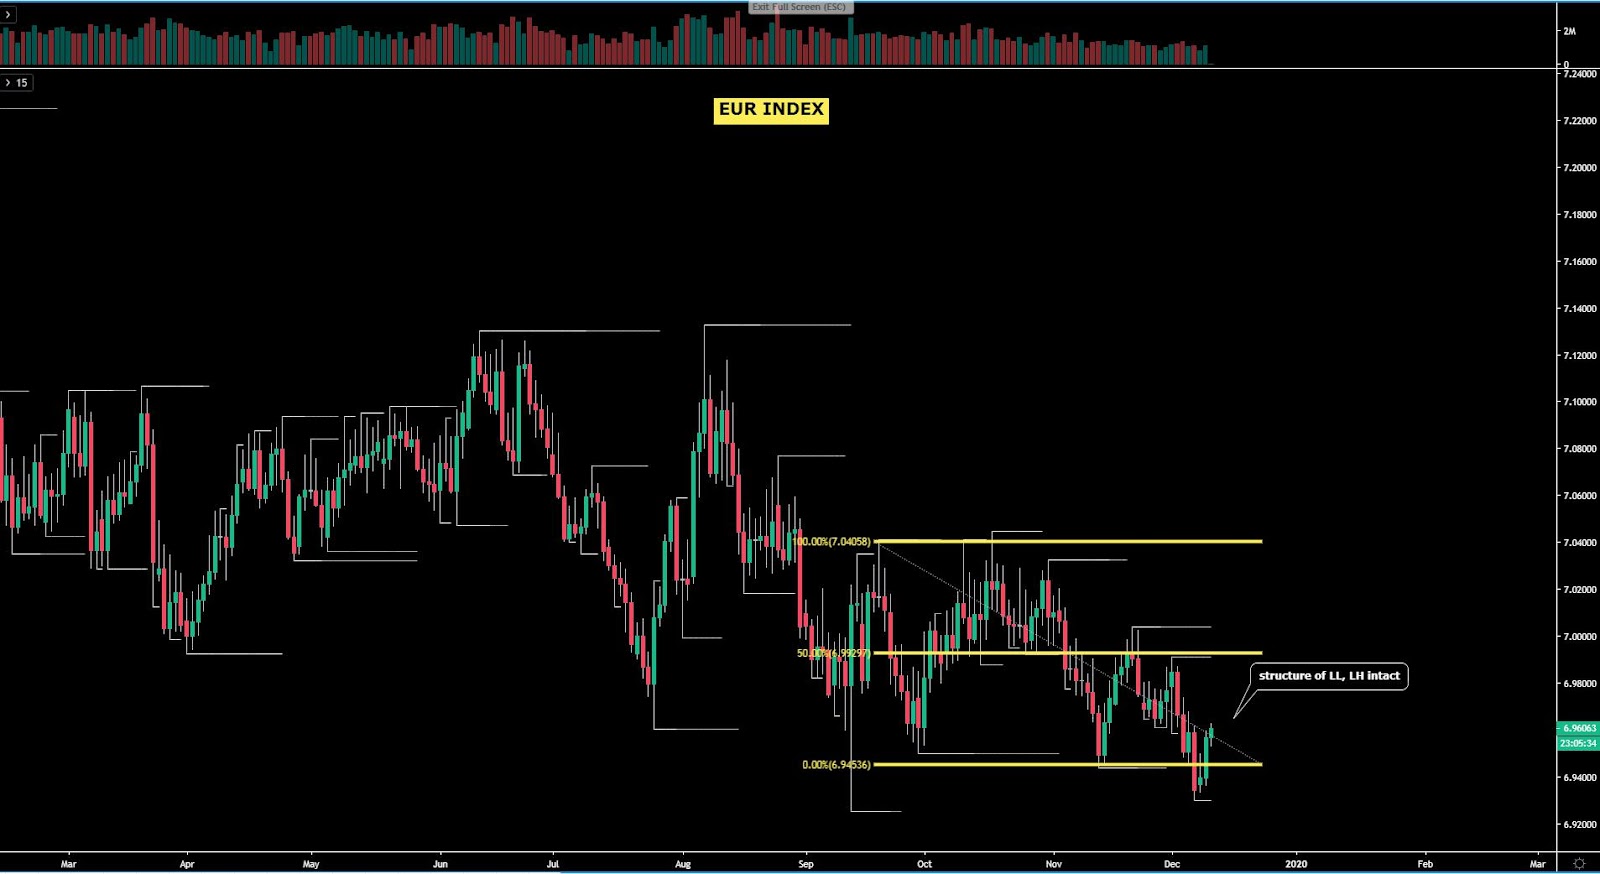
The EUR index, which had its lowest close in years last Friday, has managed to find strong buy-side interest below a broken level of support as the German data keeps improving. Where we go from here is not clear as the technicals are hard to decode this week since the market is in a standby ahead of the major risk events ahead. The structure in the index still warrants caution as the sequence of lower lows and lower highs in the daily still rules.
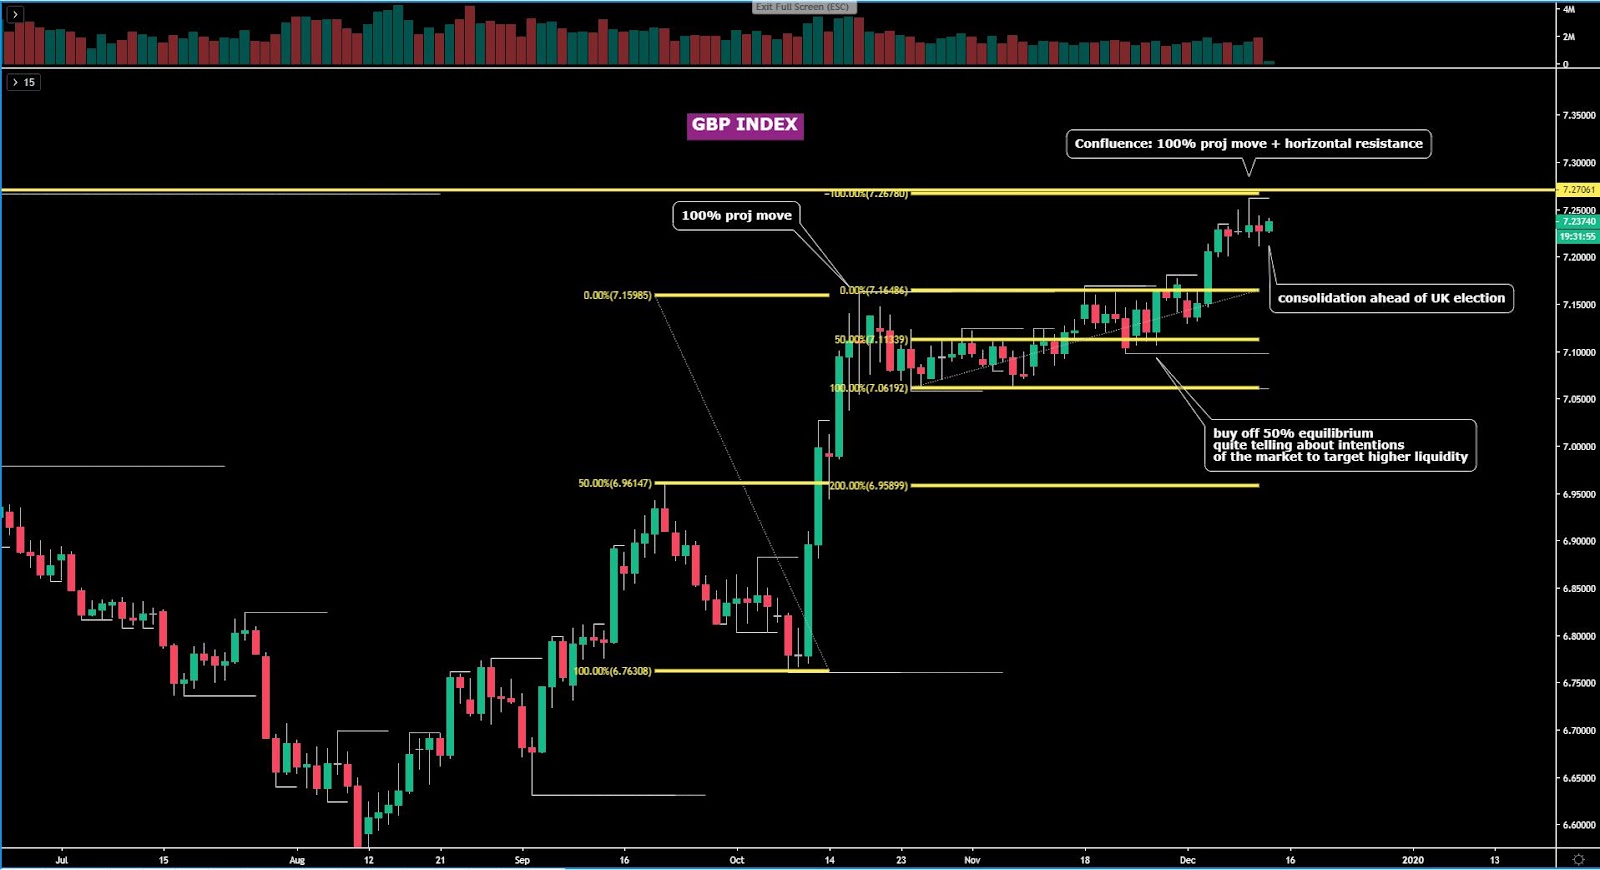
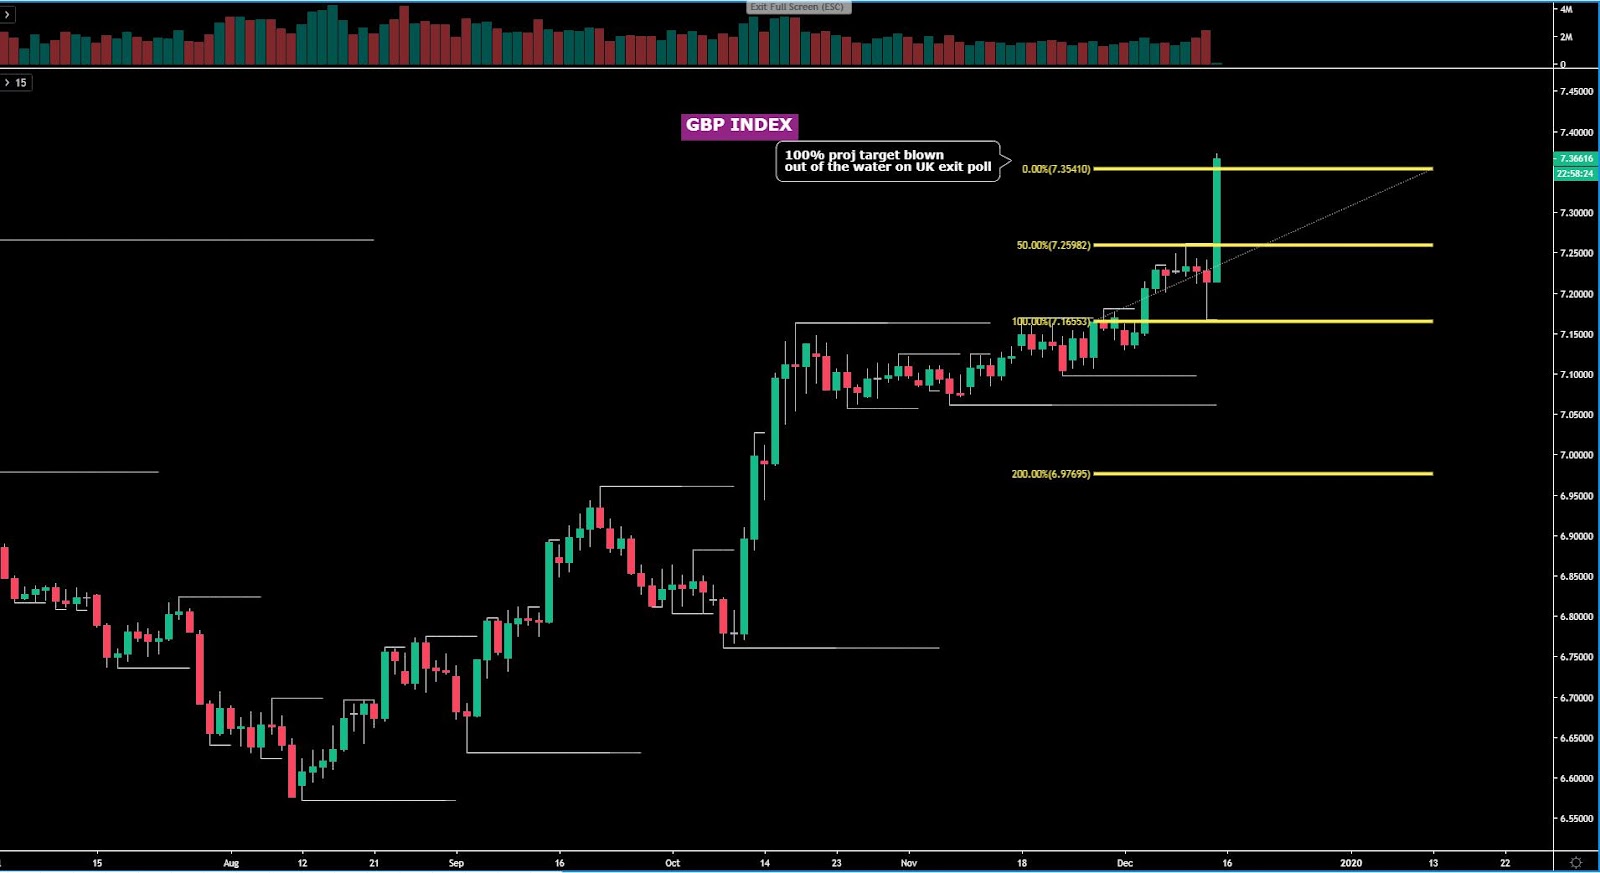
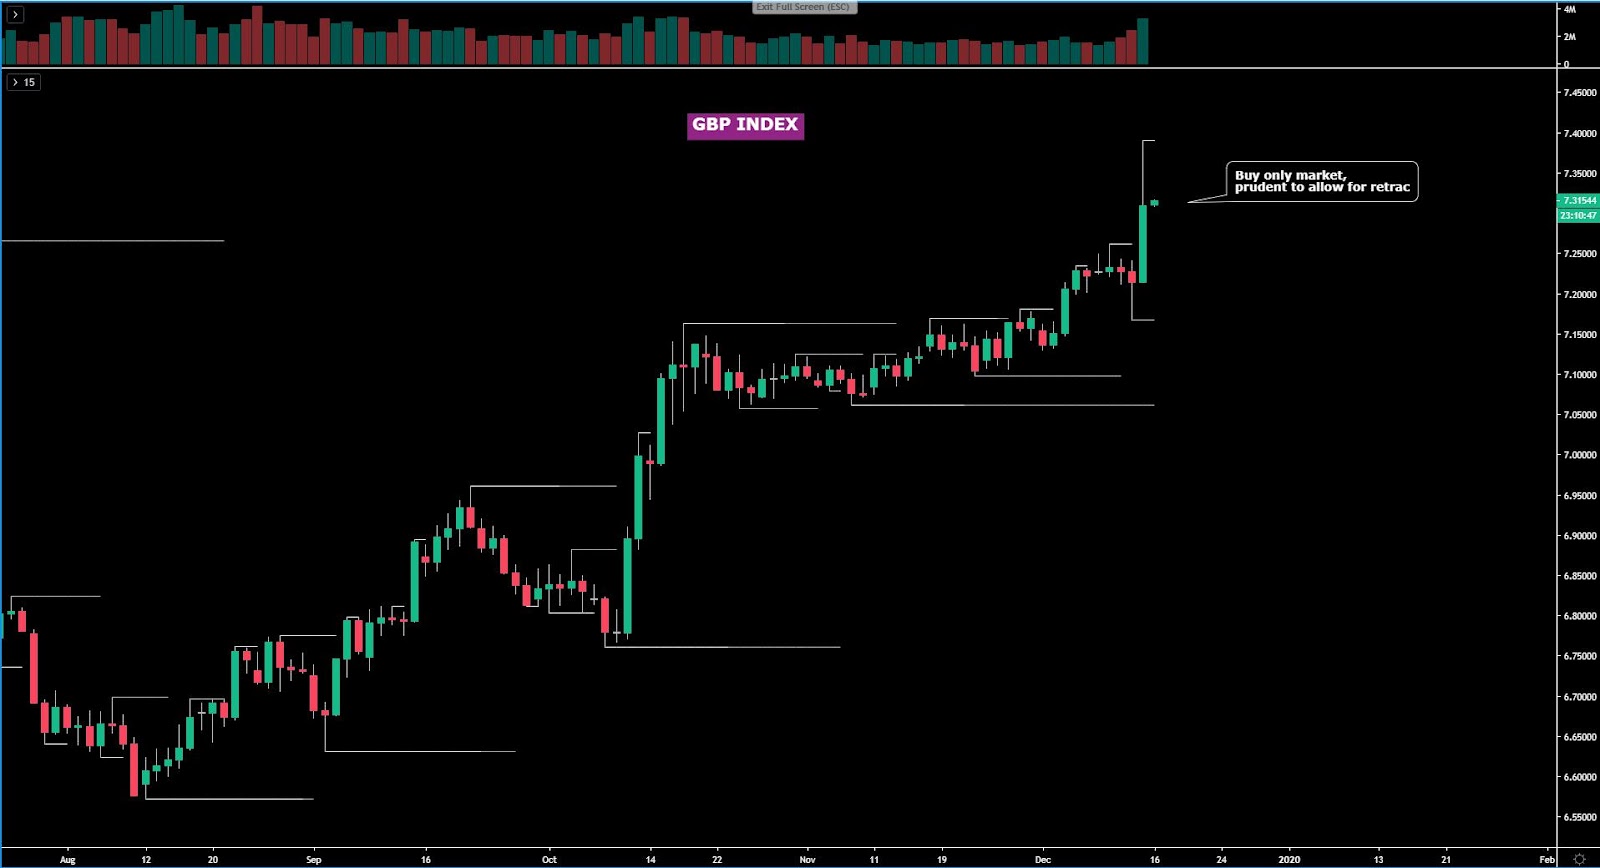
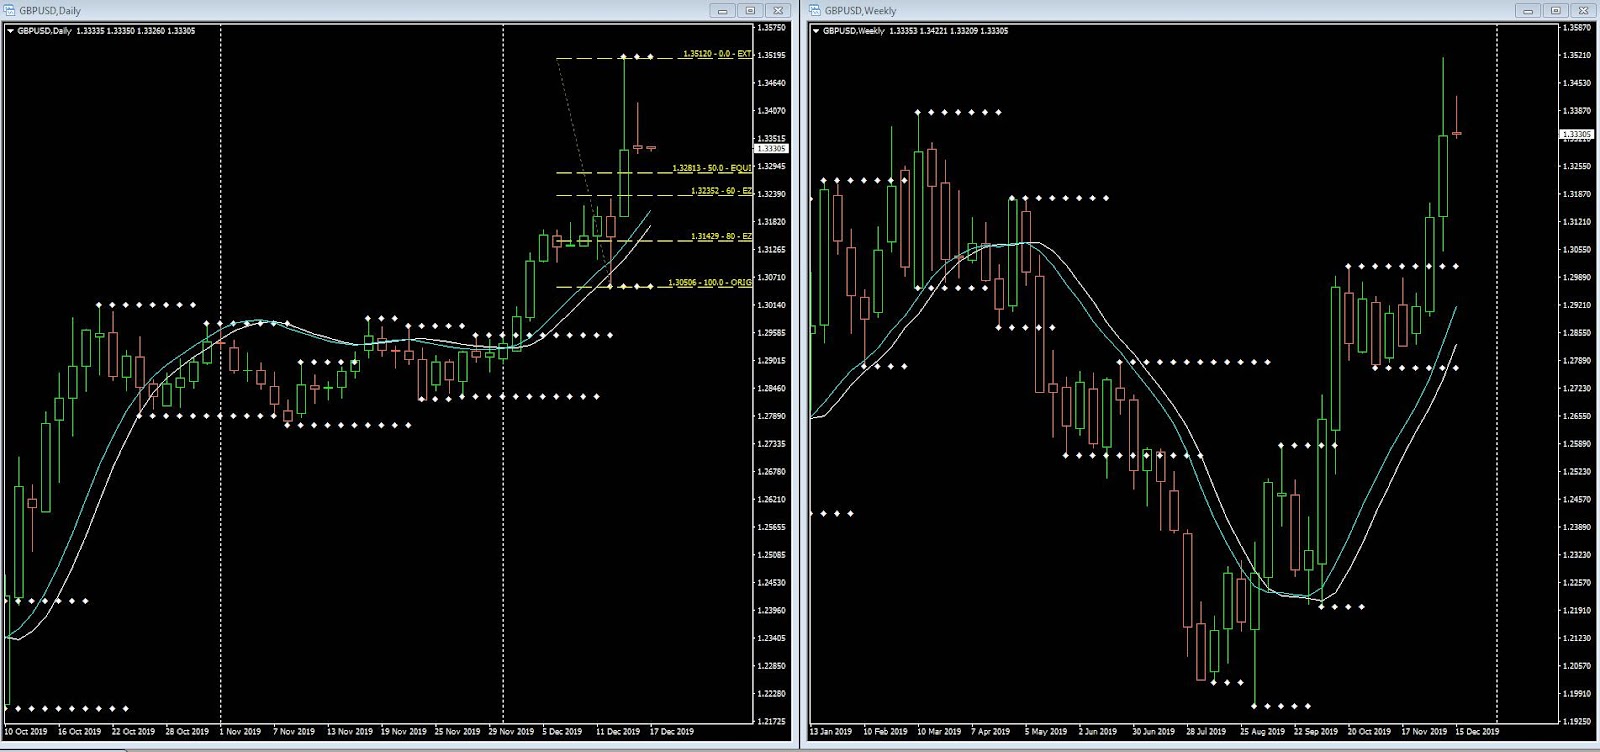
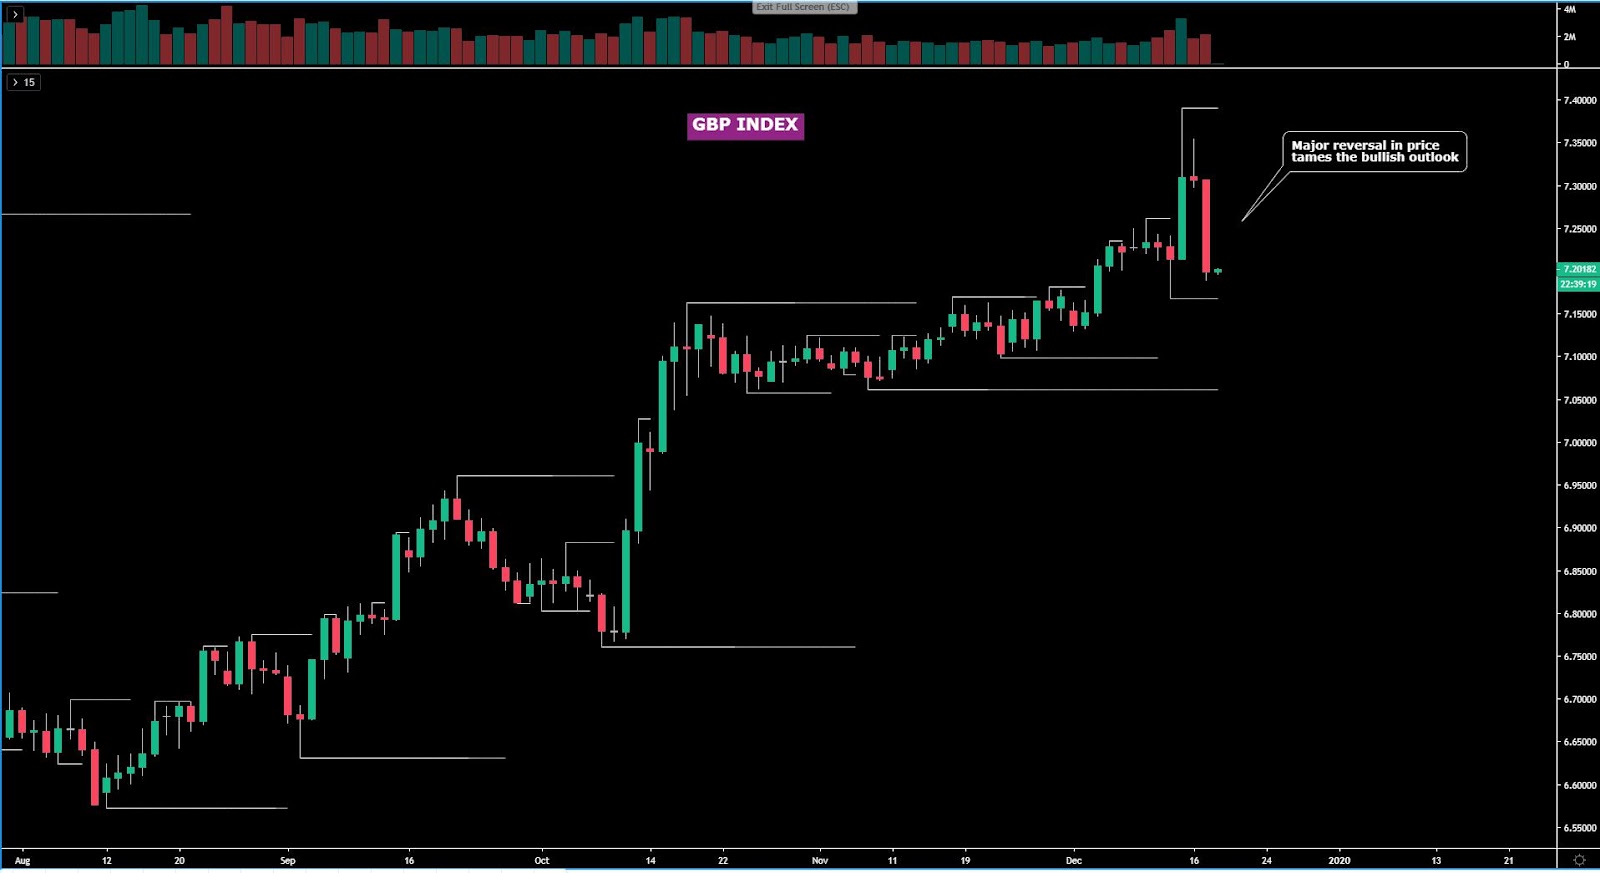
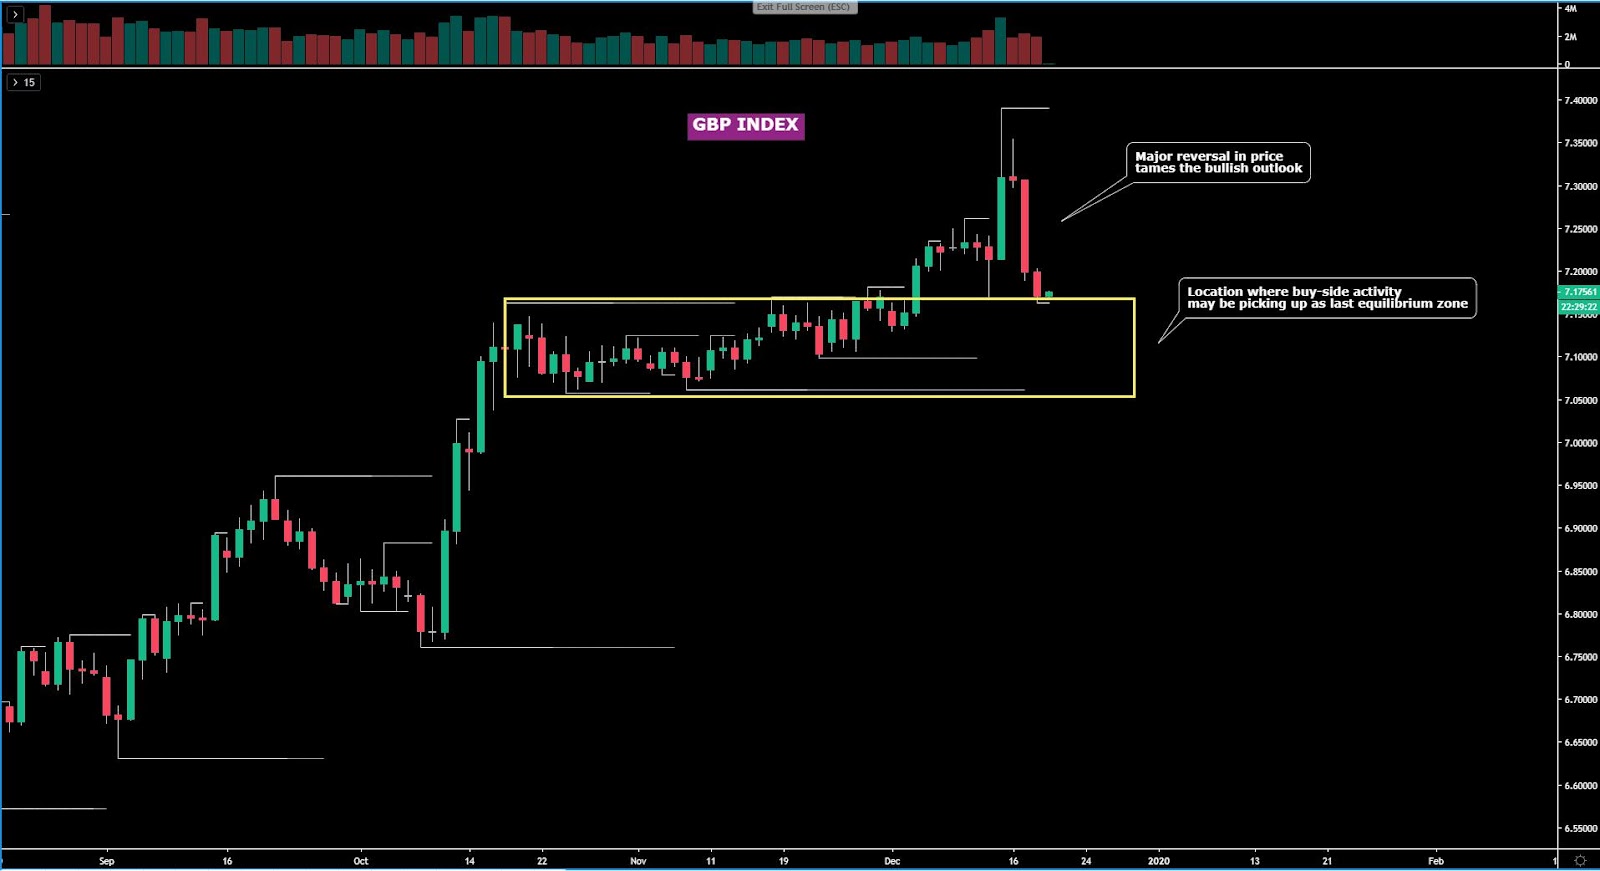
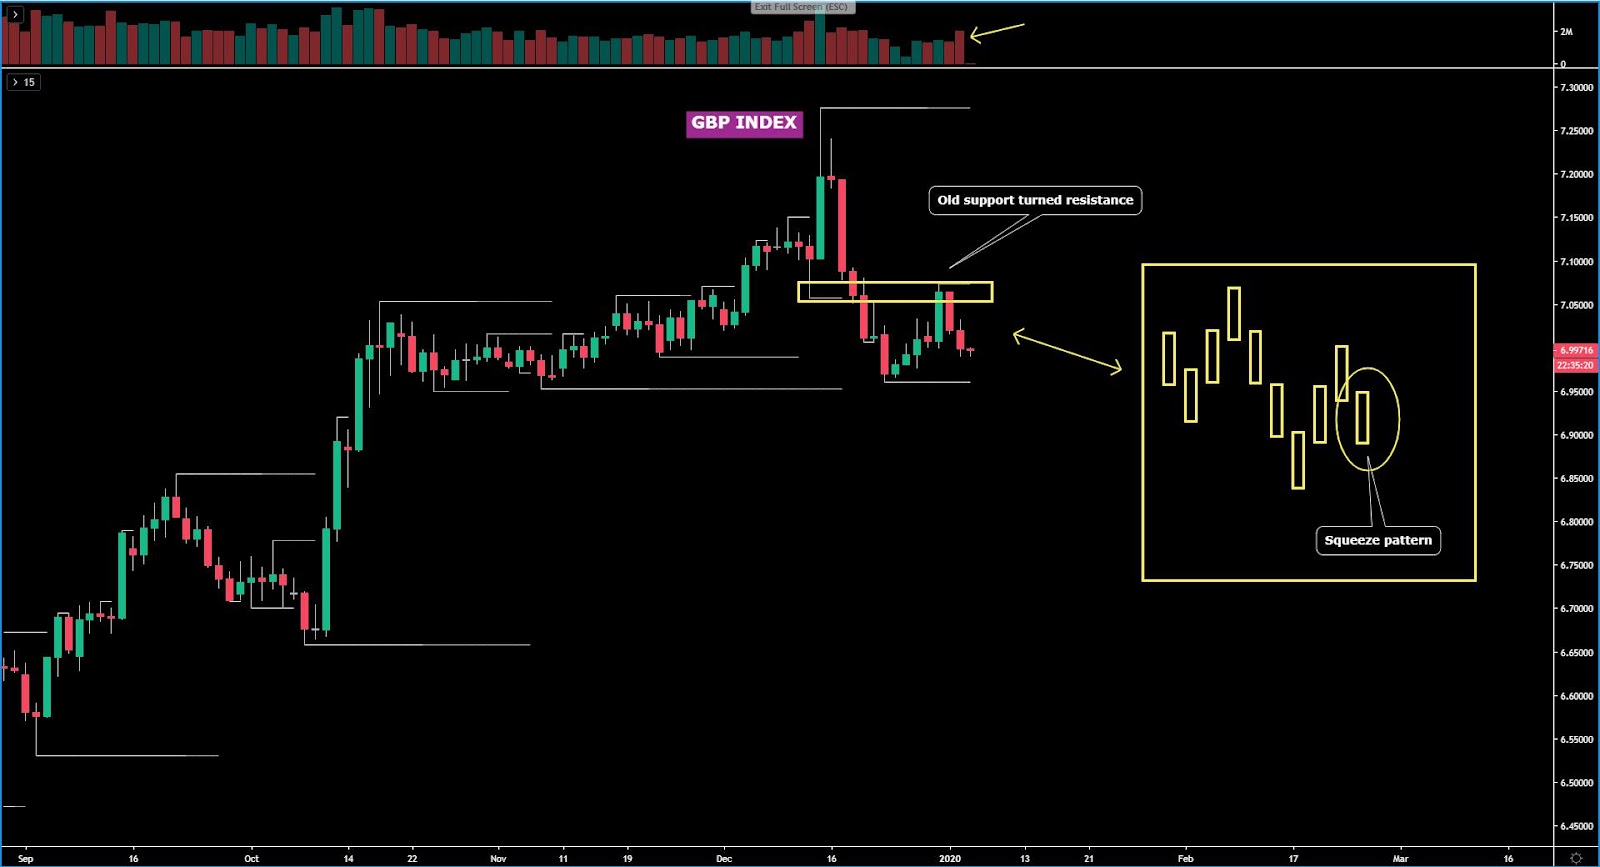
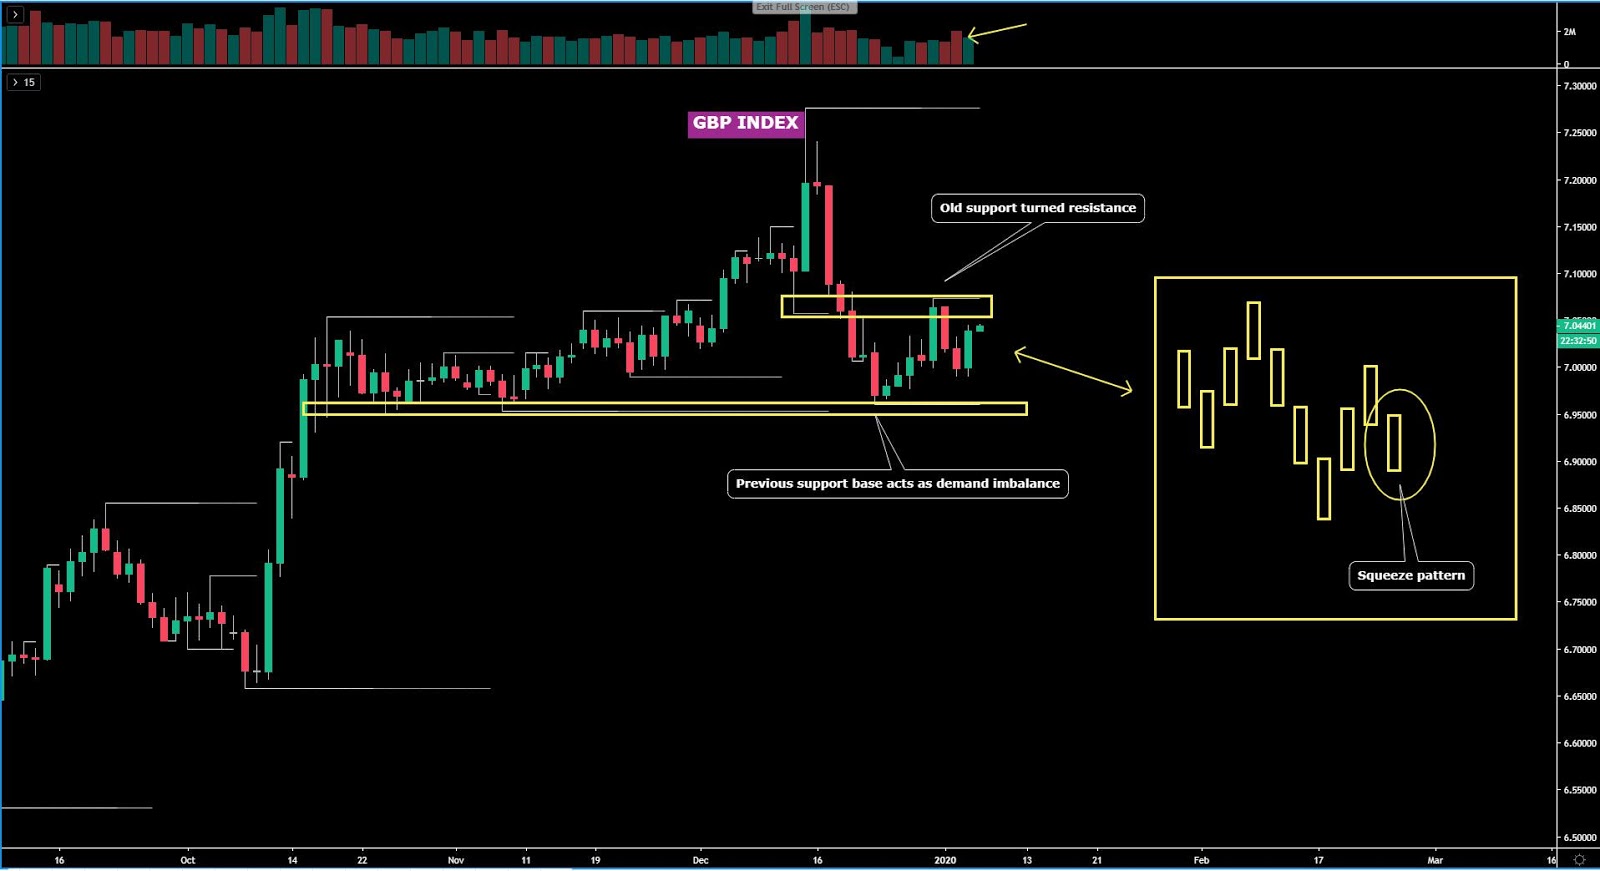
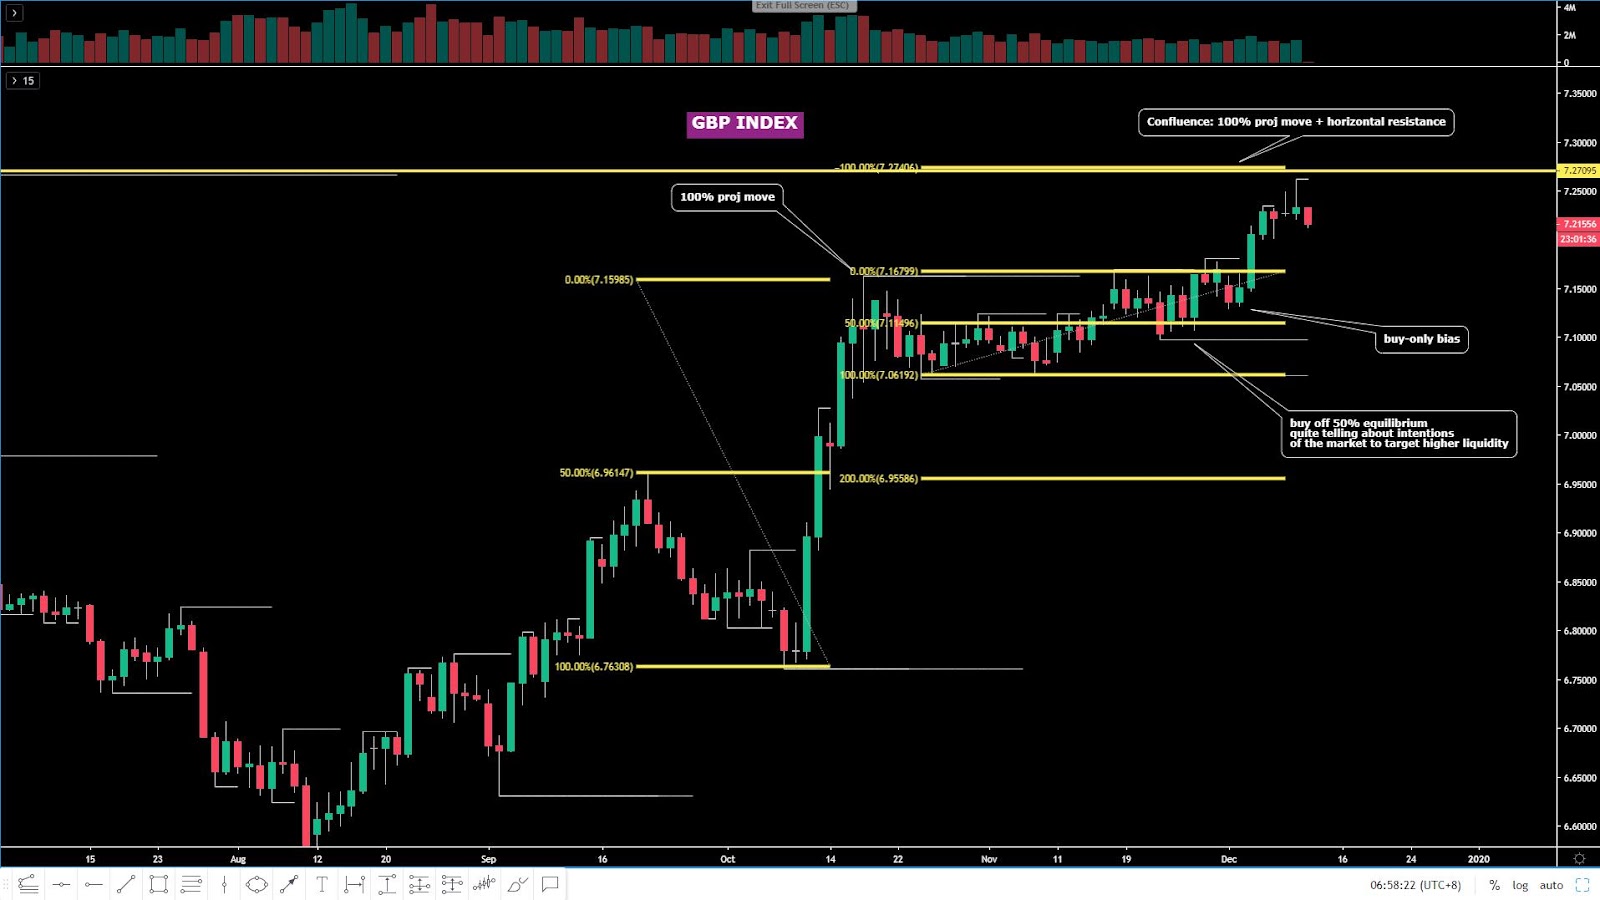
The GBP index came within a hair of the anticipated hard resistance in the form of a horizontal line and the 100% projected target. The latest UK election poll commissioned by UK Gov has knocked the currency down from its lofty levels as the Conservatives lead narrows. This setback in the poll has the market realizing that the risk of a hung parliament still exist, and as a result, on the lead up to the Dec 12 election results, some unwinding og GBP longs may now ensue.
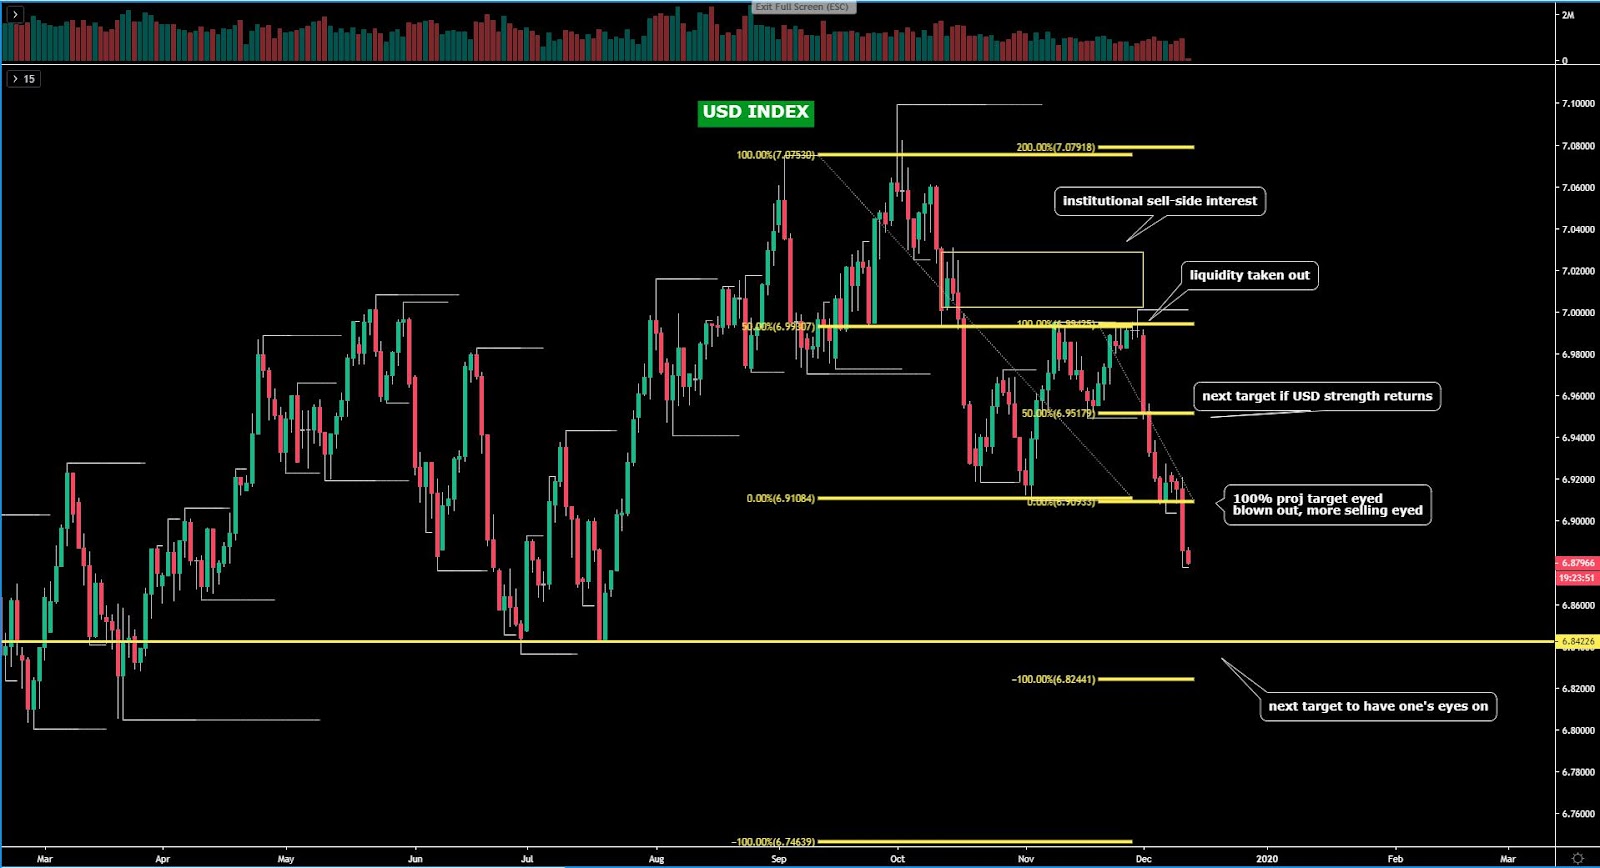
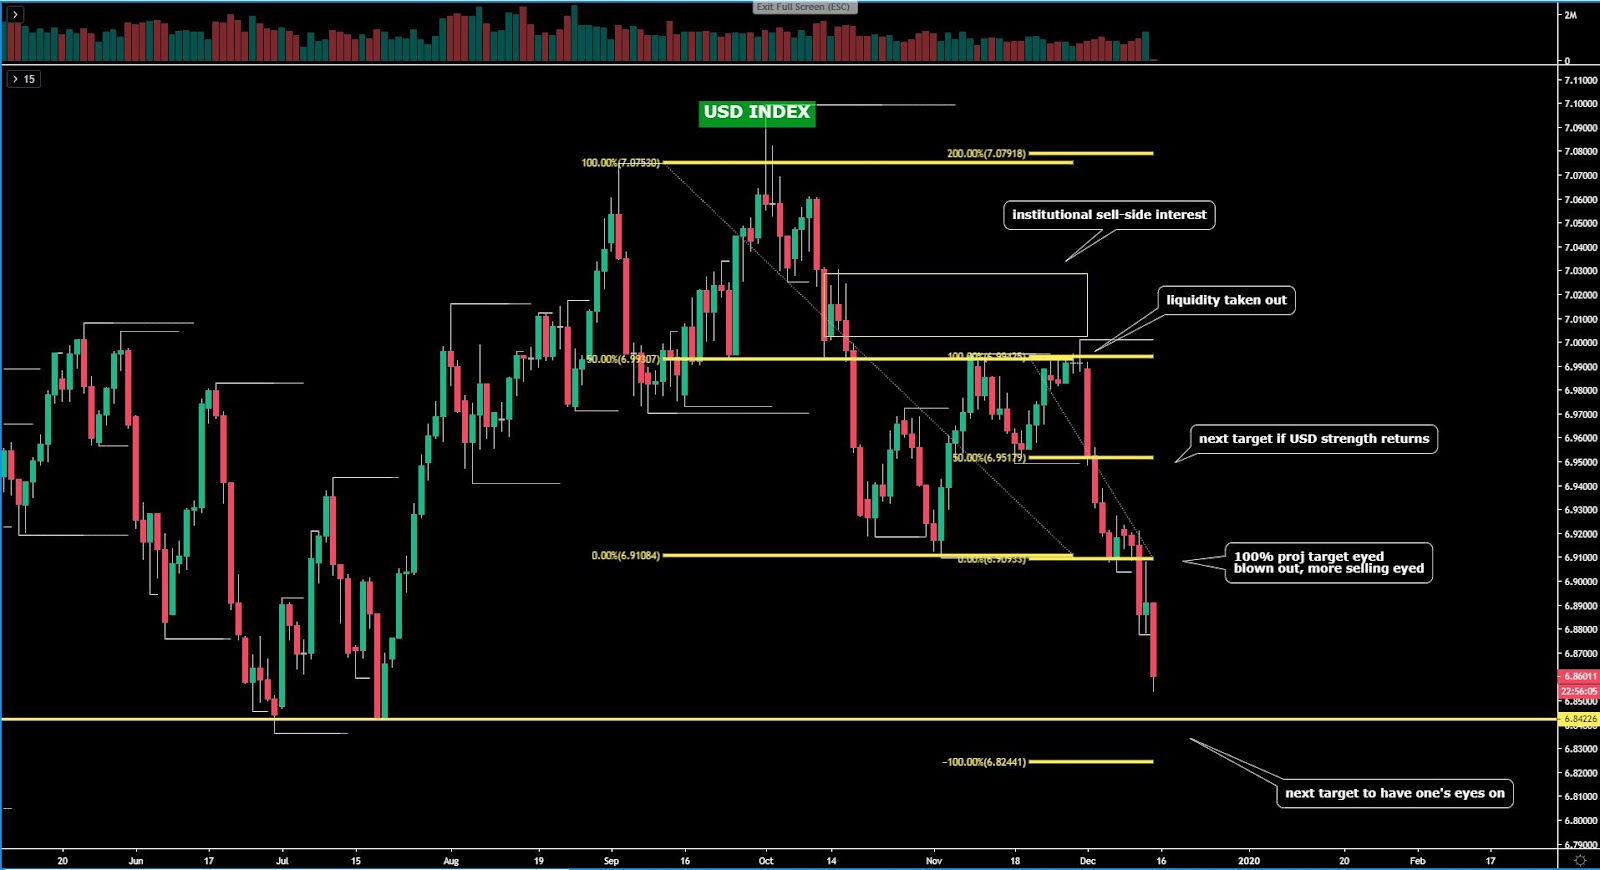
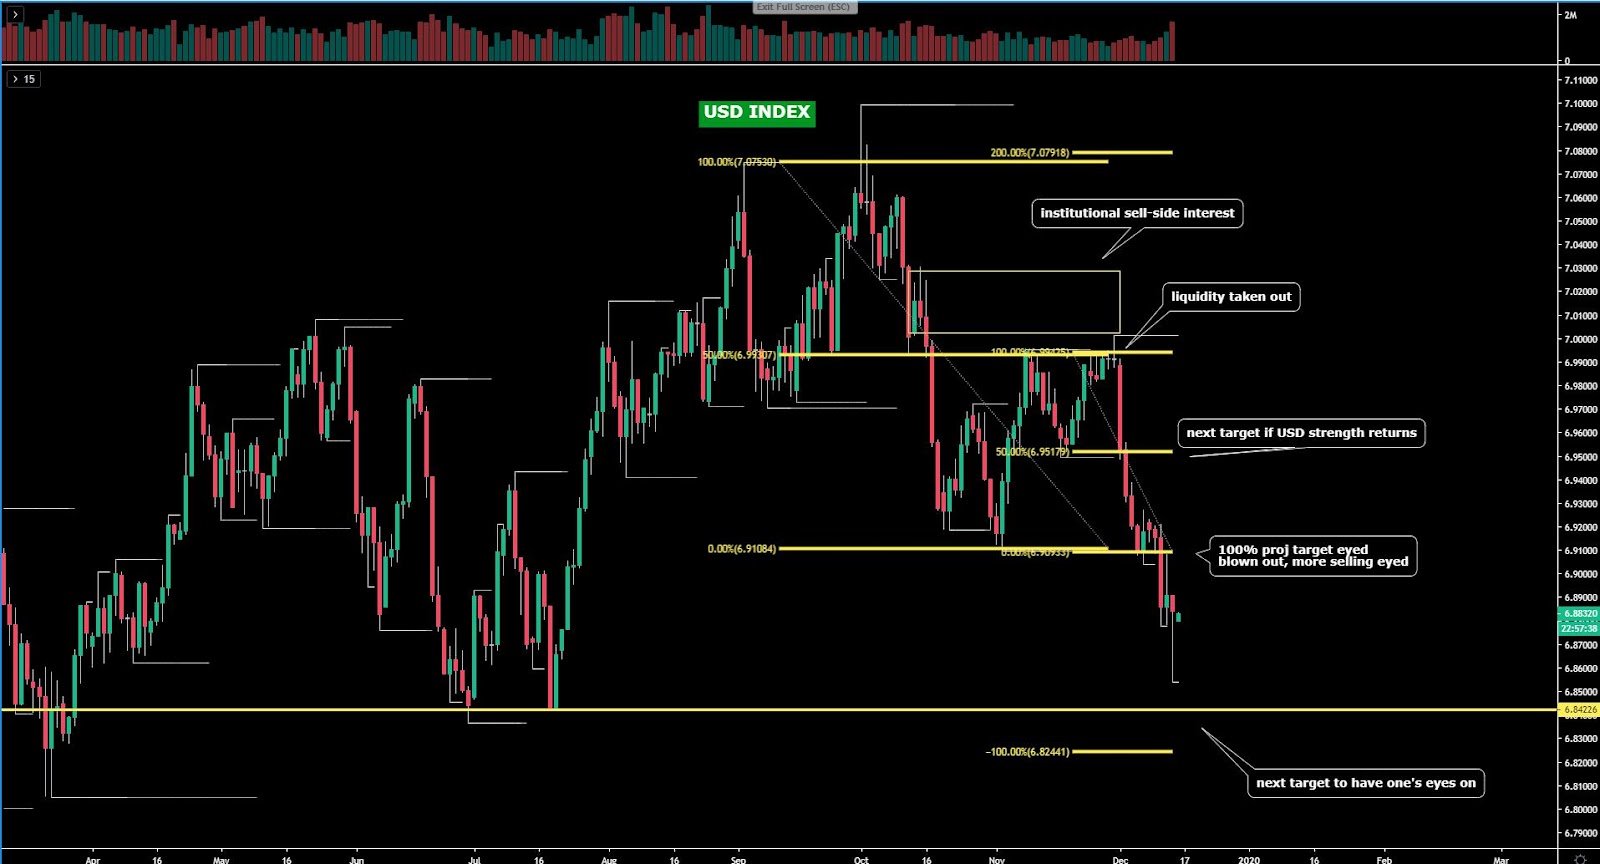
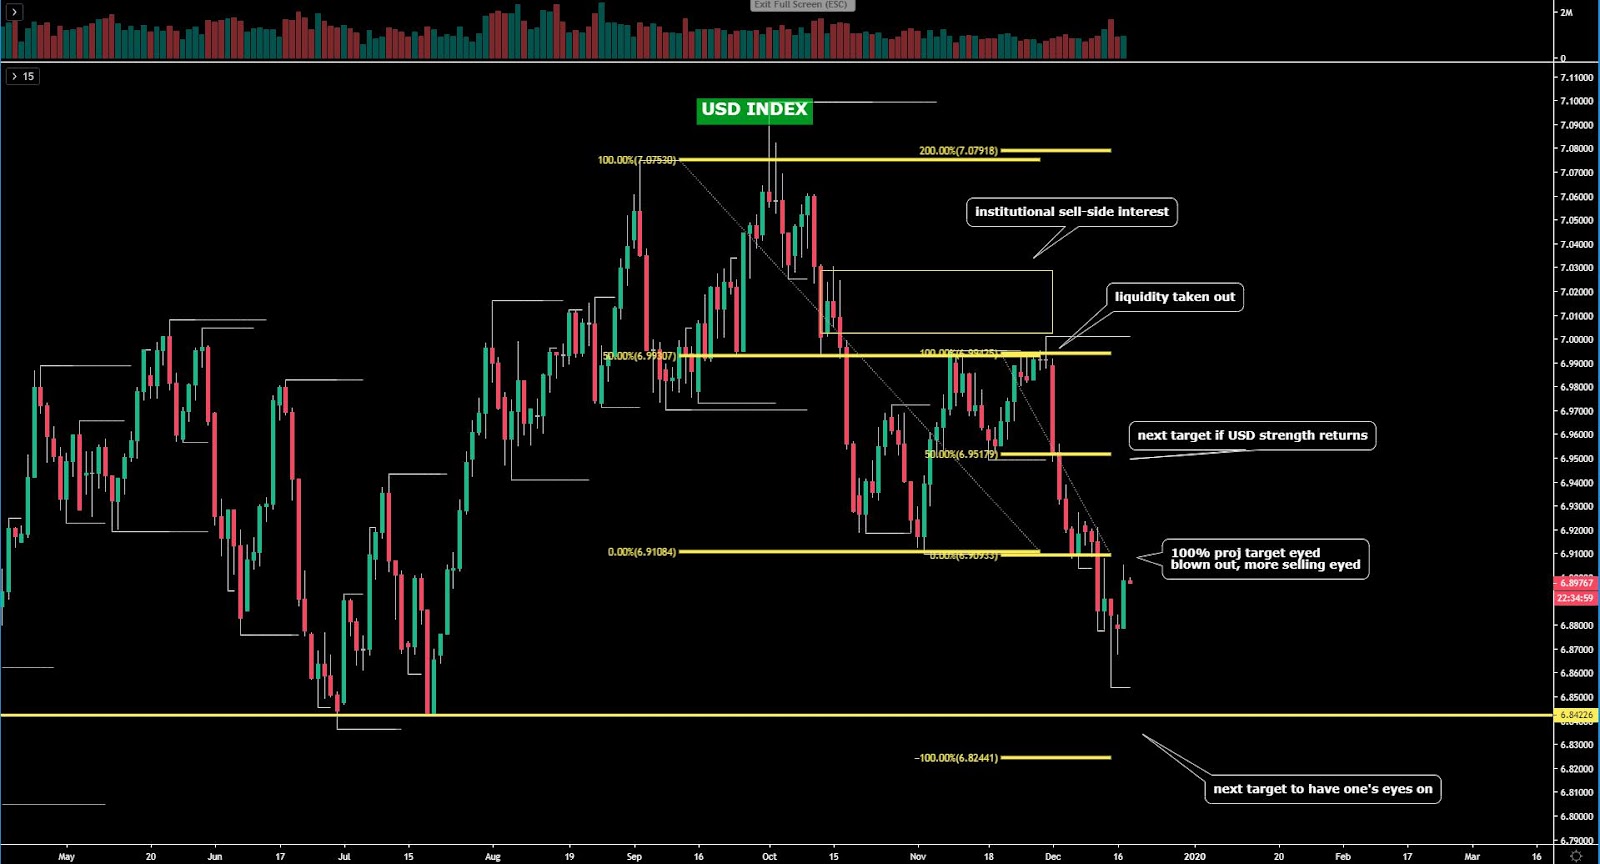
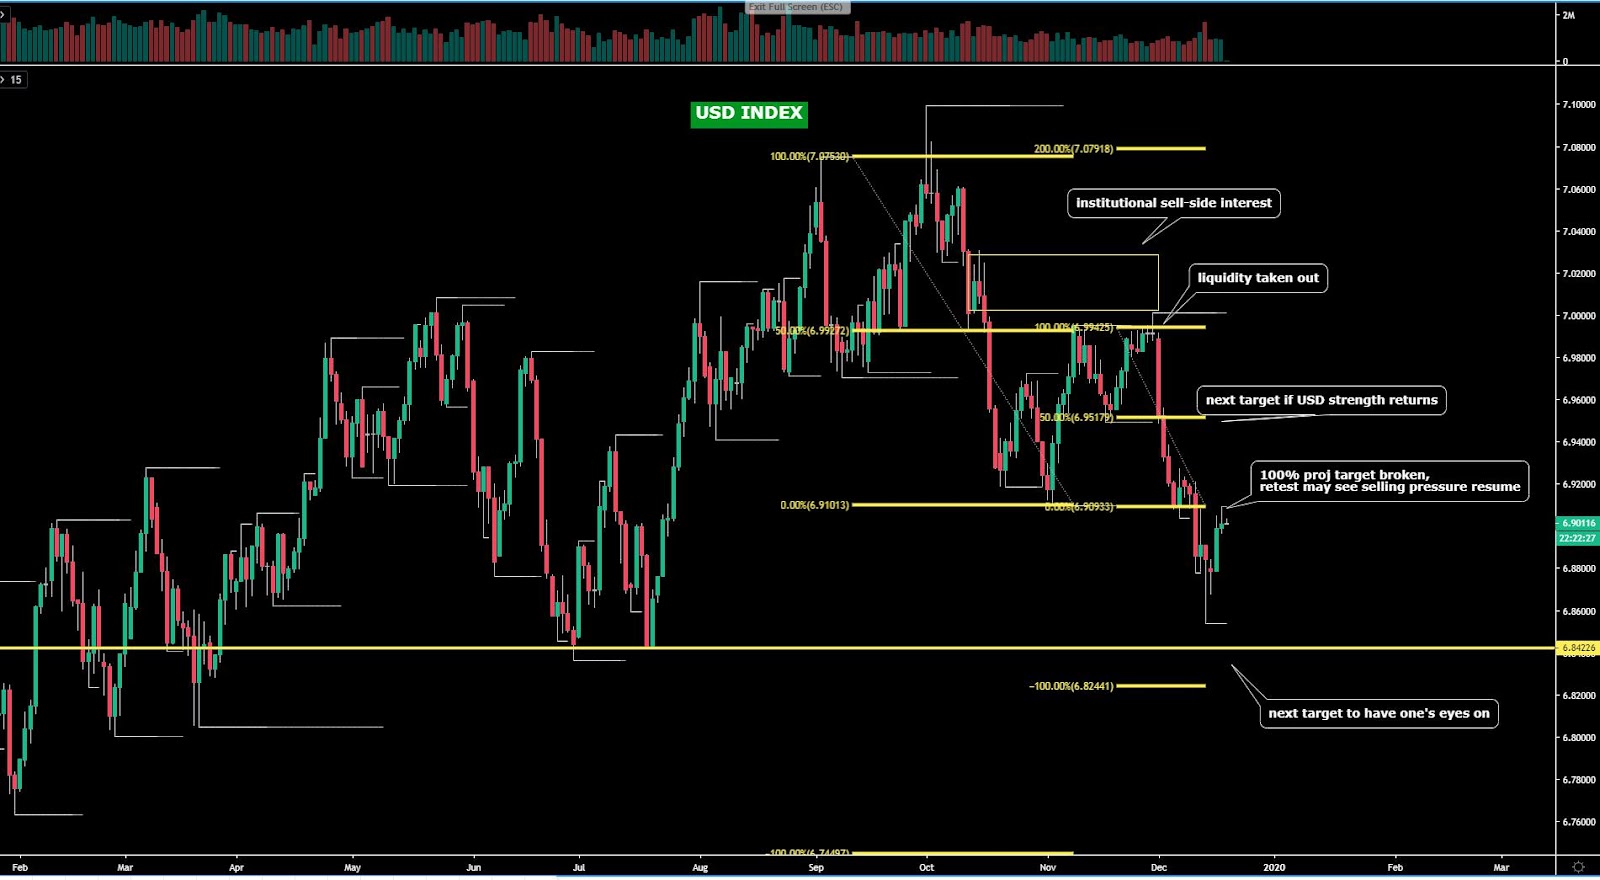
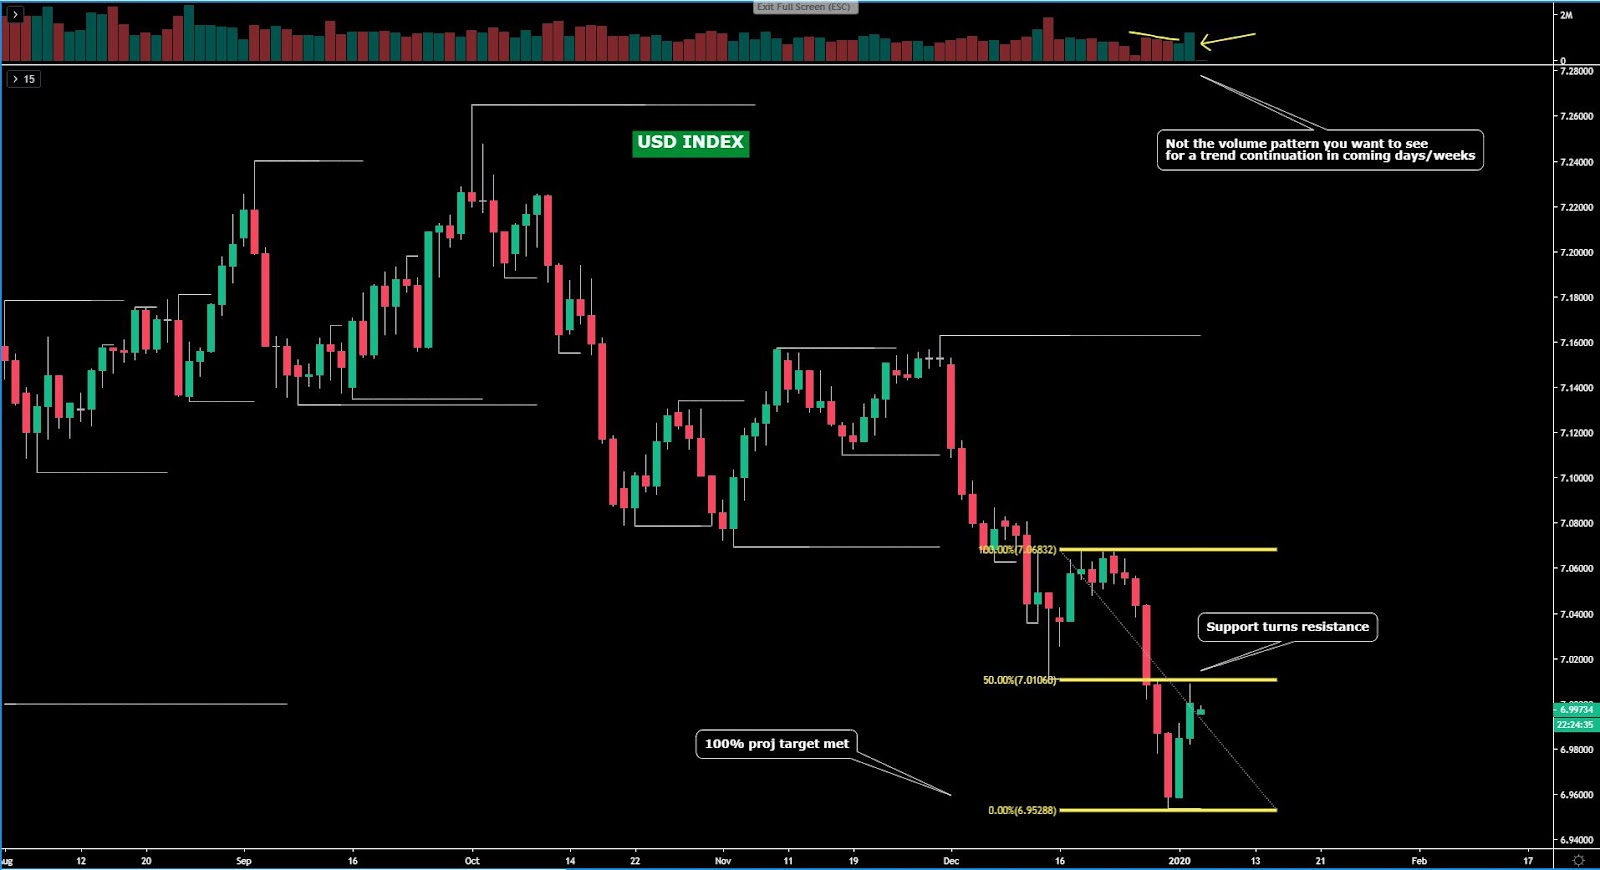
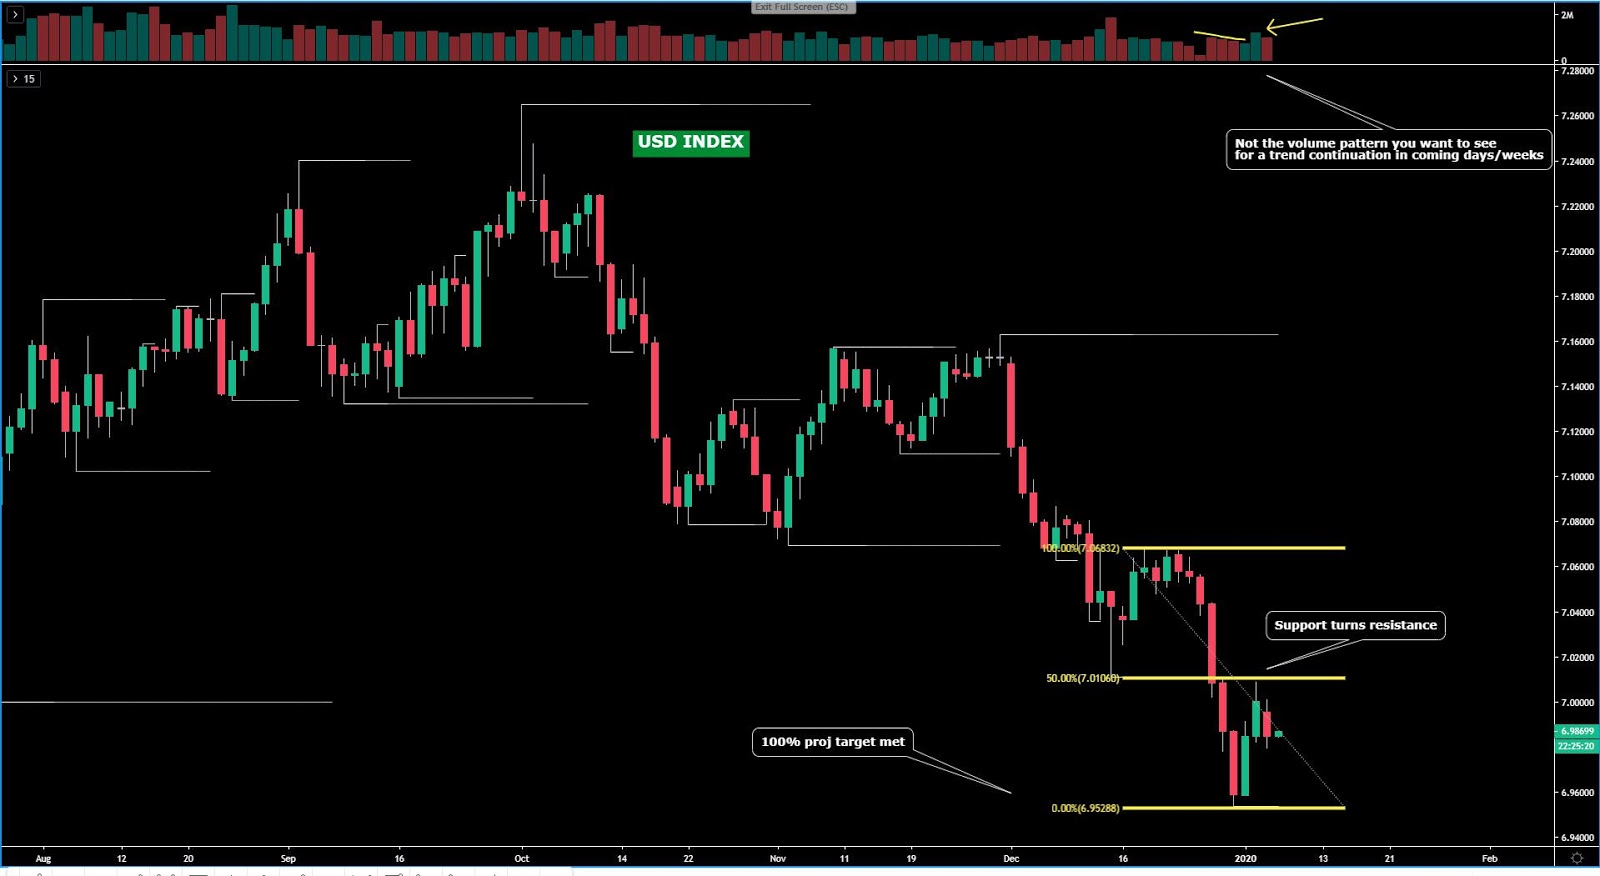
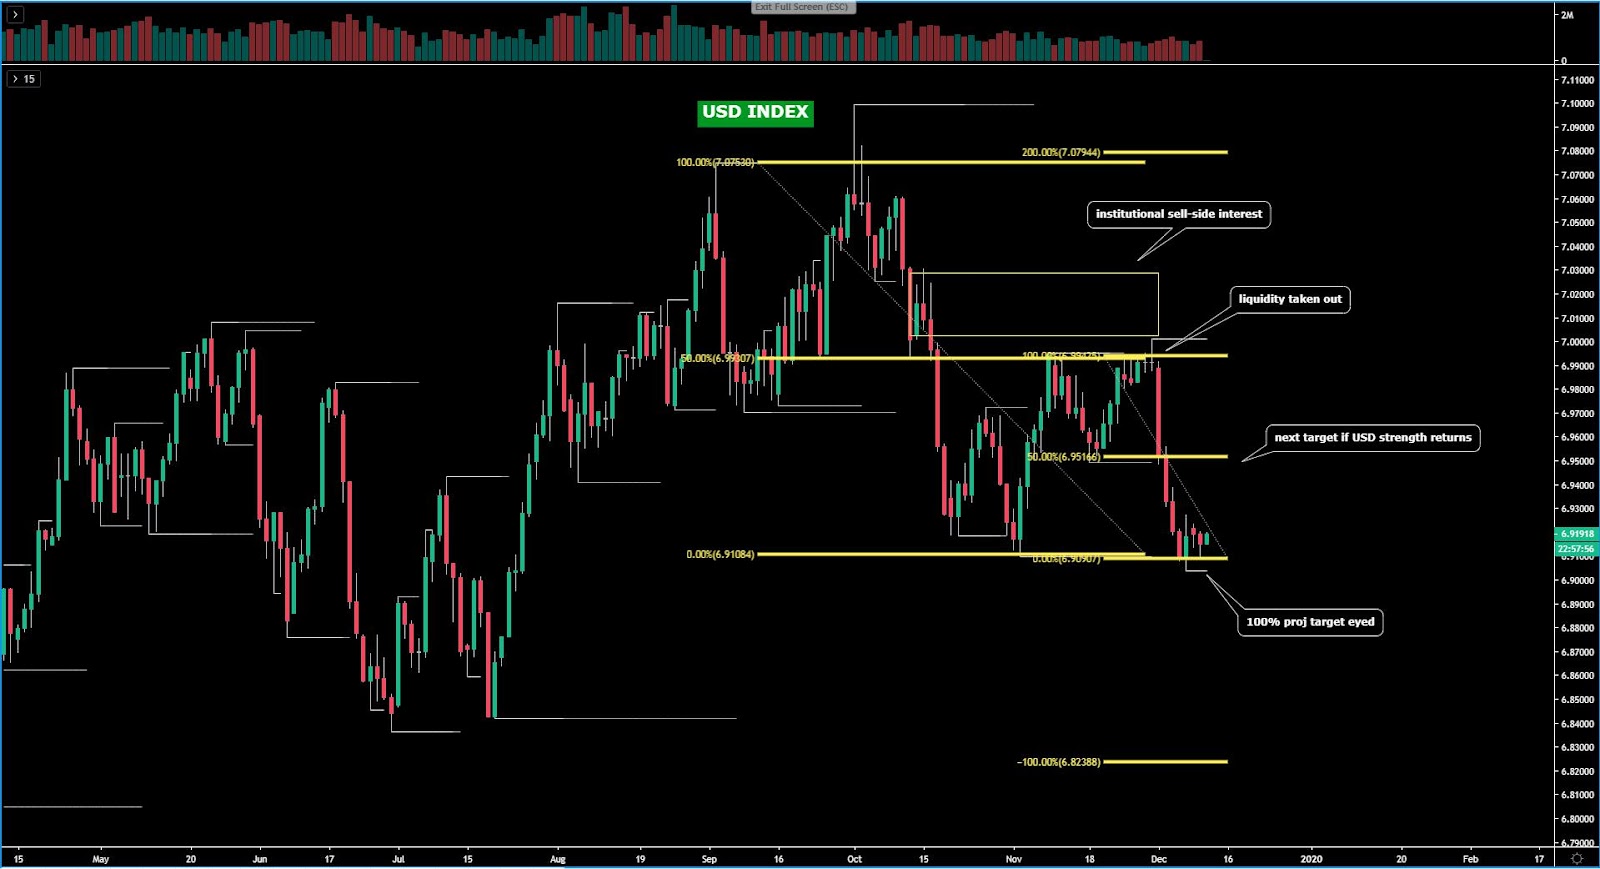
The USD index has stalled at the lows and it appears to be carving out a potential reversal, which if it gathers to see follow through, may see the new leg extends back up towards last week’s breaking point. The performance in the index this week will hinge on the outcome of the FOMC today to a certain extent. What this means is that technicals won’t necessarily act as a primary driver to gauge the next direction but rather the stance on policy by the Fed will. Nonetheless, remember, Dec forex seasonals and technicals, are both against the USD.
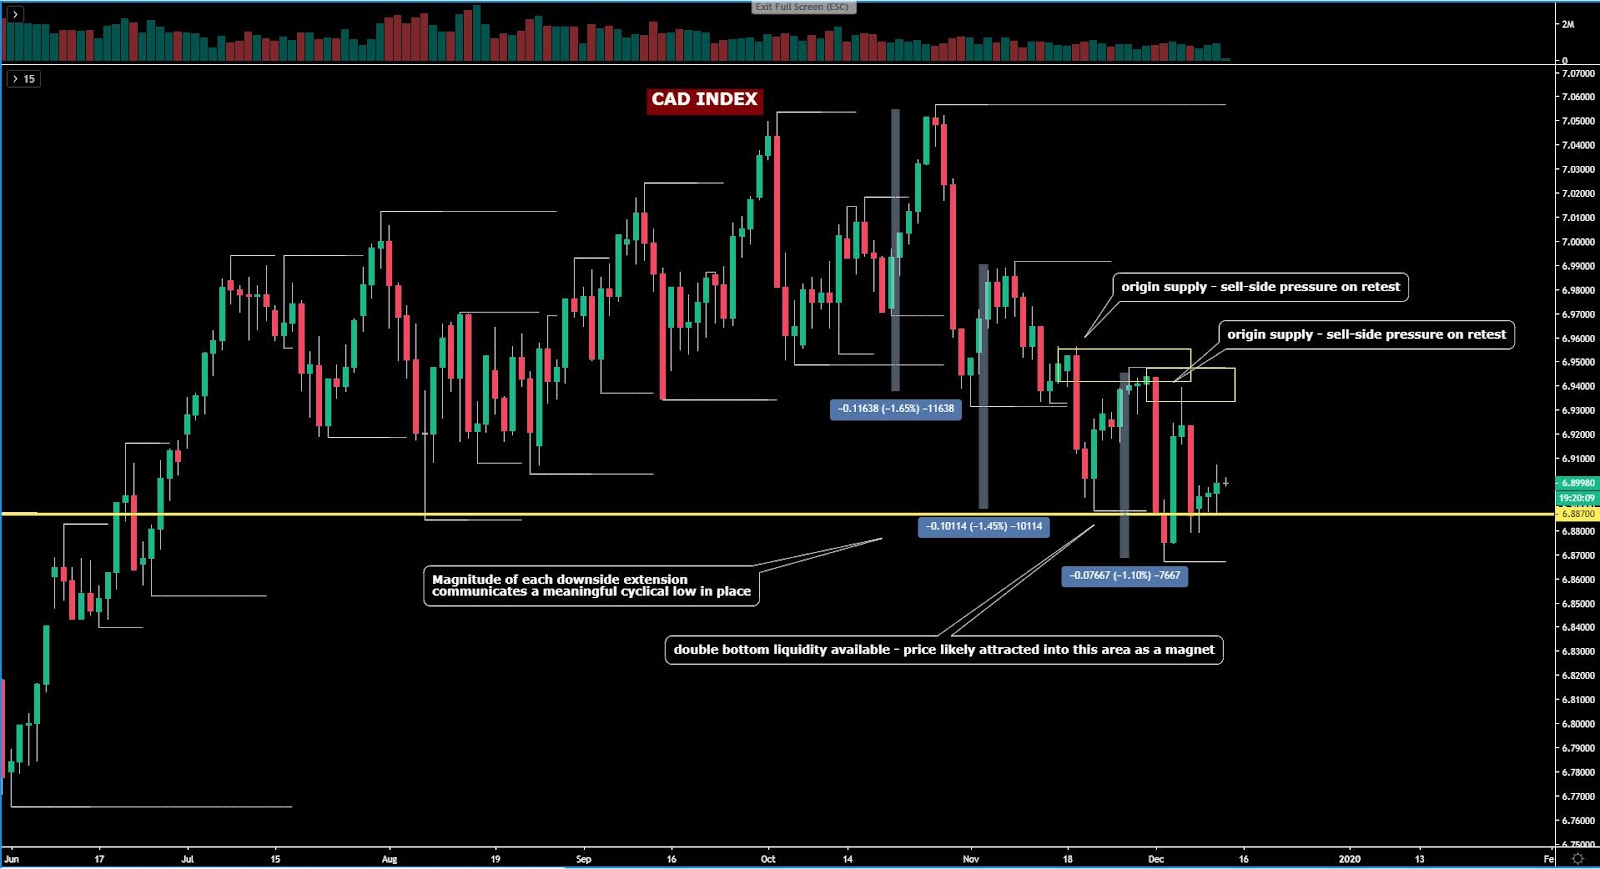
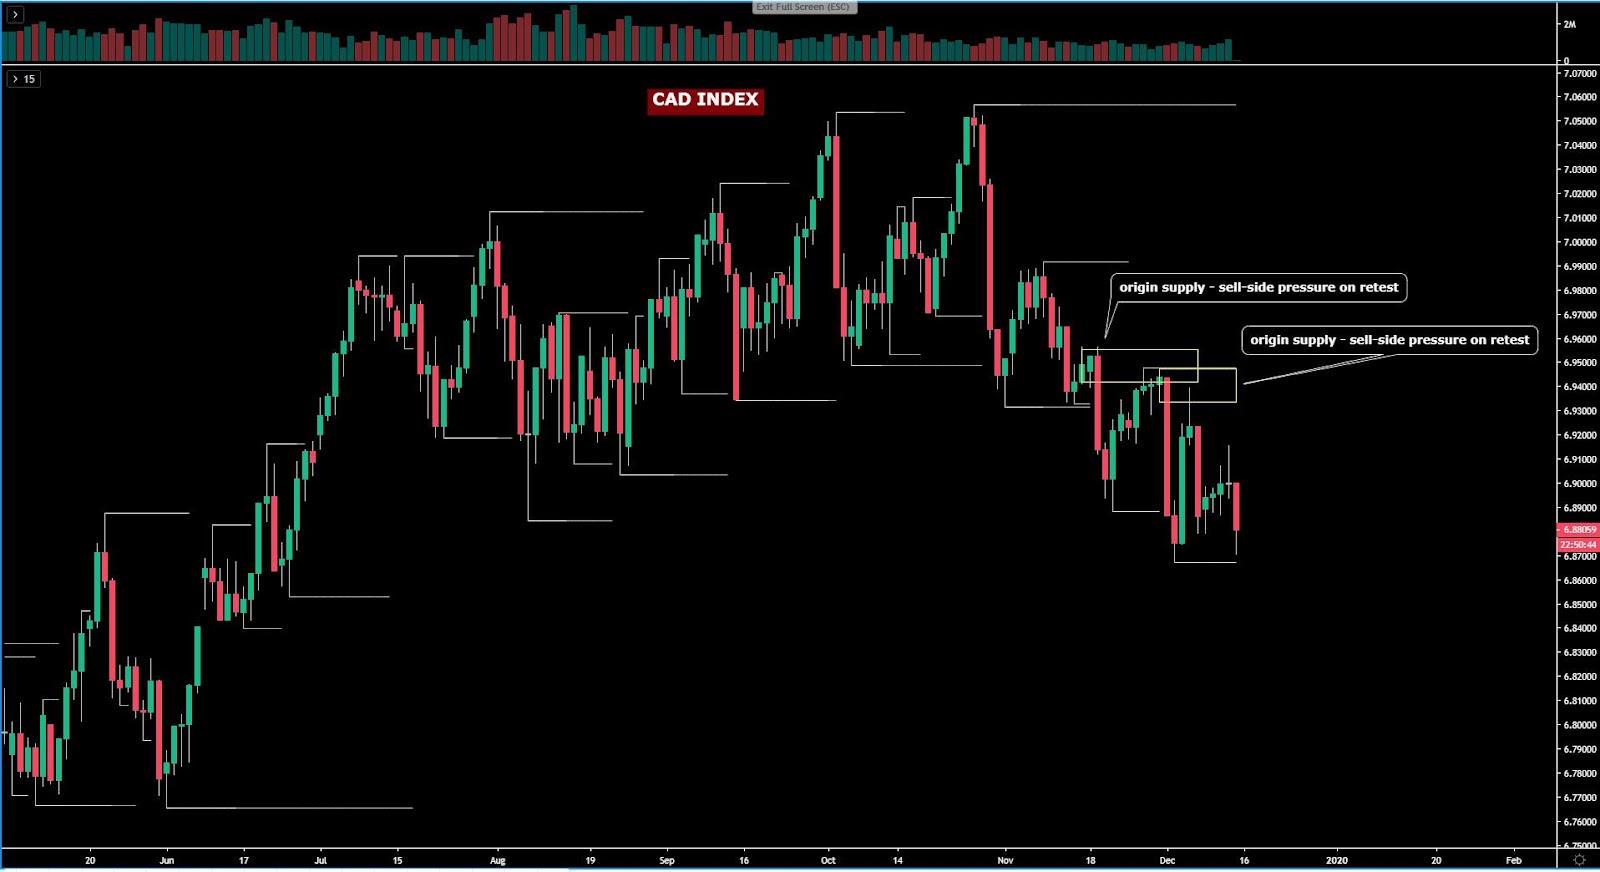
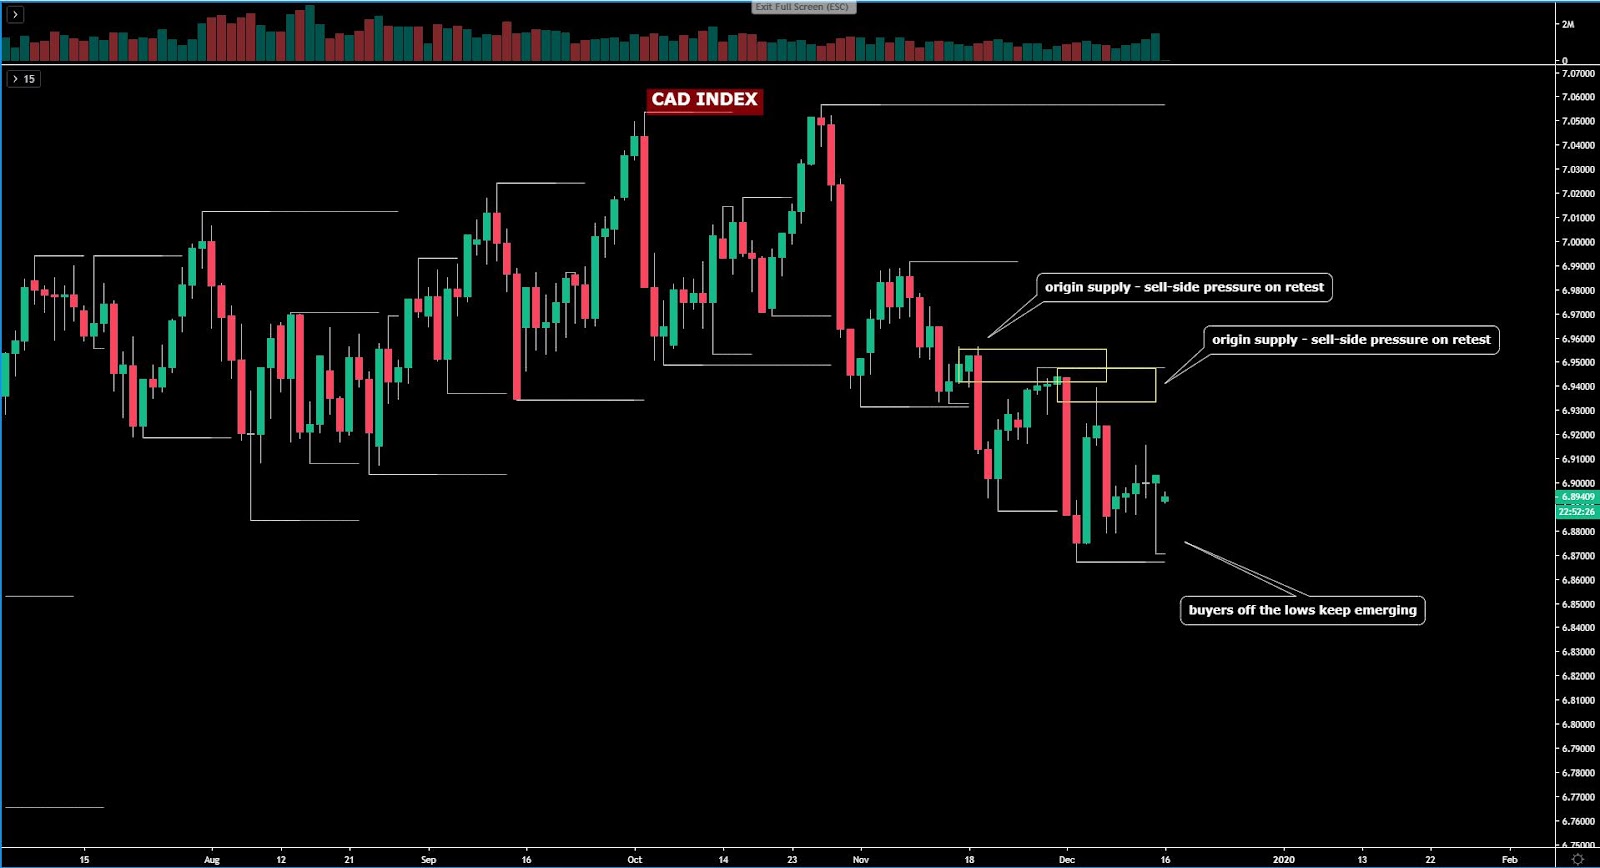
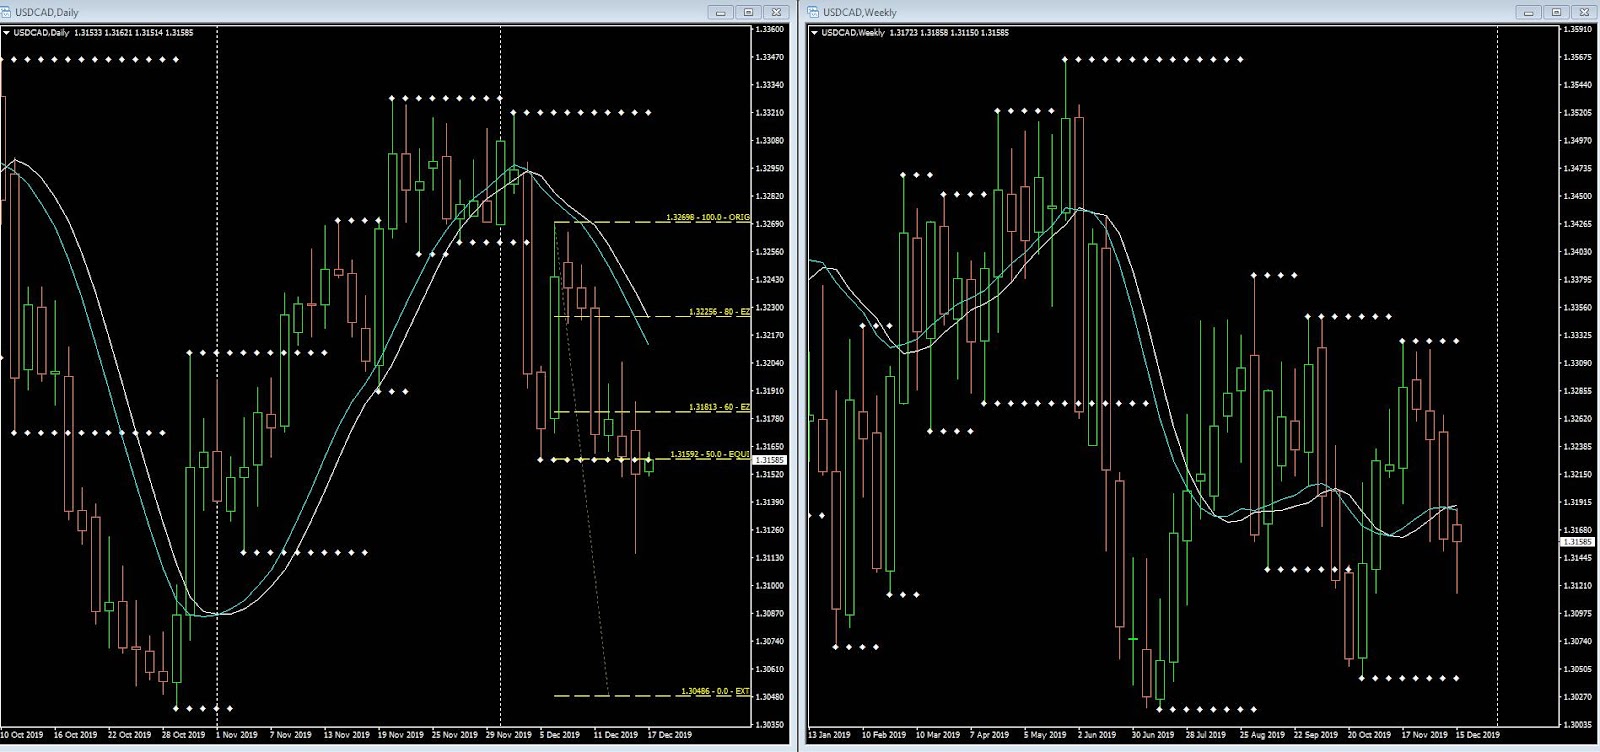
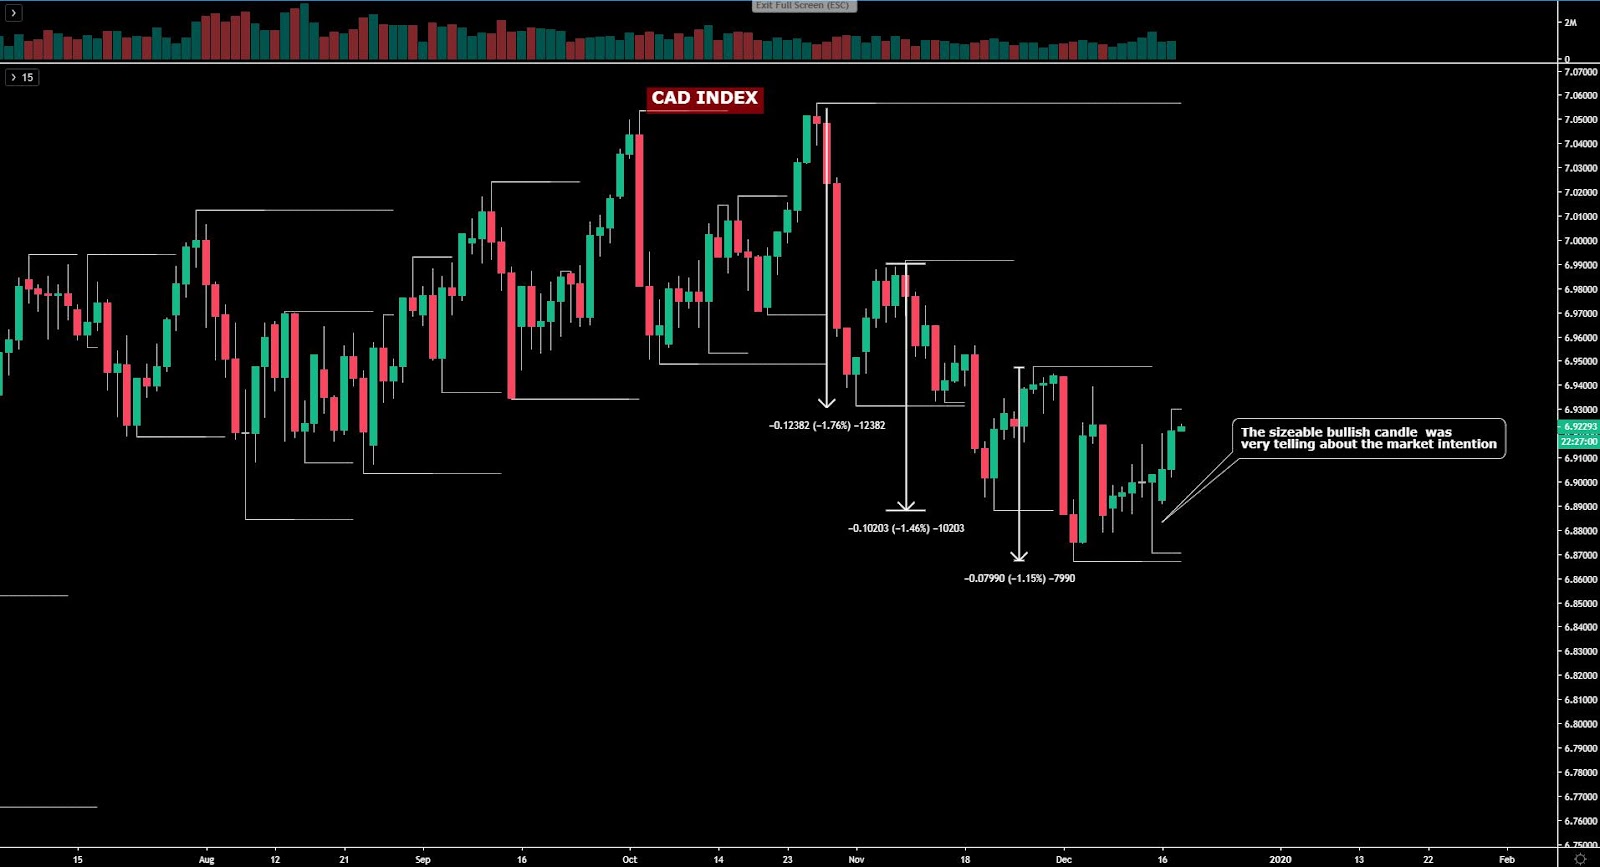
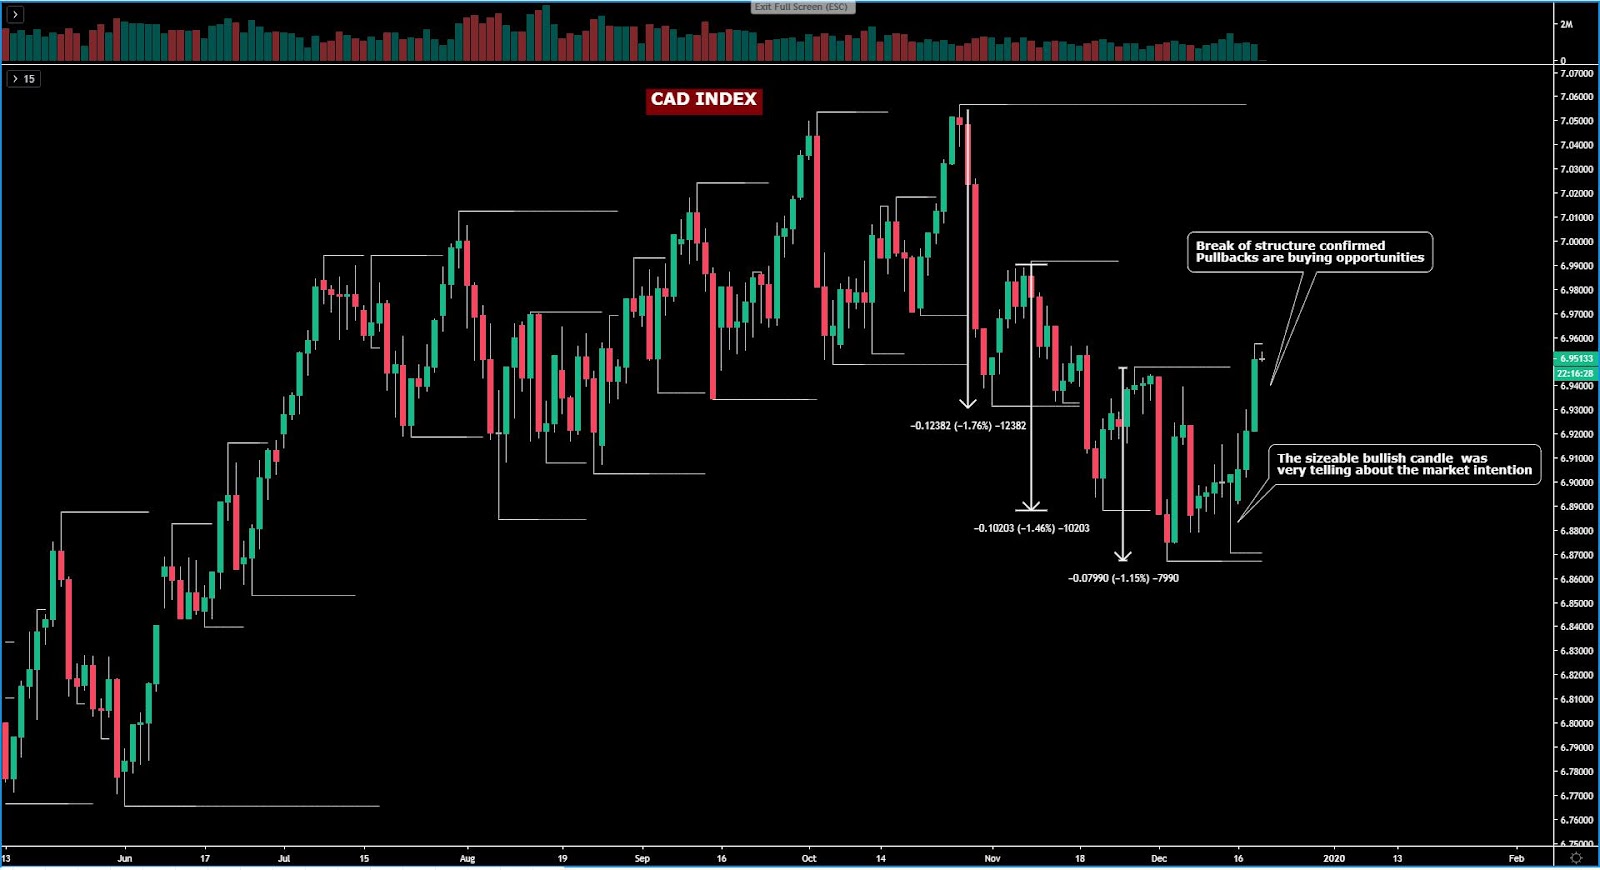
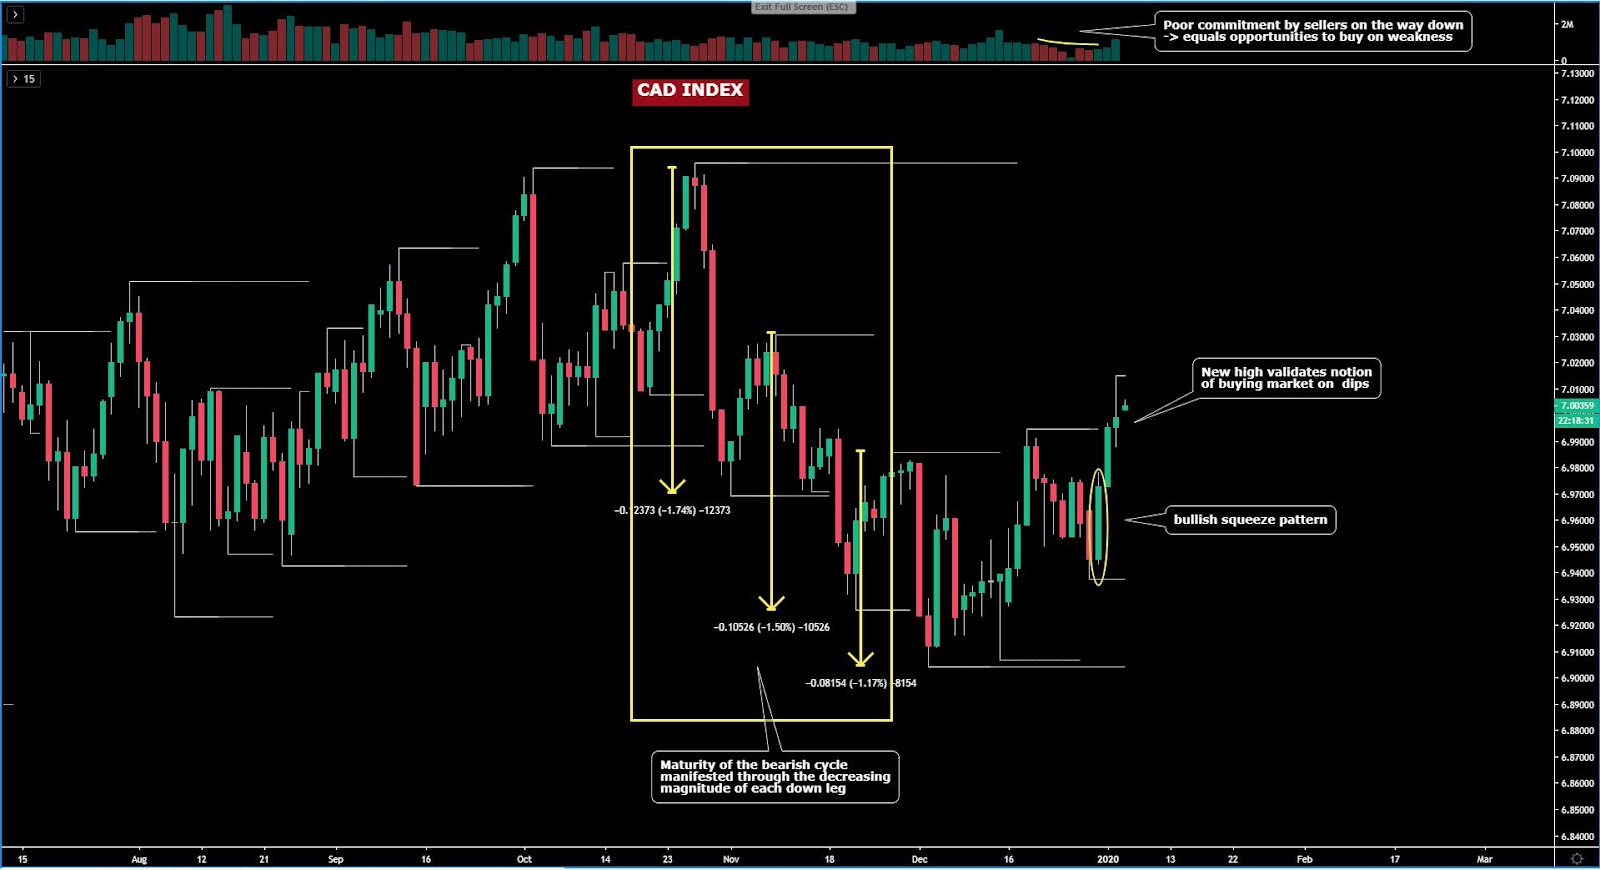
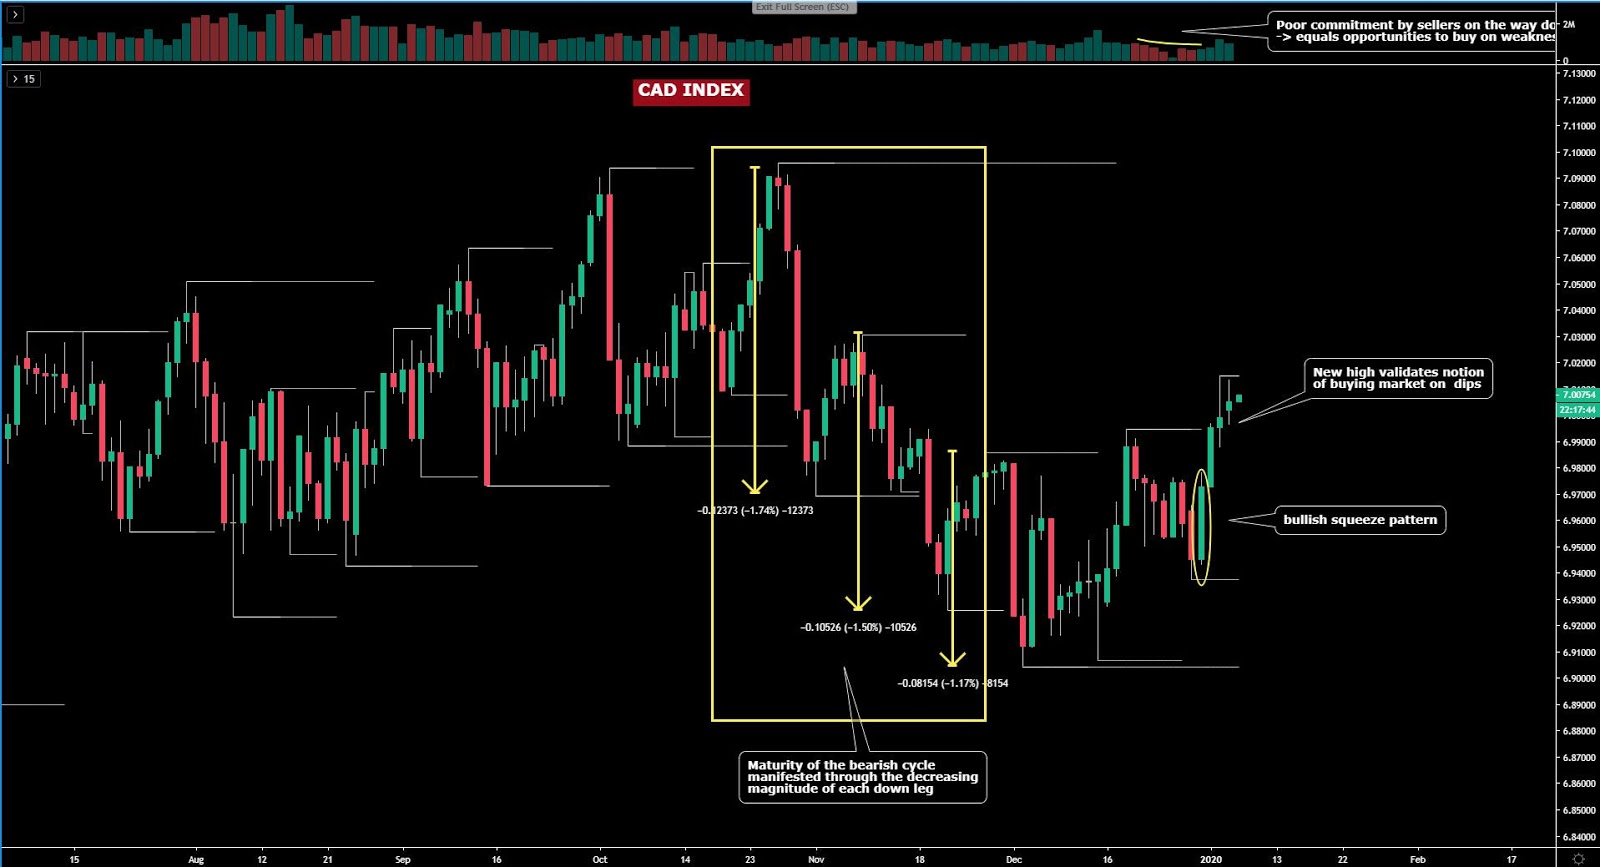
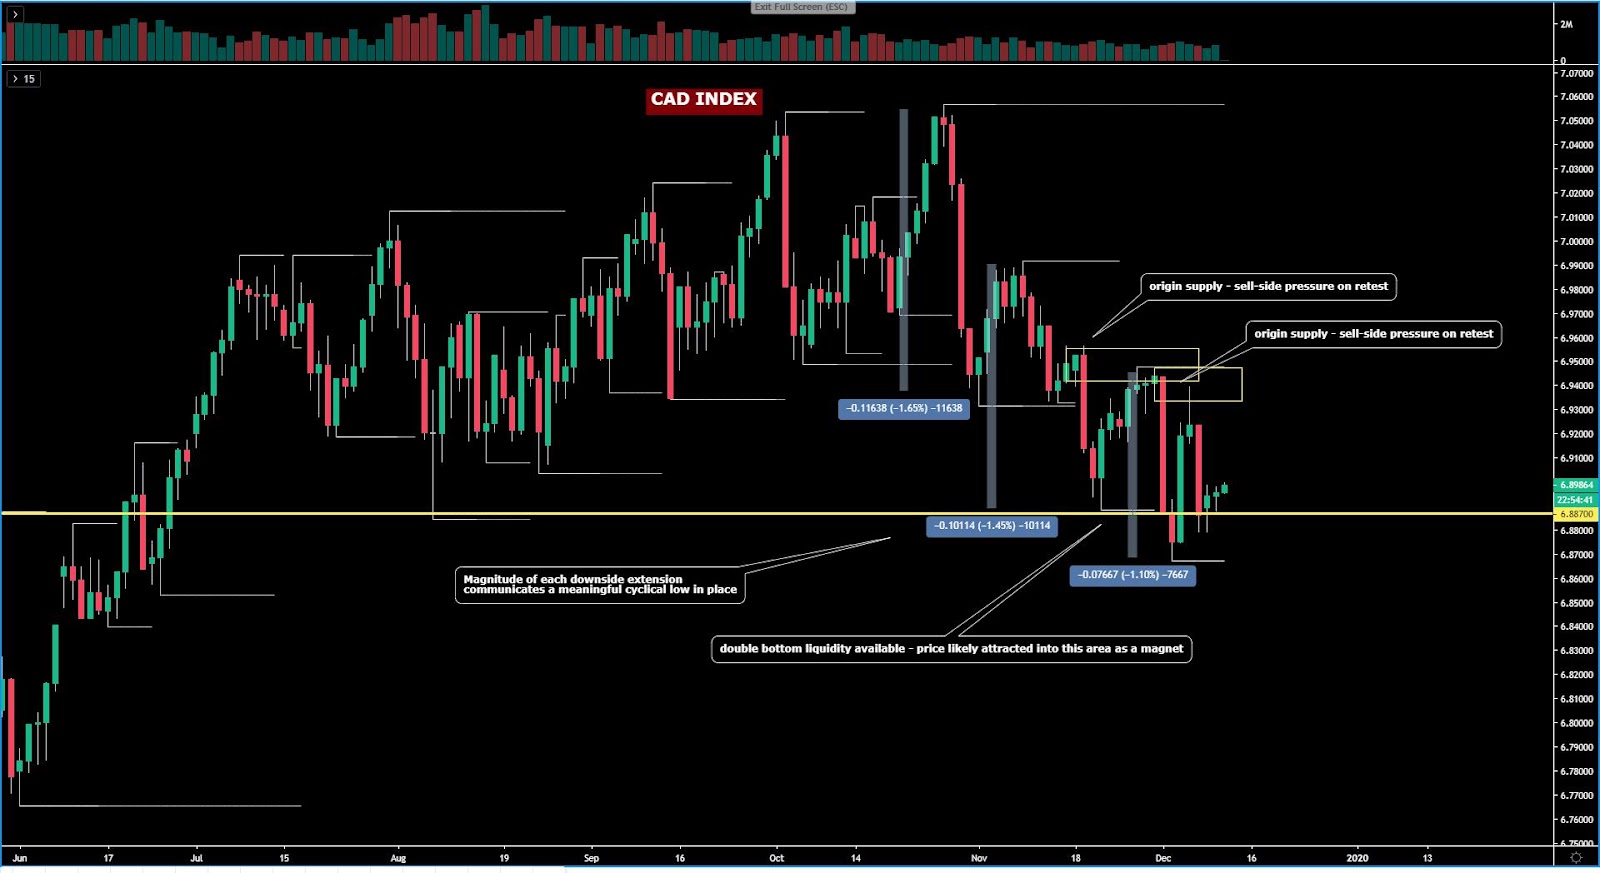
The CAD index may be on the cusp of a meaningful bottom judging by the maturity of its downcycle. This is a view I have been endorsing since the last sell-off pre-BOC and its backing is predicated on the fact that each leg down has carried lesser commitment - magnitude of the downside extension - than the previous (-1.65%, -1.45%, -1.10%). This premise is mainly anchored by the latest BOC decision, which appeased the prospects of a rate cut, to the point that it should override somehow the horrible Canadian jobs report printed last Friday.
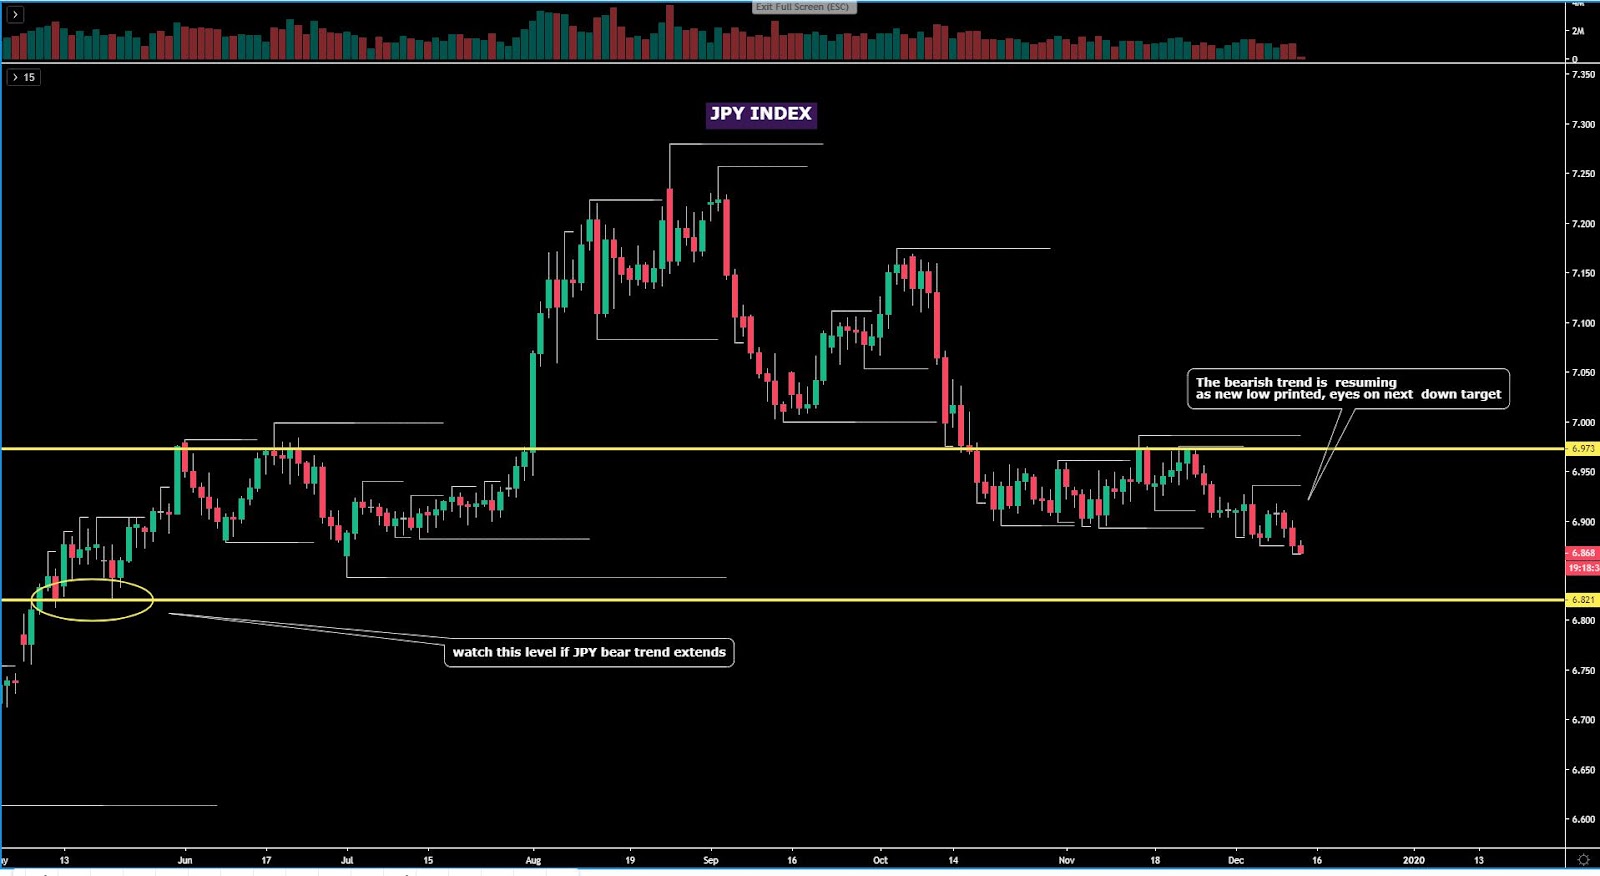
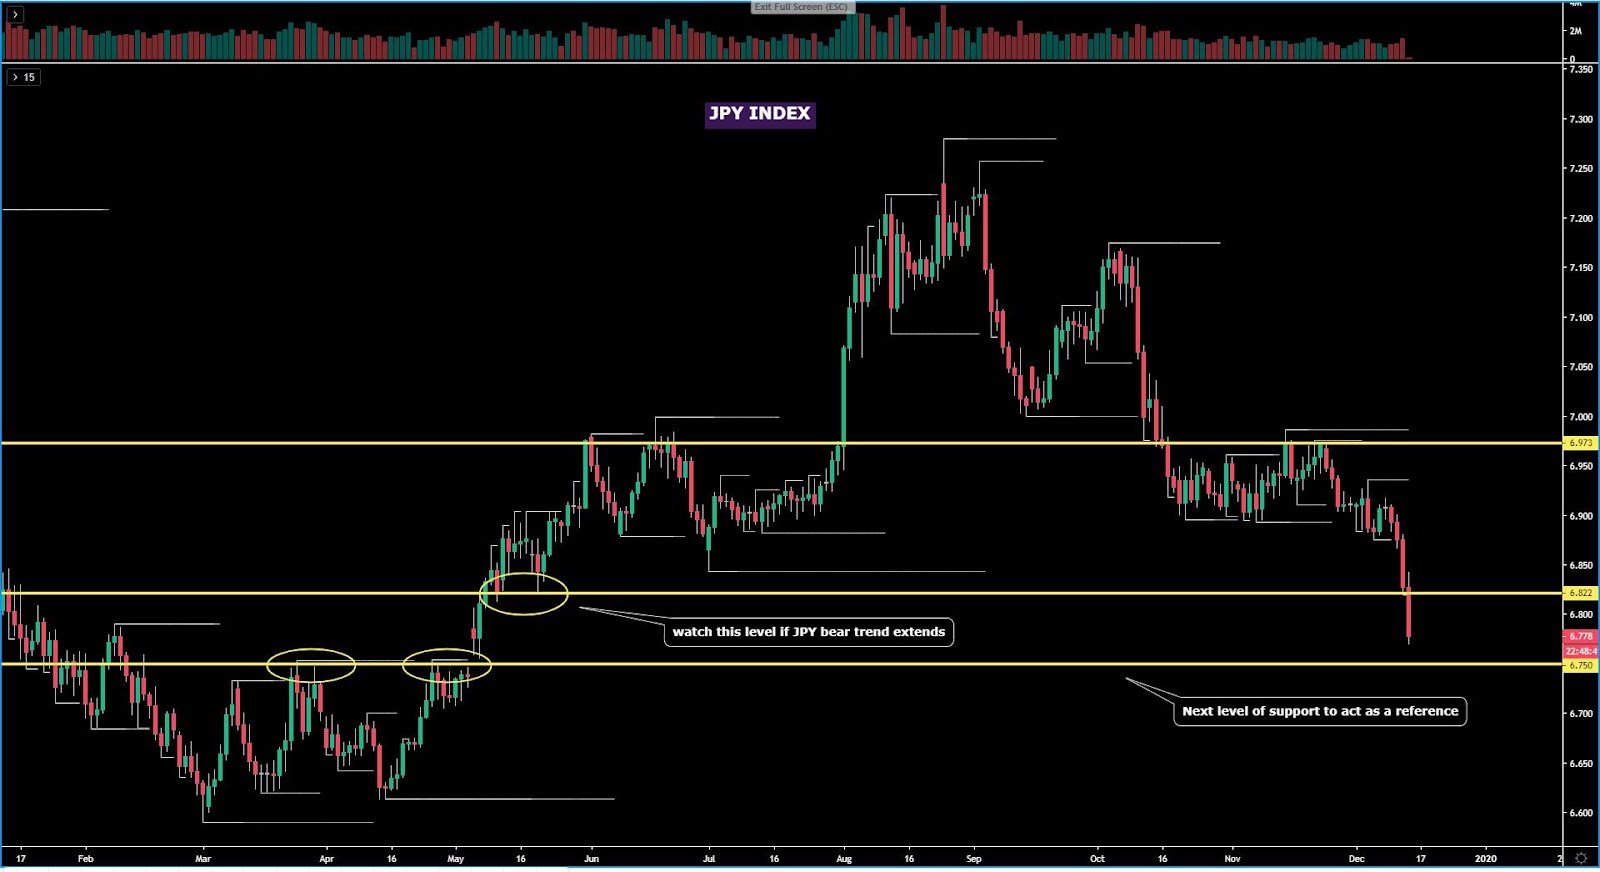
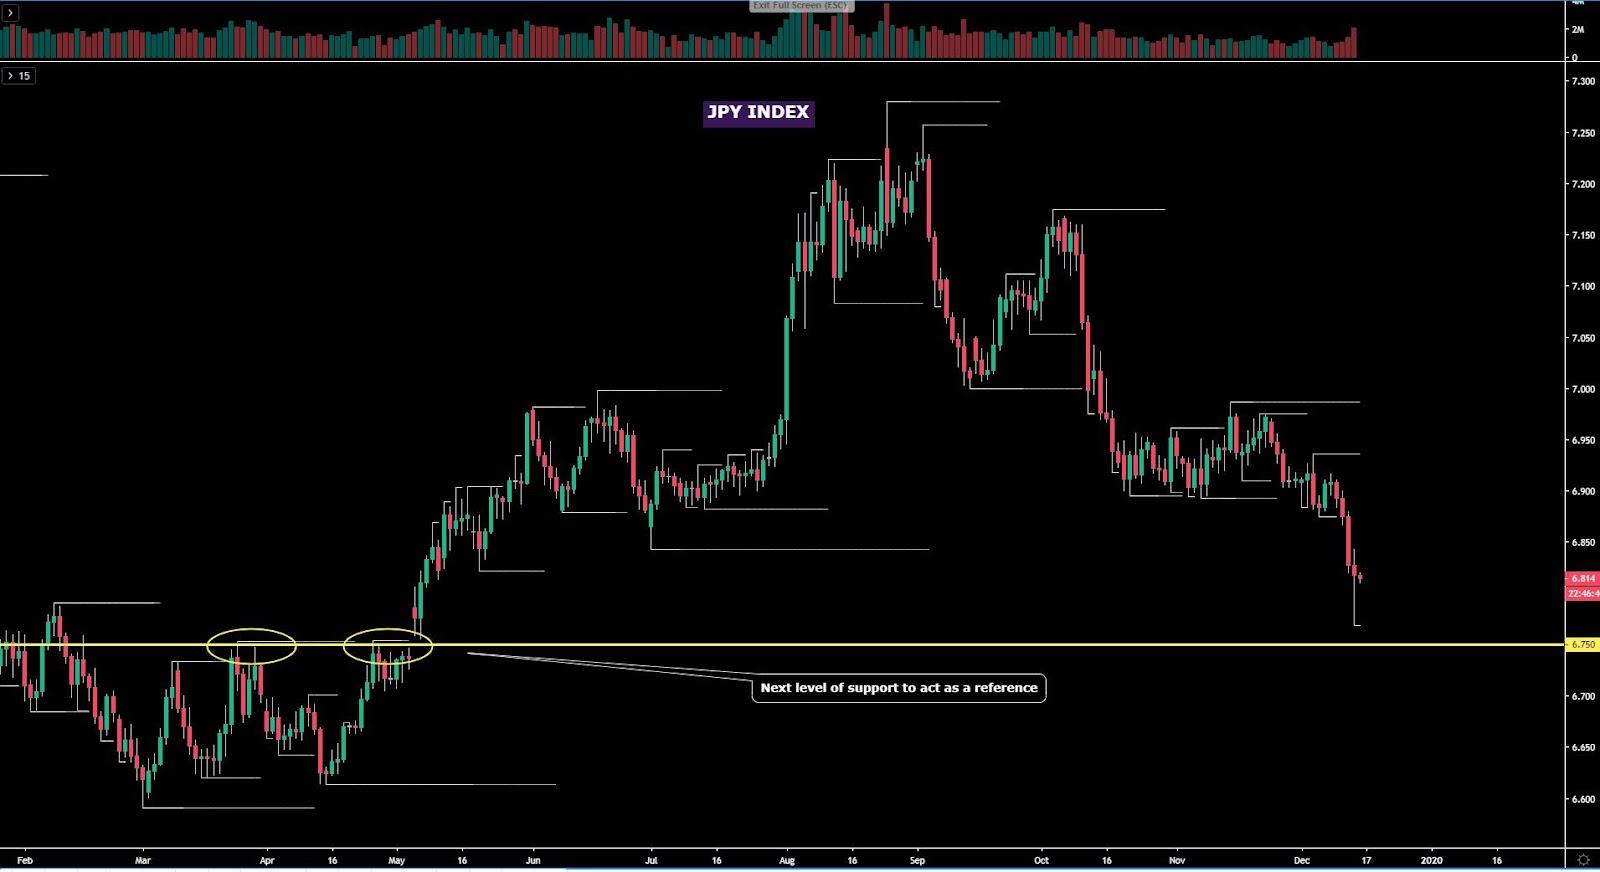
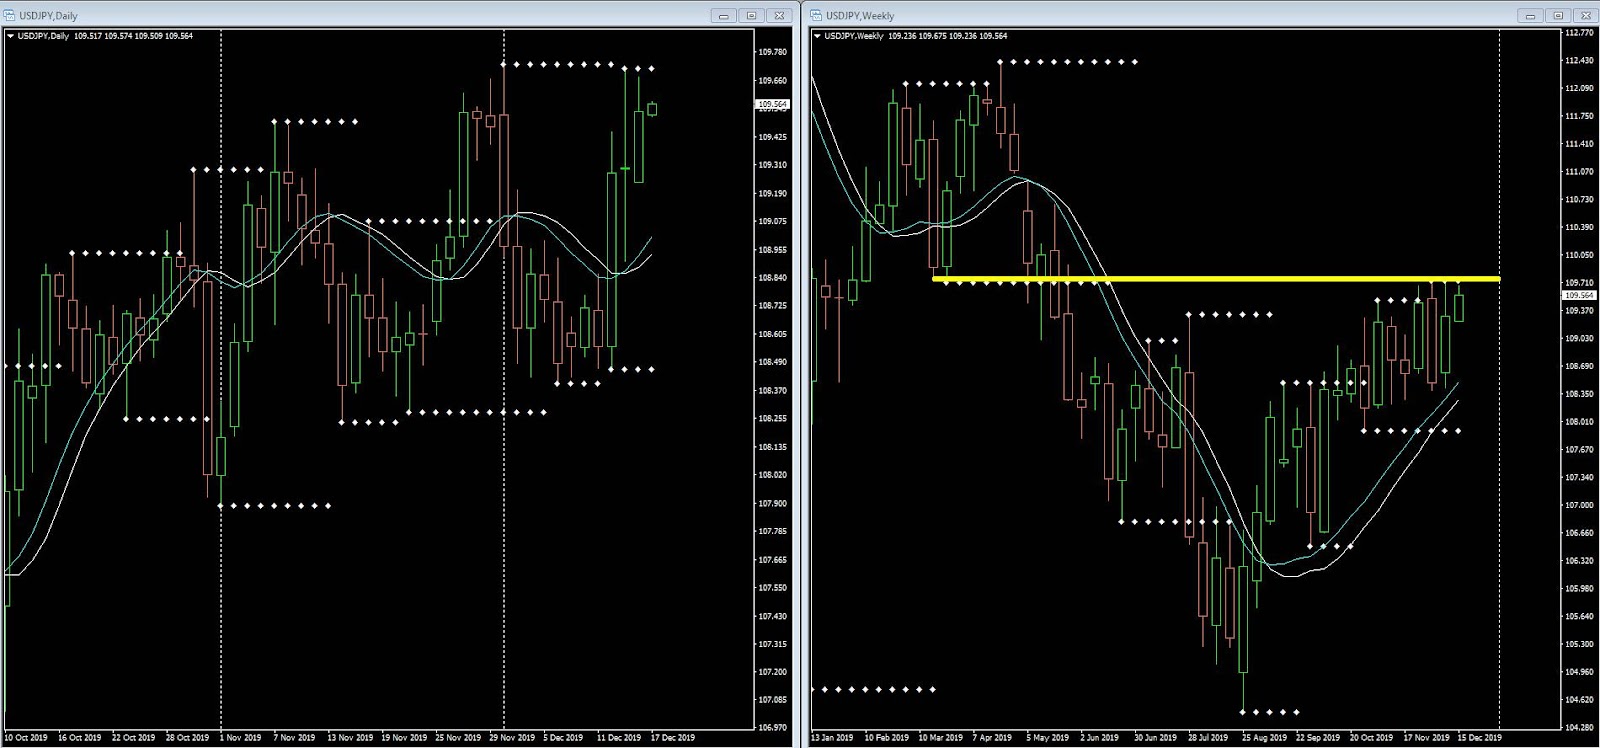
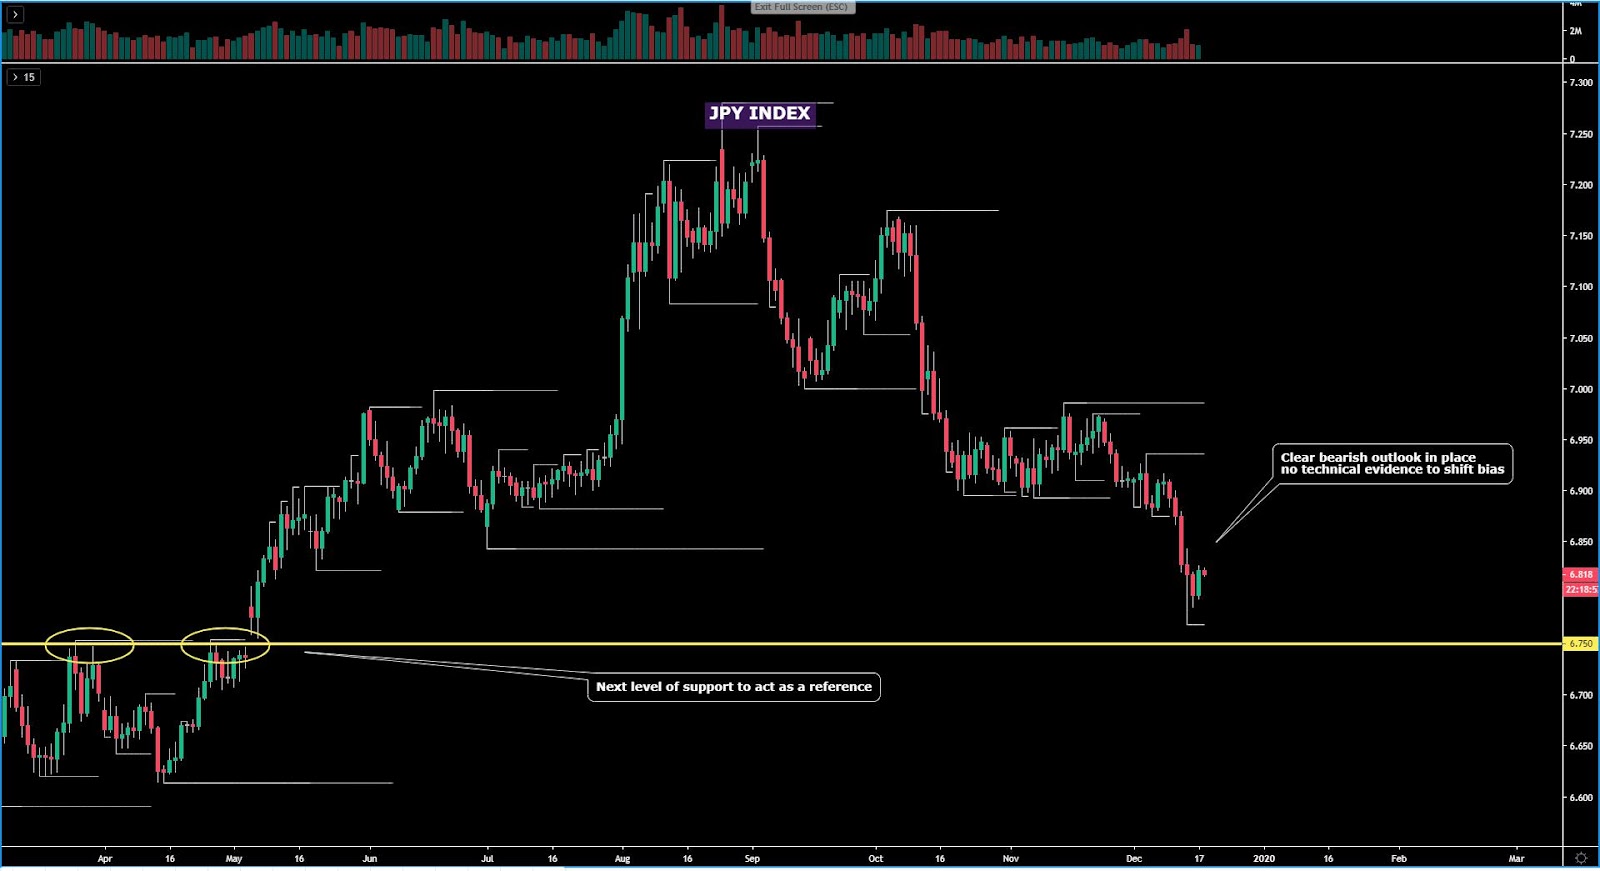
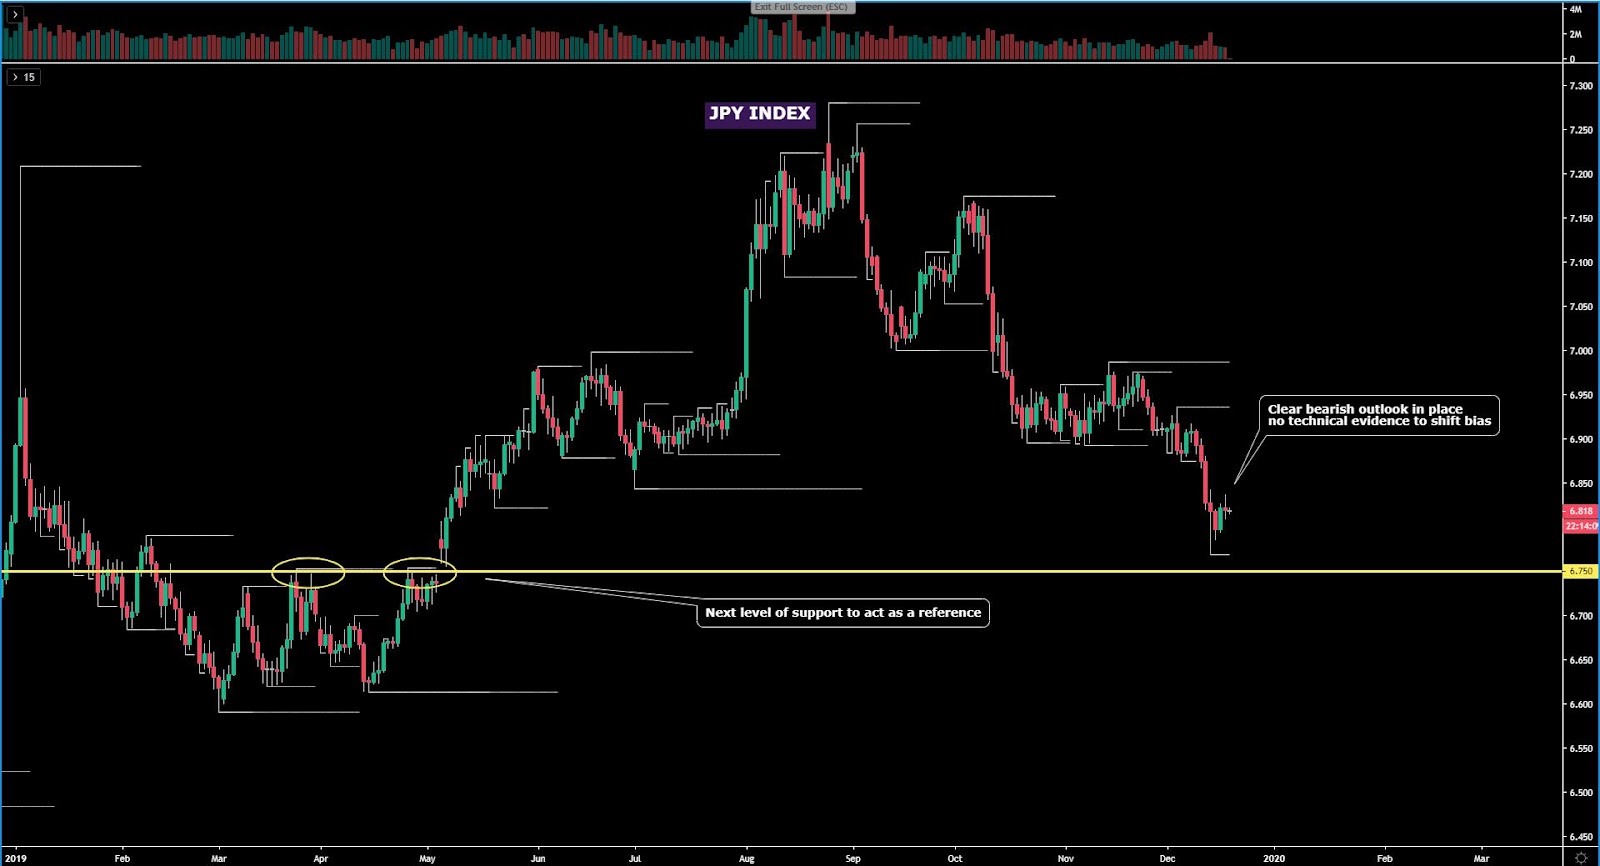
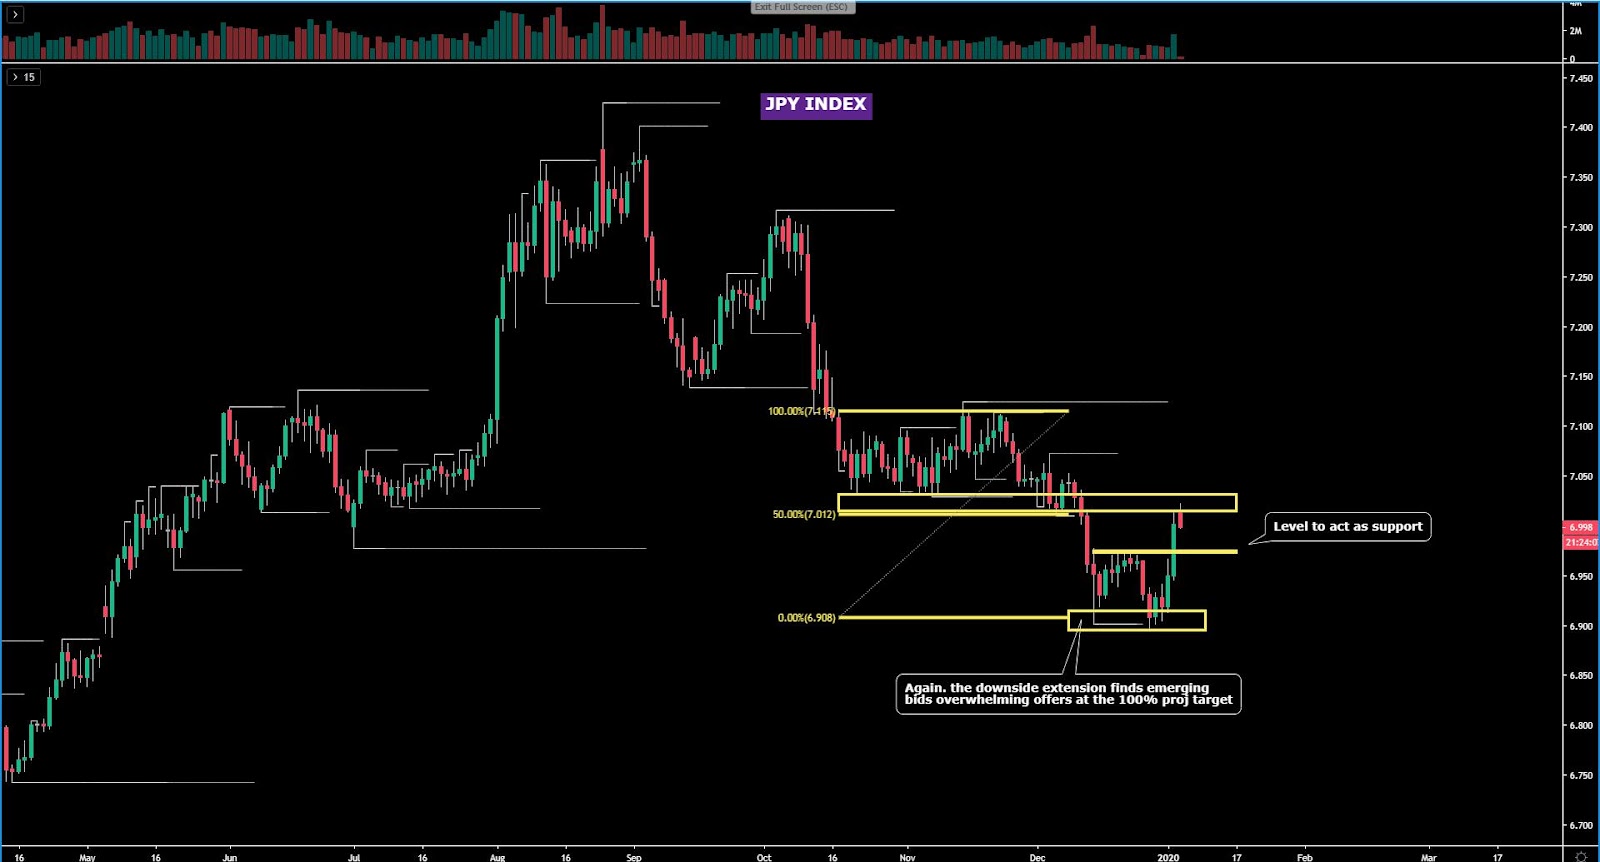
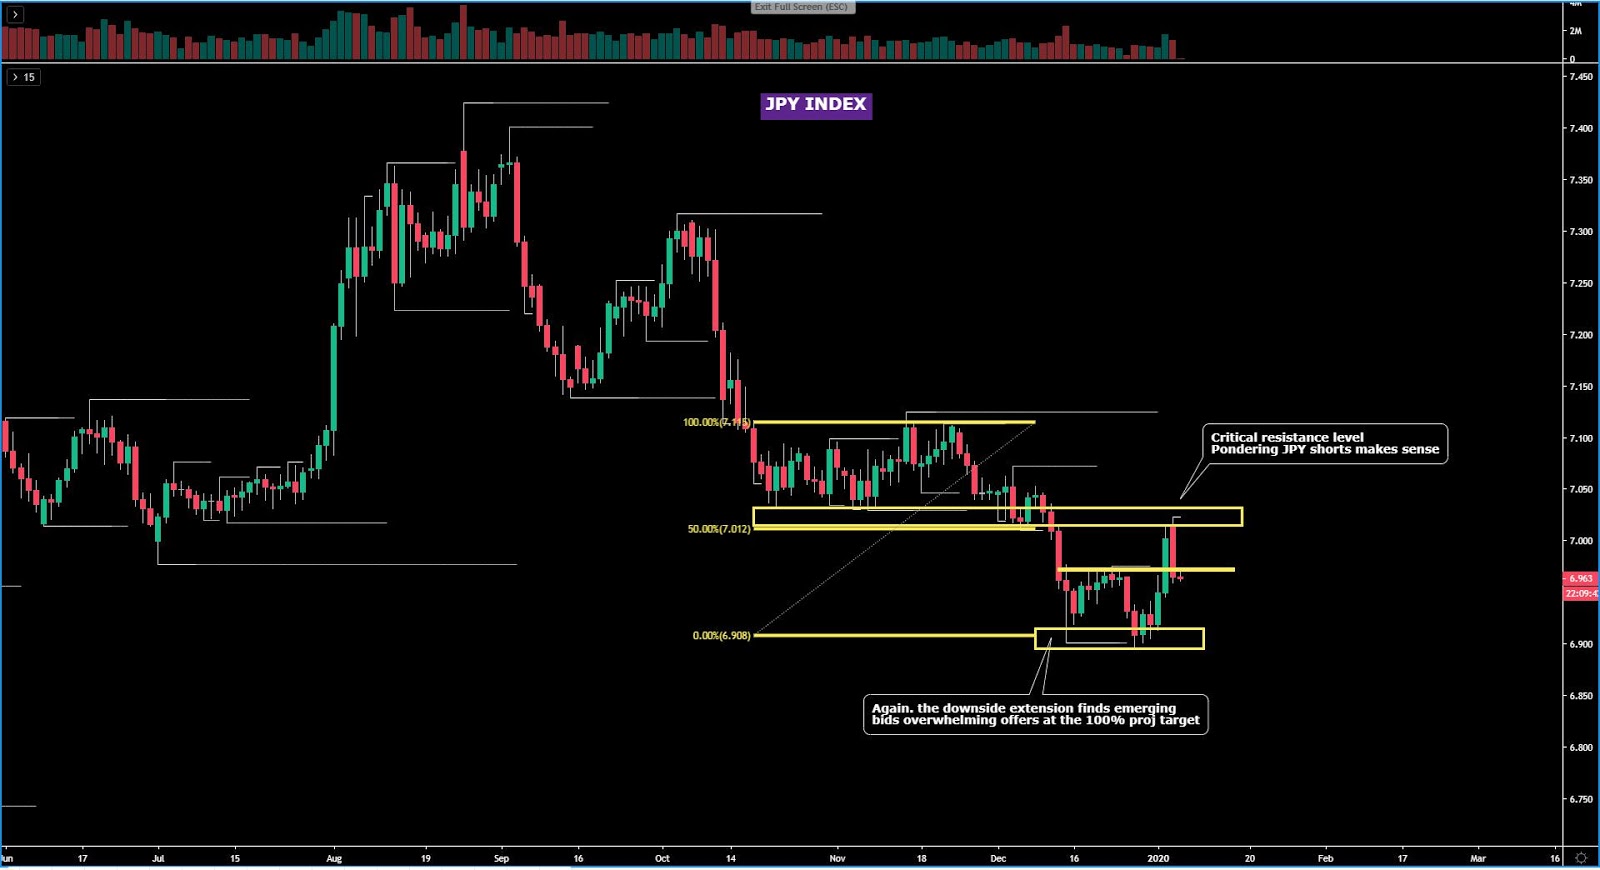
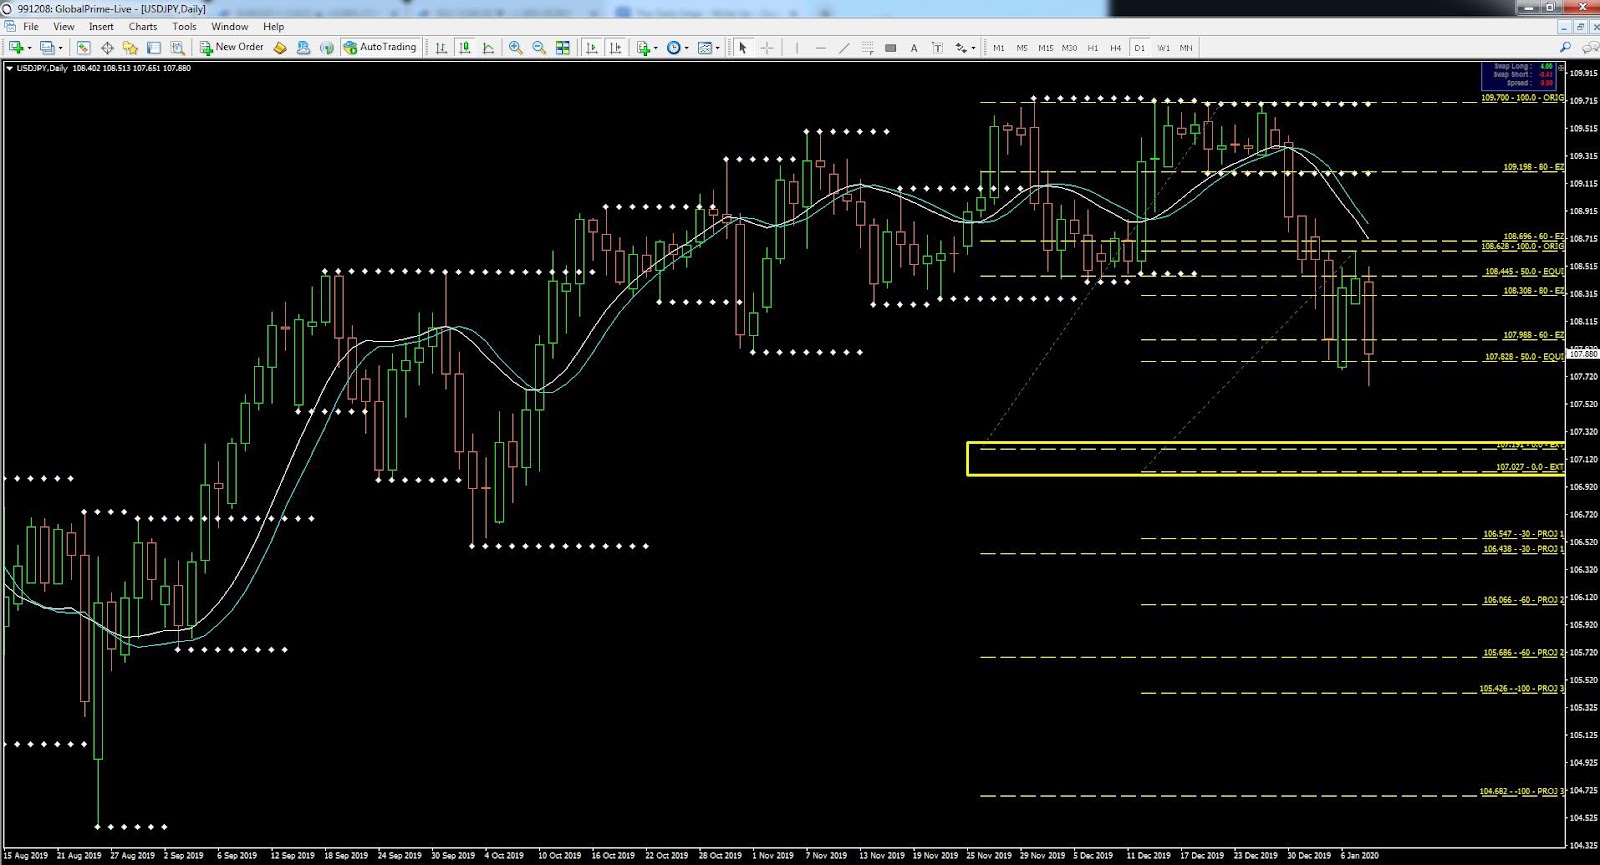
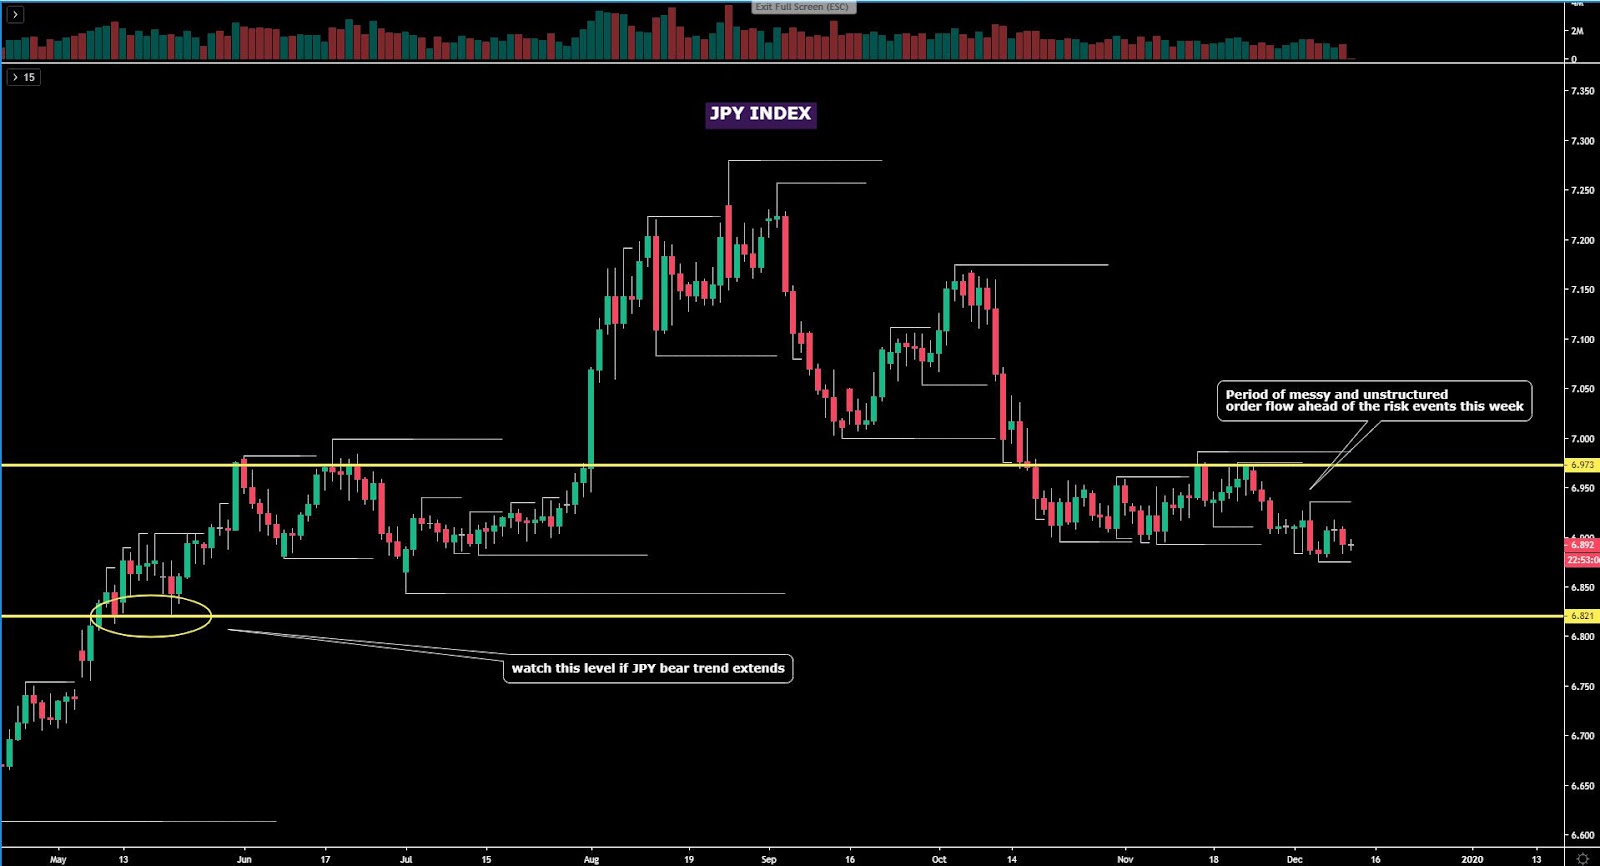
The JPY index, if only judged by its most recent price action over the last week, still shows moderate bearish tendencies, even if the lack of any downside momentum makes it hard to crystalize with conviction a particular direction. When one adds to the mix the raft of risk events in line, it is no wonder that the market fails to manifest, via its aggregated flows, a clear picture as the market has dialed down its commitment to take any aggressive bets. Bottom line, the Yen is in a ‘wait and see’ mode going nowhere fast until the market digests the risks to come.
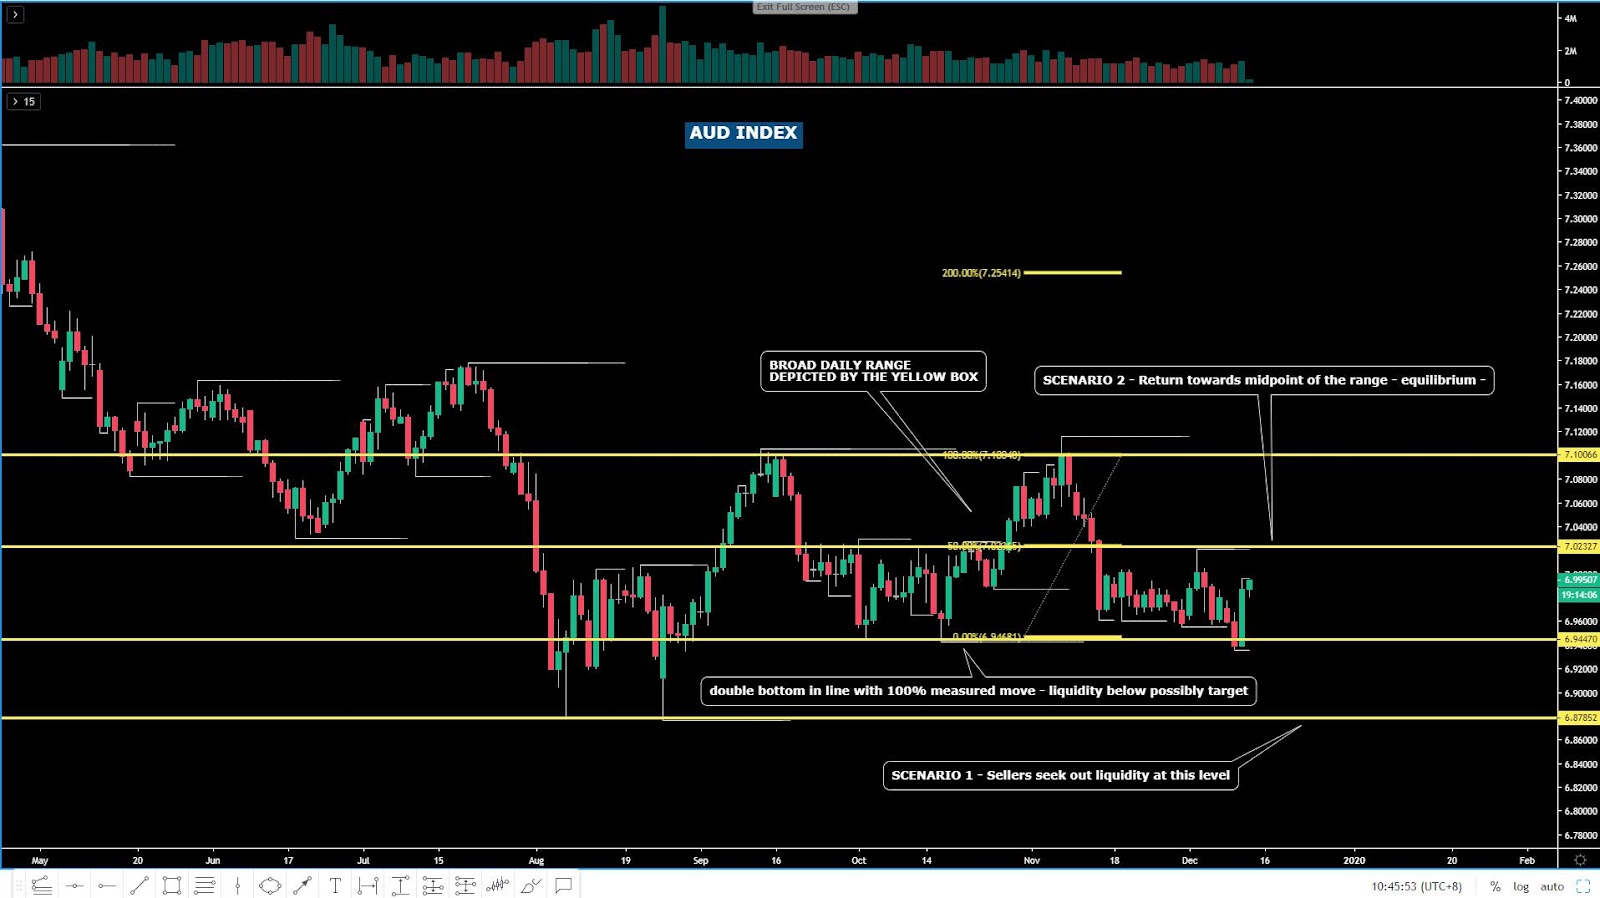
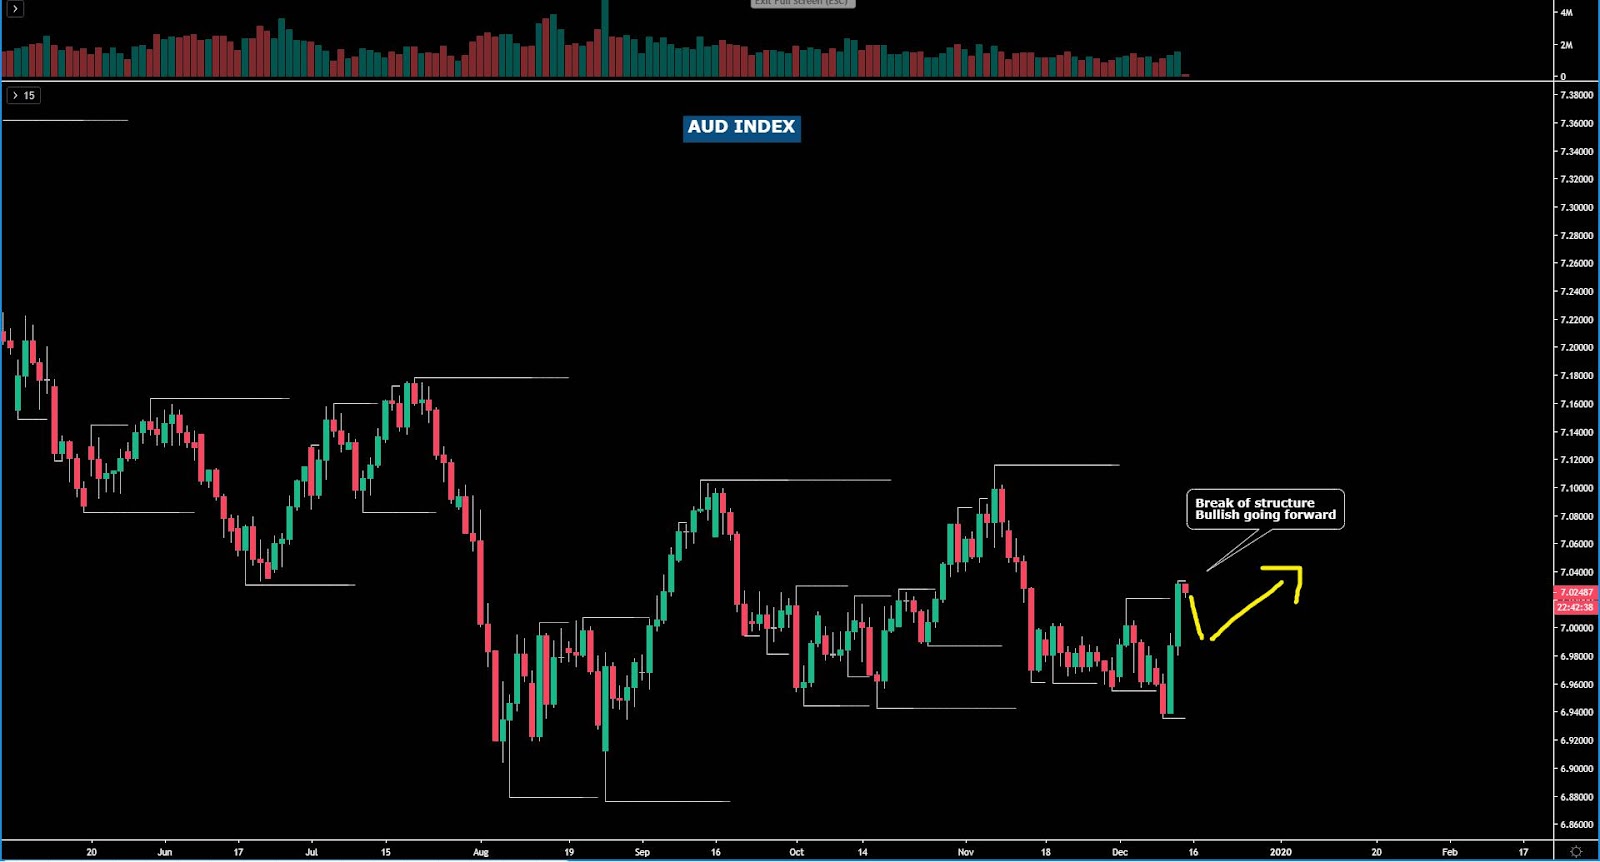
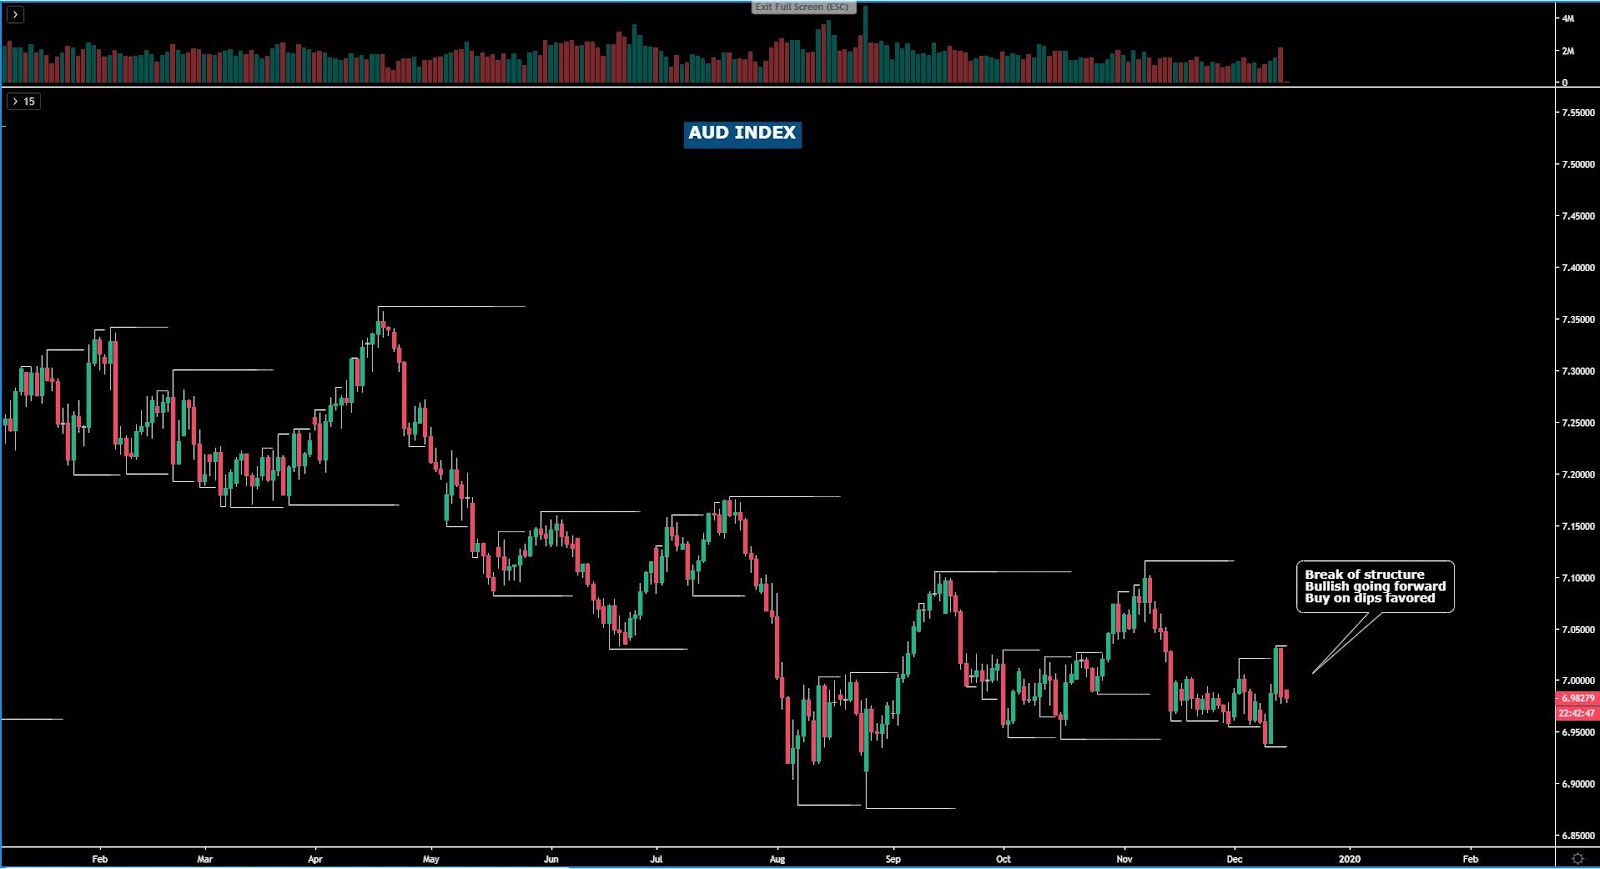
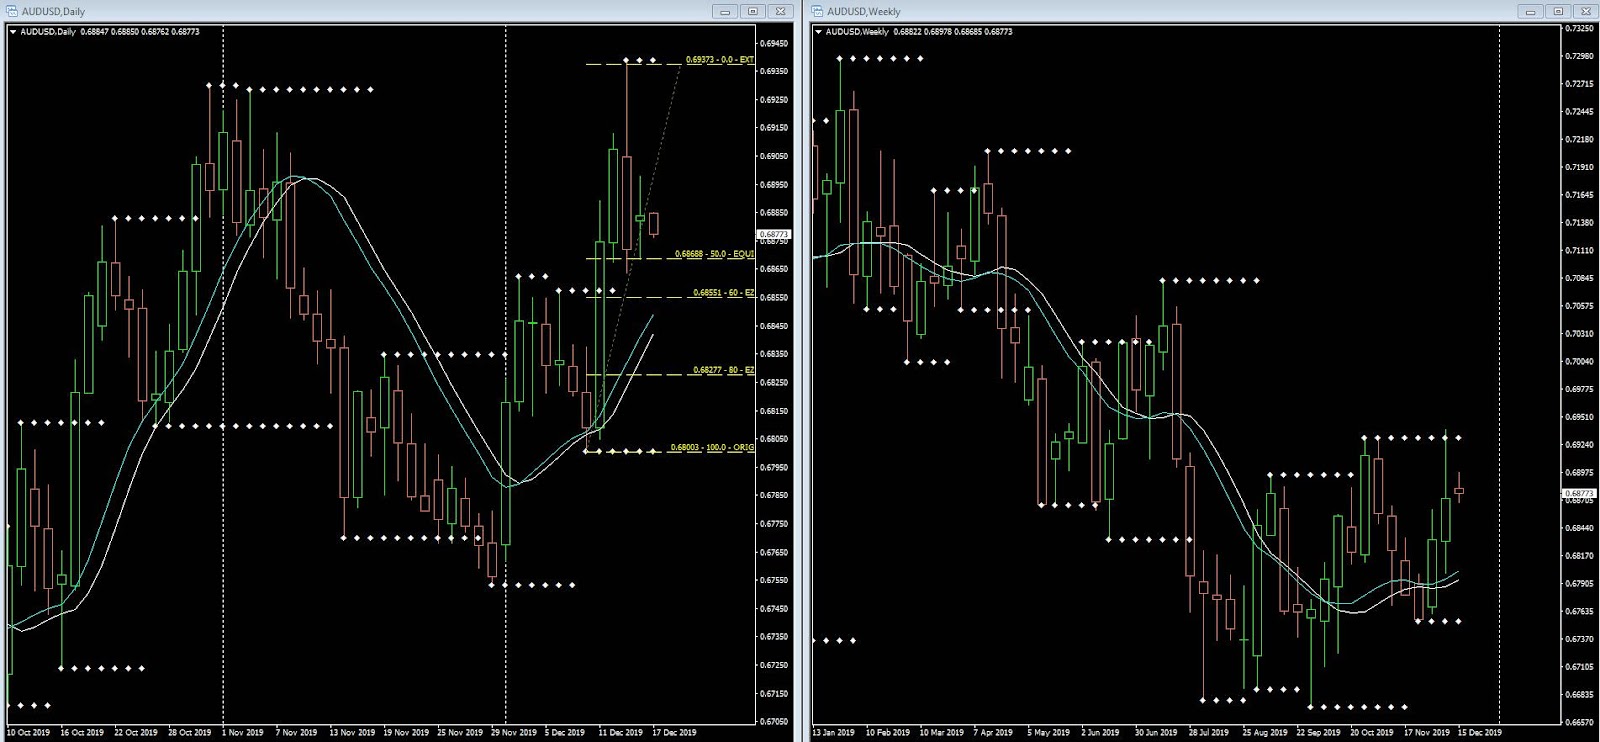
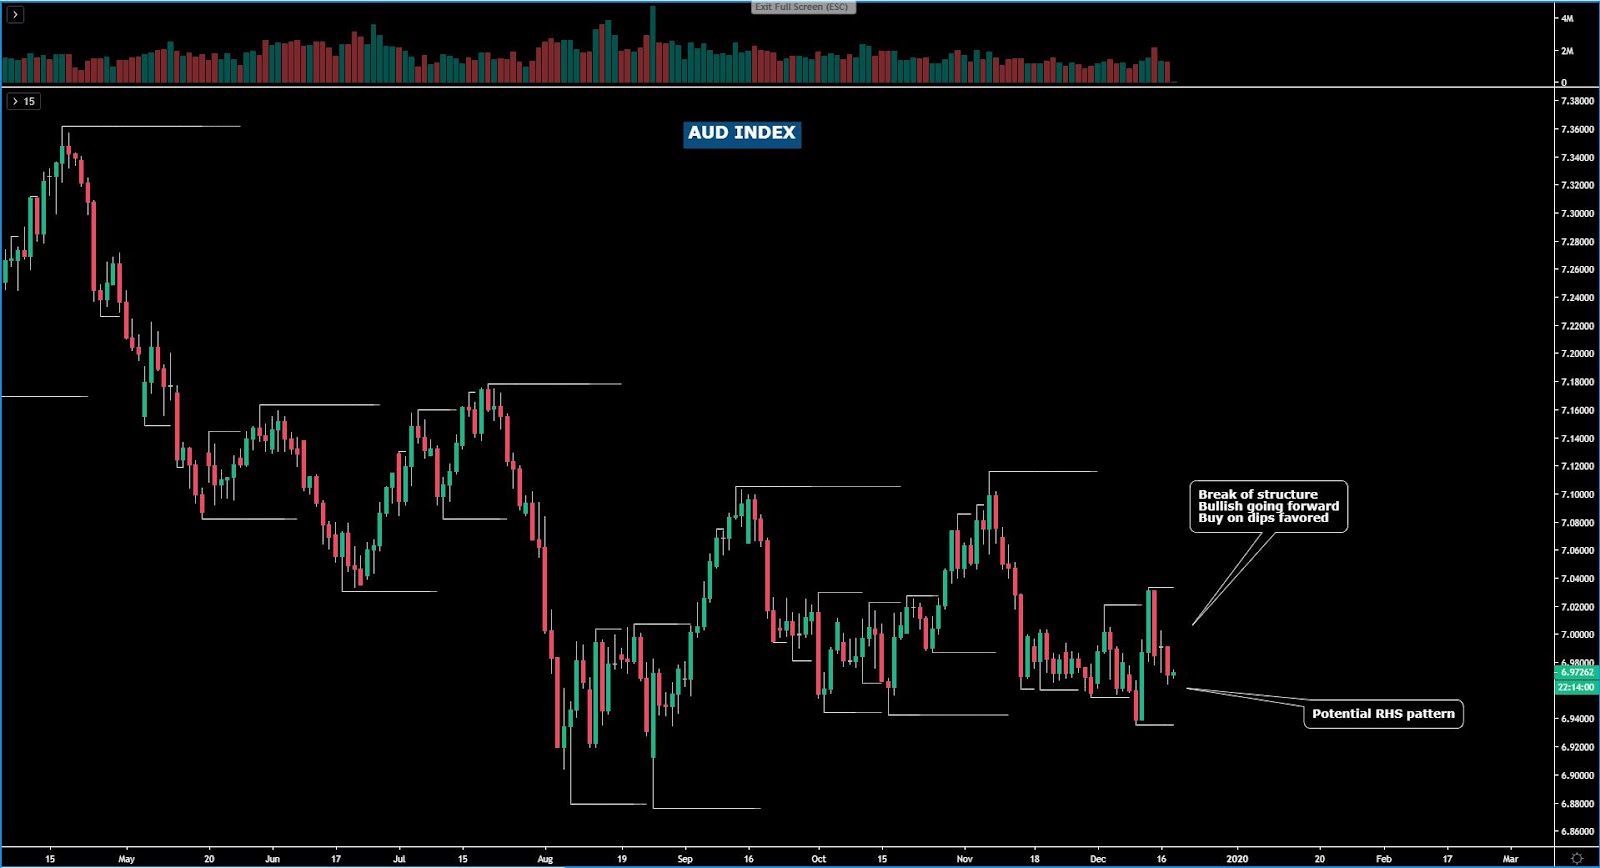
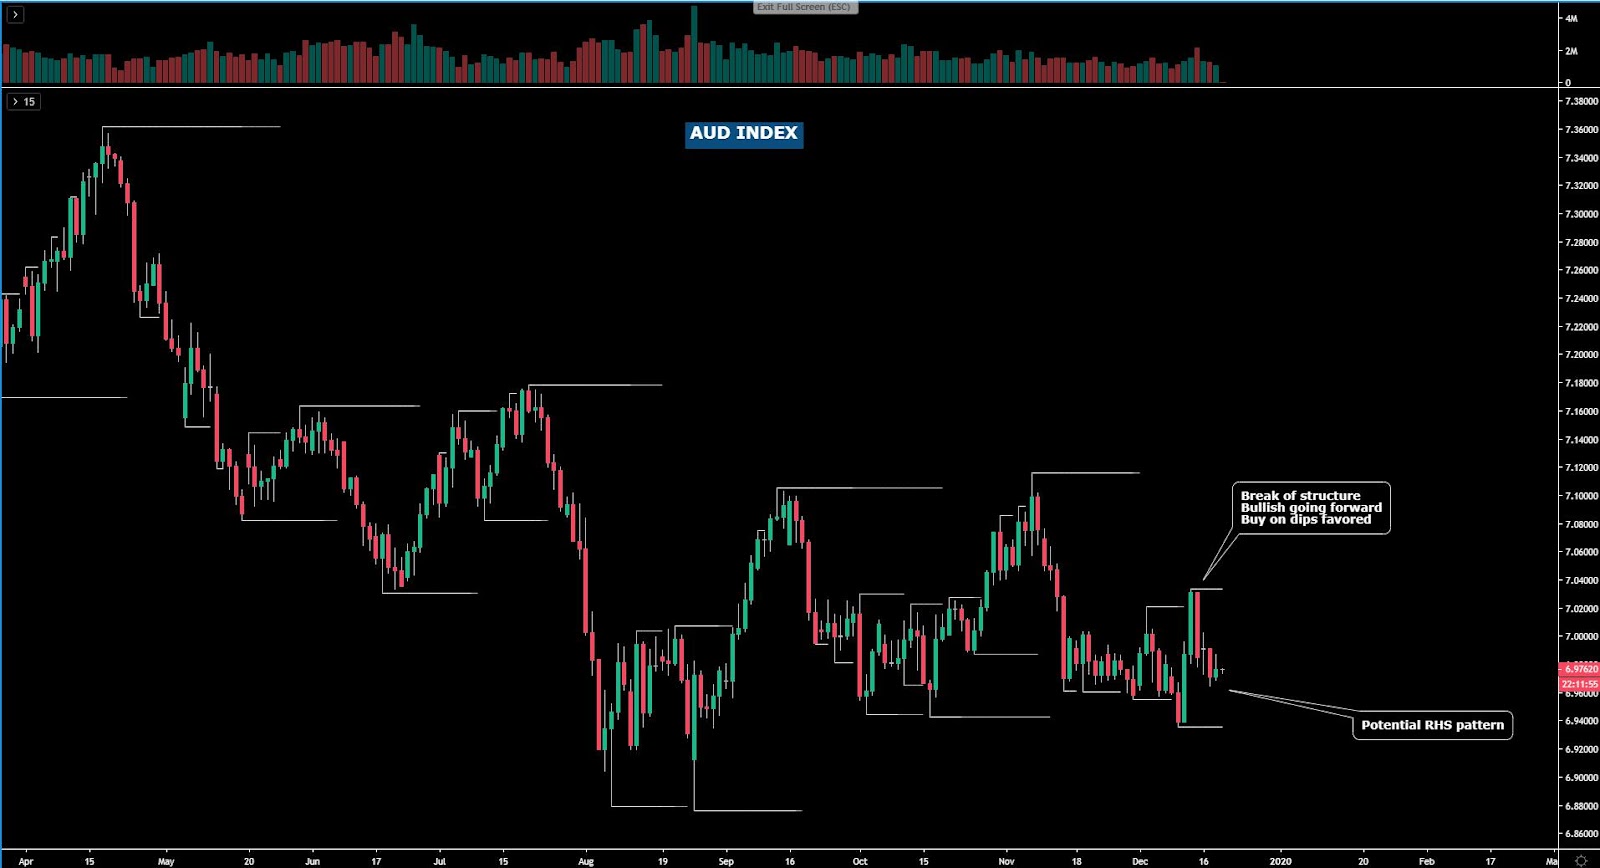
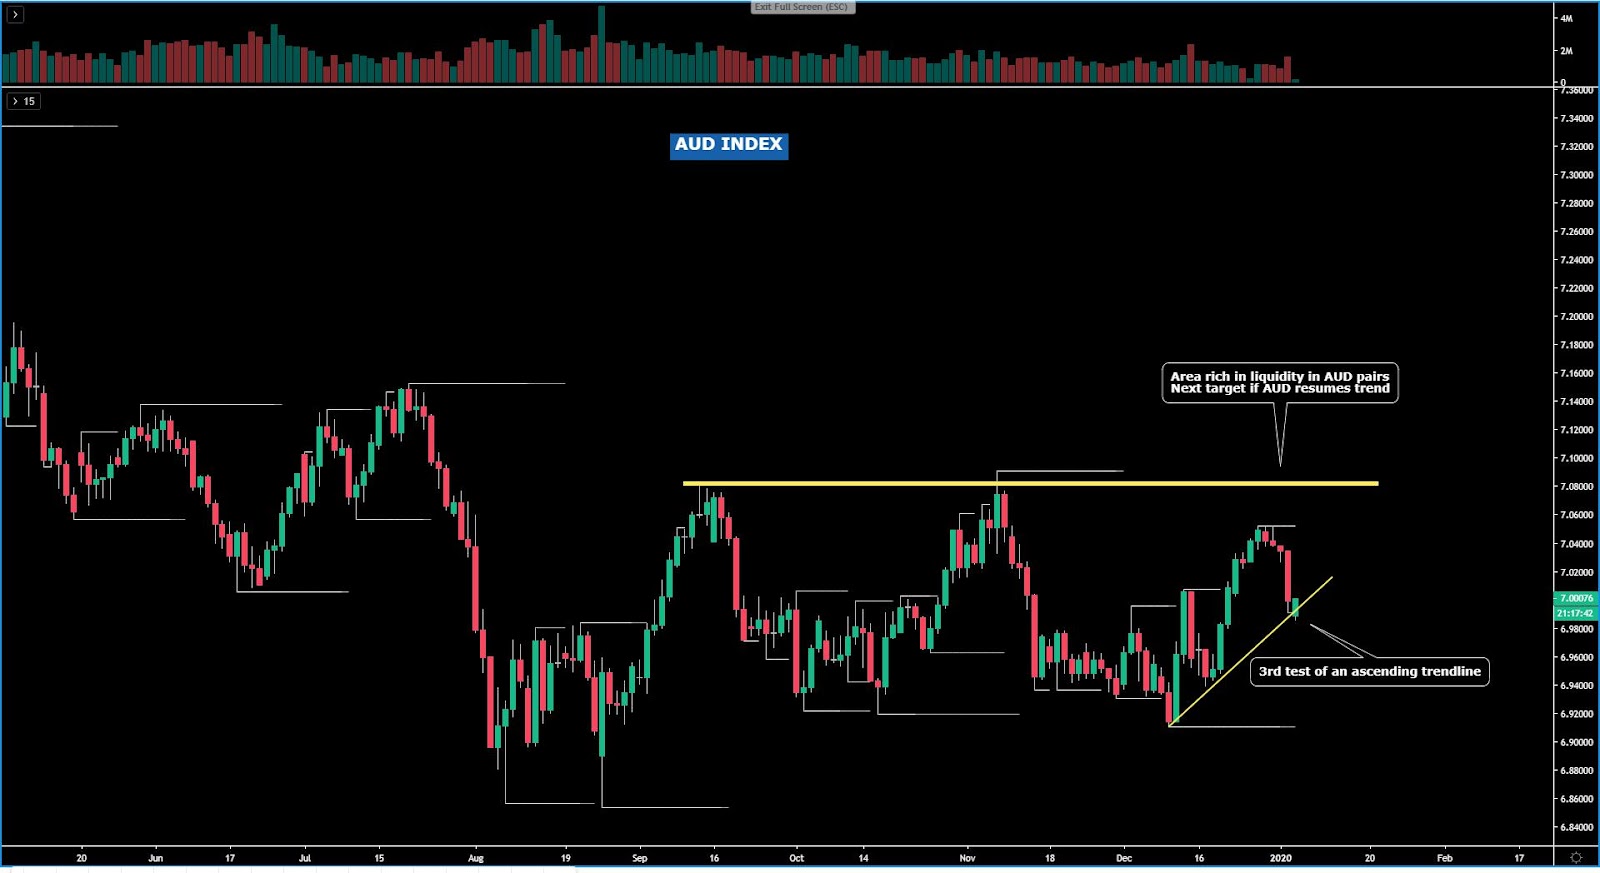
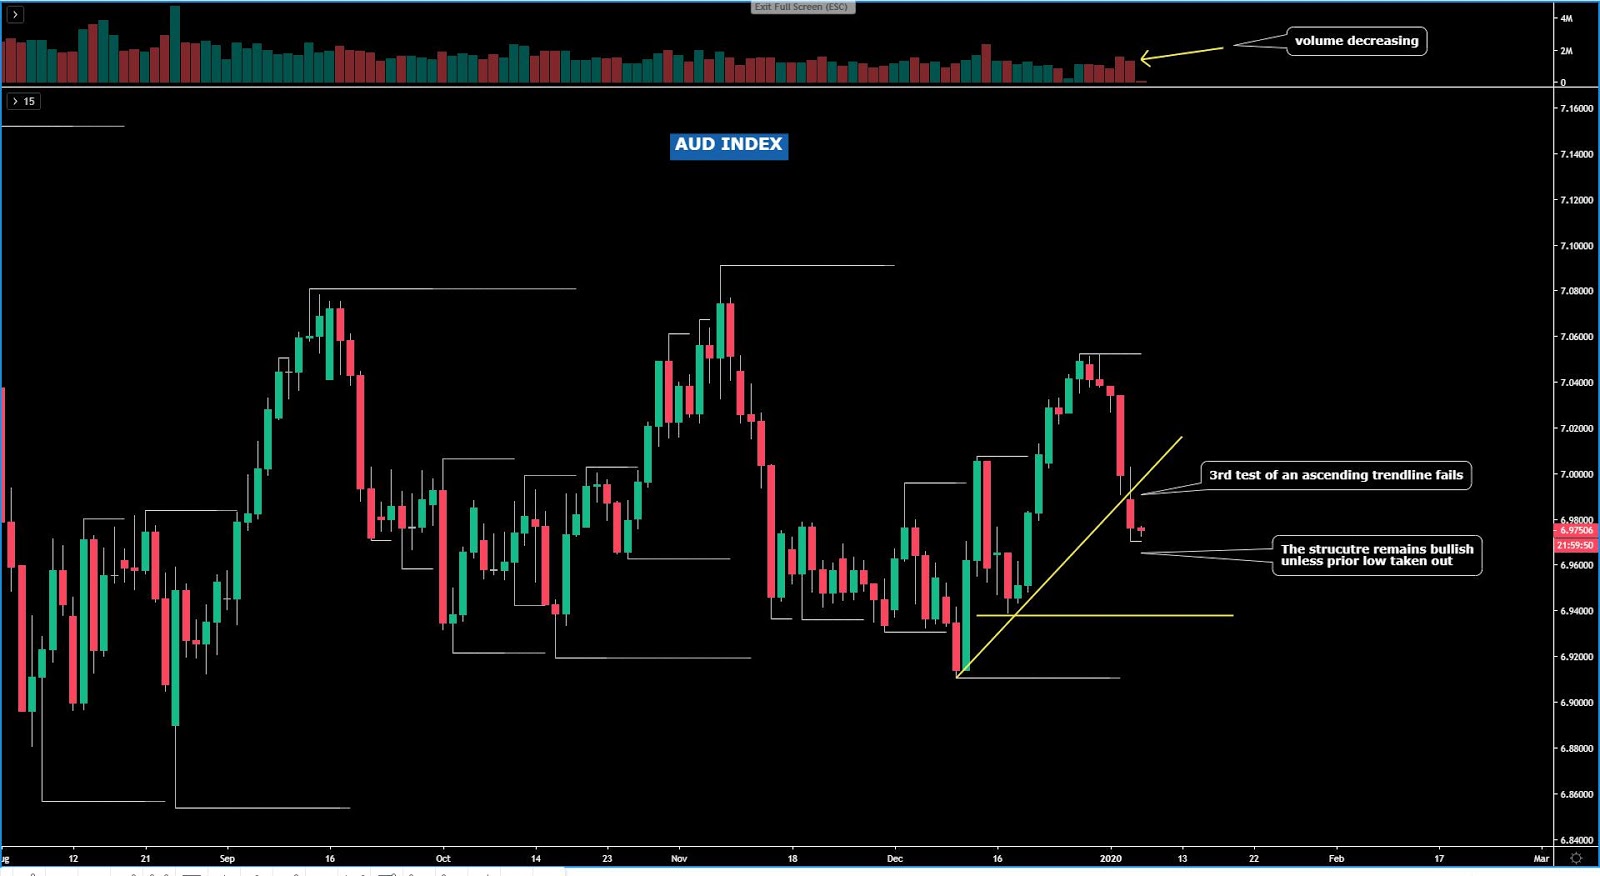
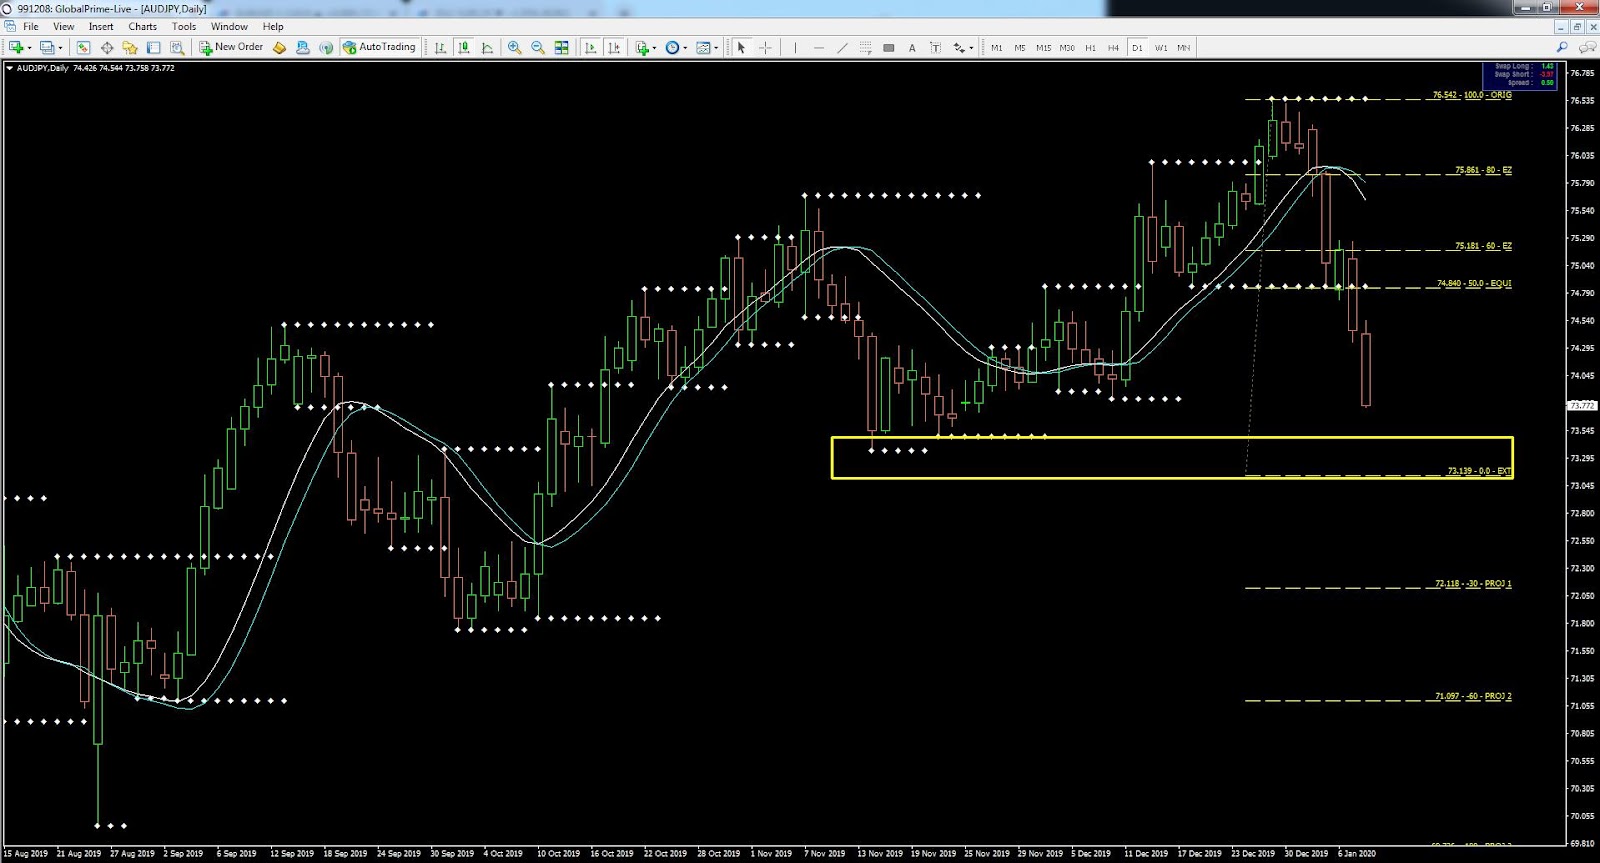
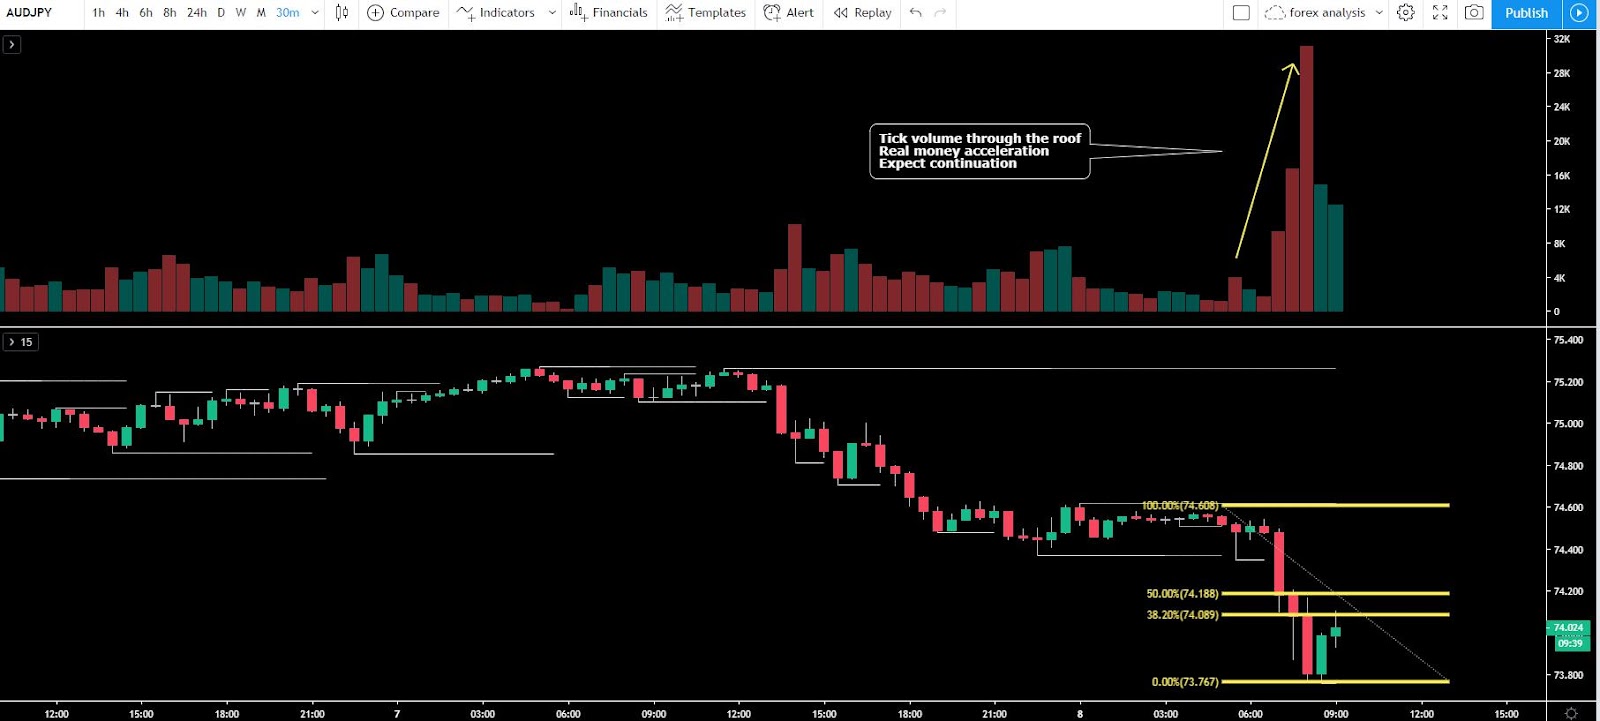
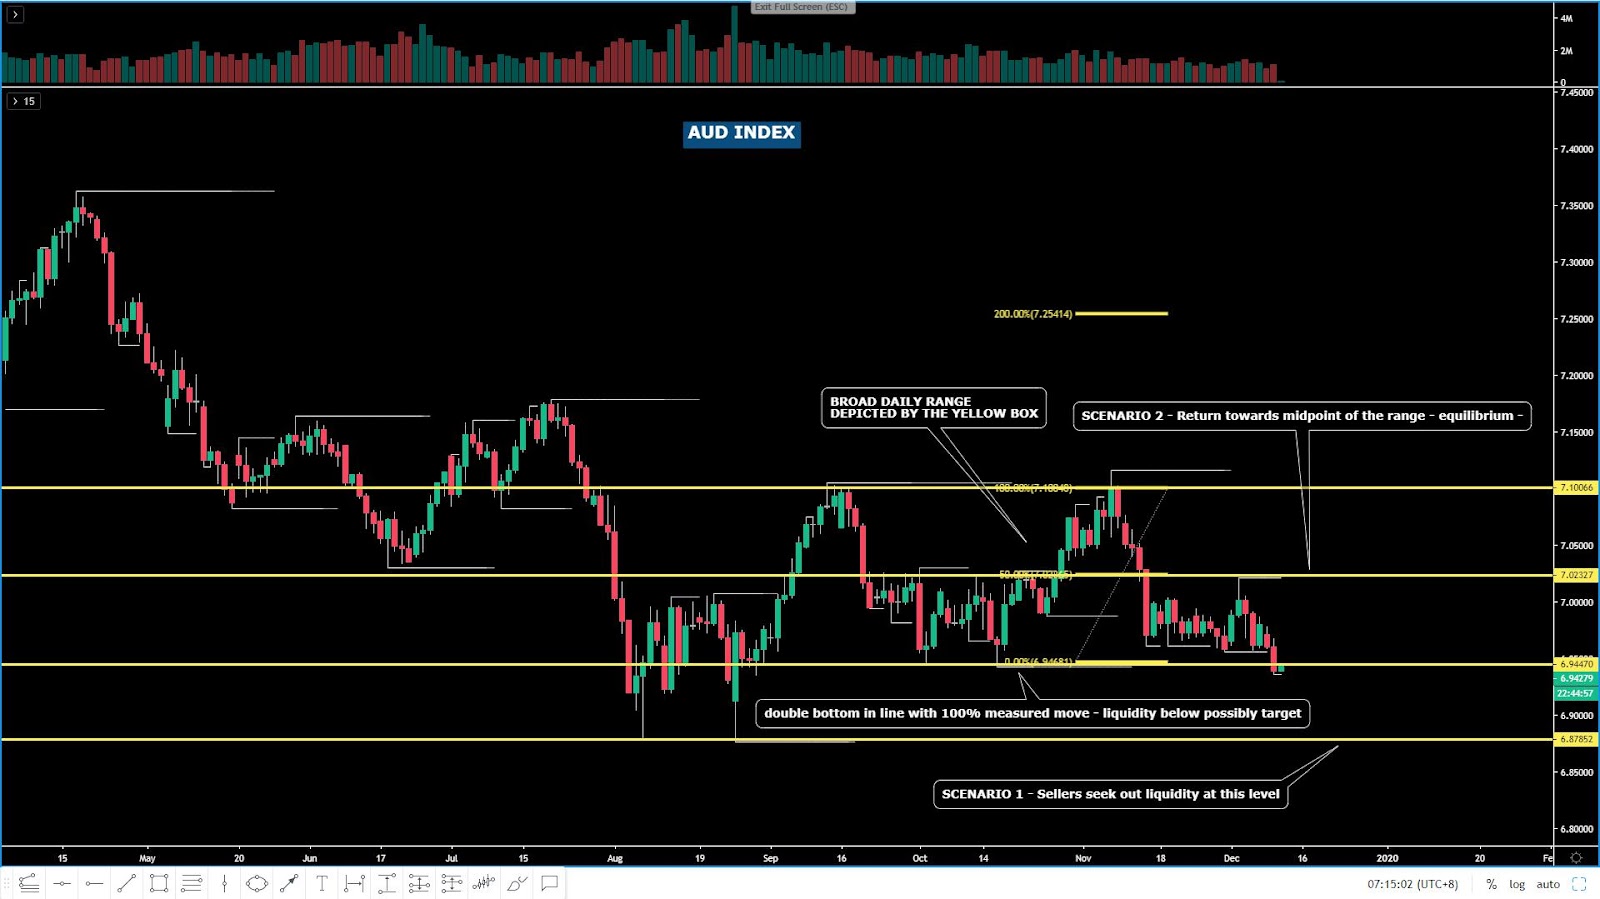
The AUD index continues to be a laggard in FX and as feared, the double bottom eventually got raided as the next logical target where plenty of liquidity would have been available in AUD-related pairs. The acceptance below this low should shift the focus towards this year’s double bottom formed in Aug-Sept. The market now awaits the binary outcome about Trump enacting or not the next round of tariffs to China. AUD will react the most as a proxy for China.
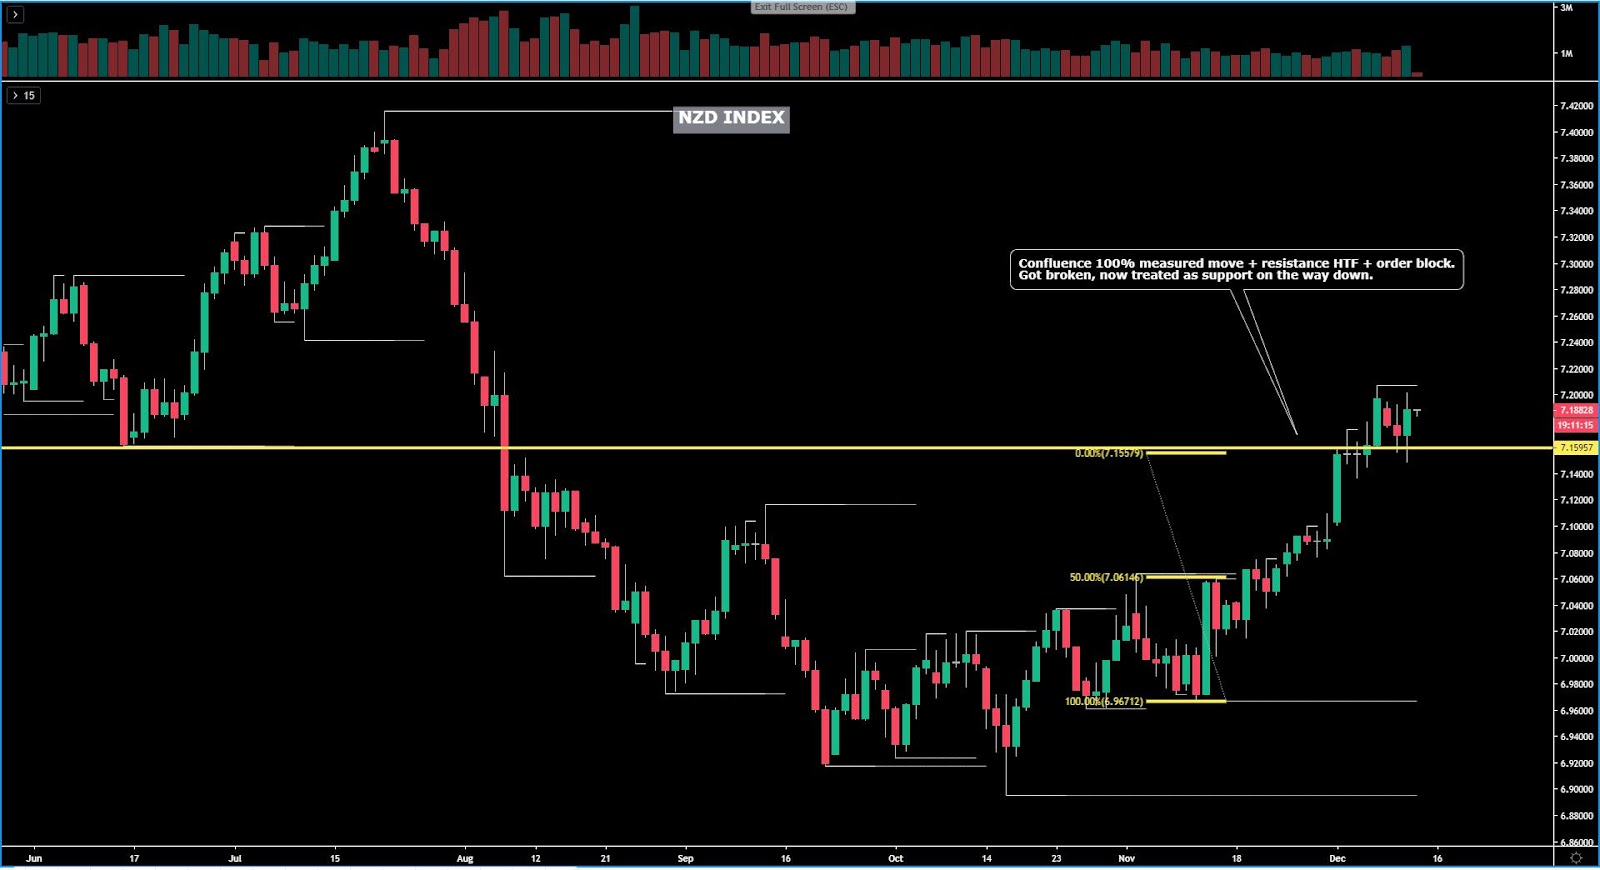
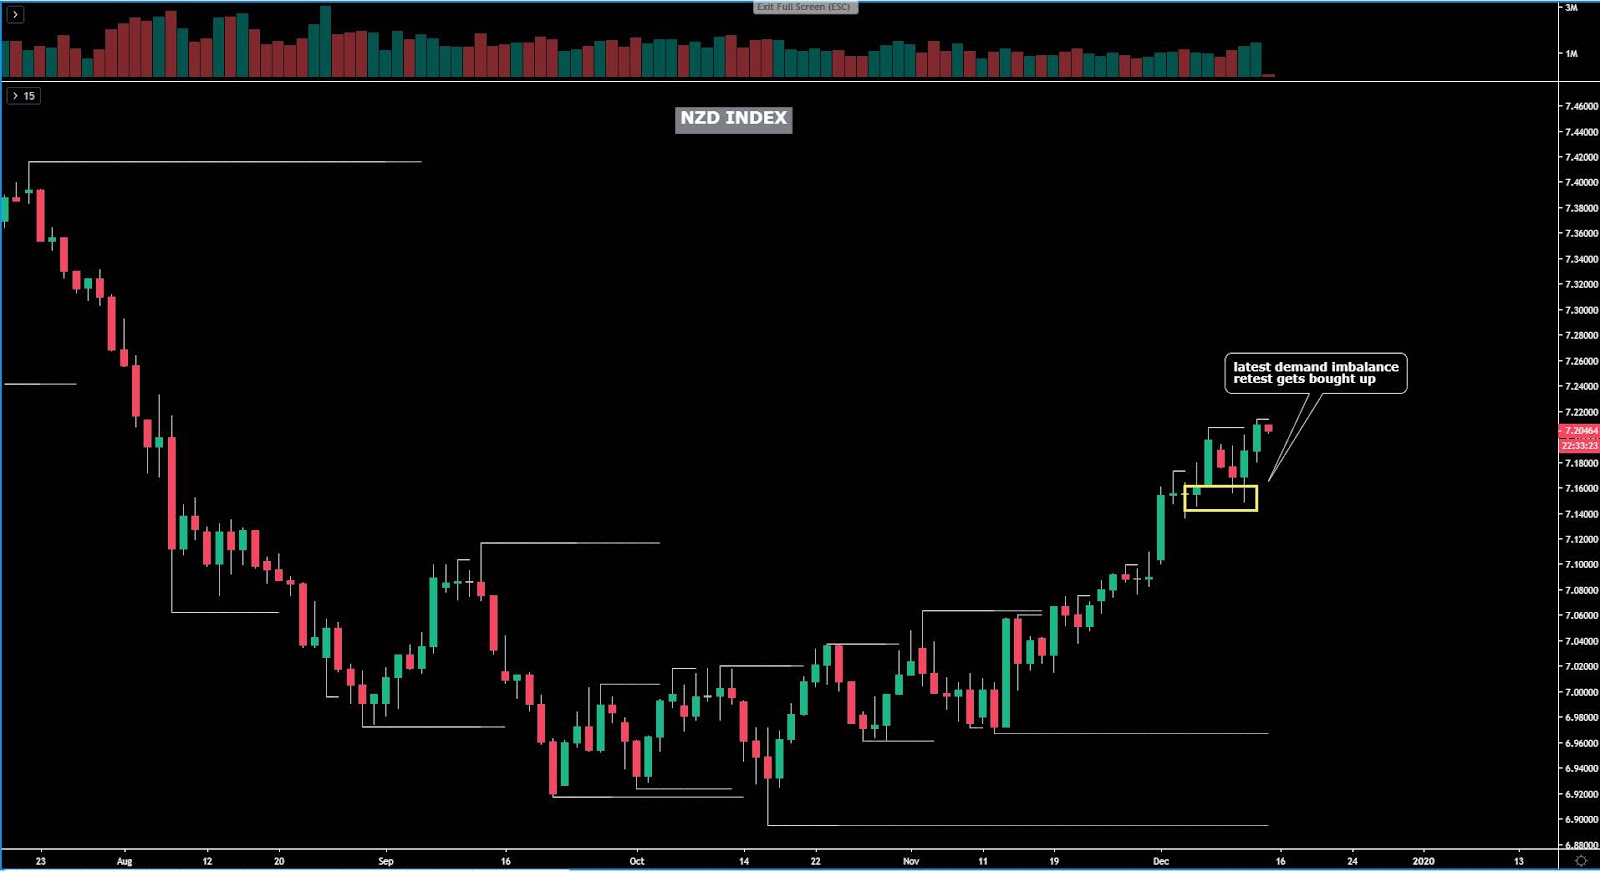
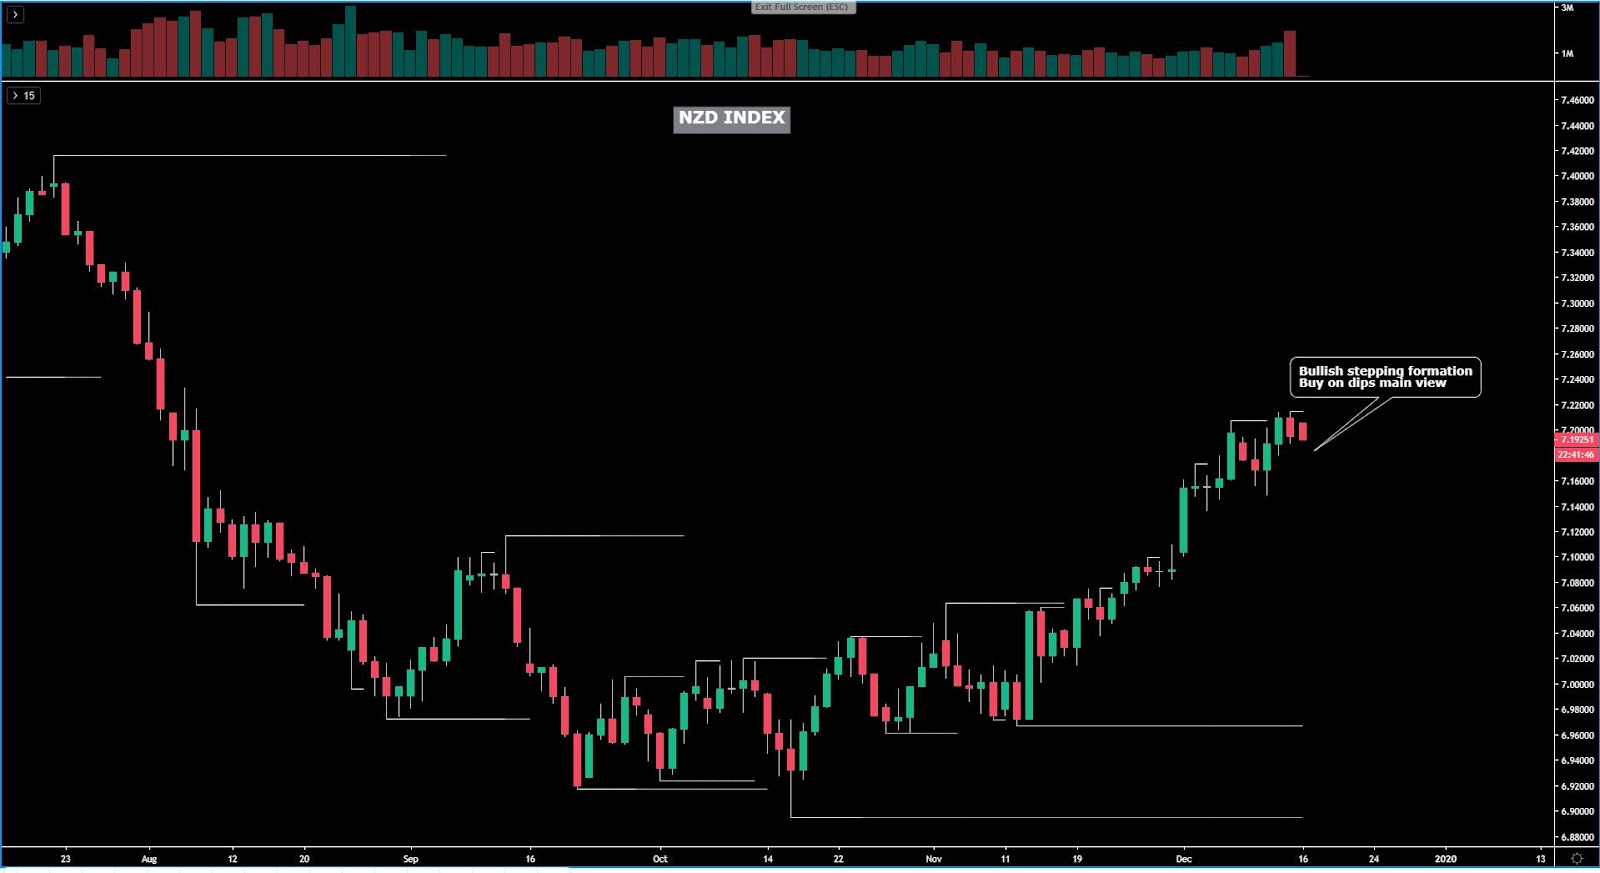
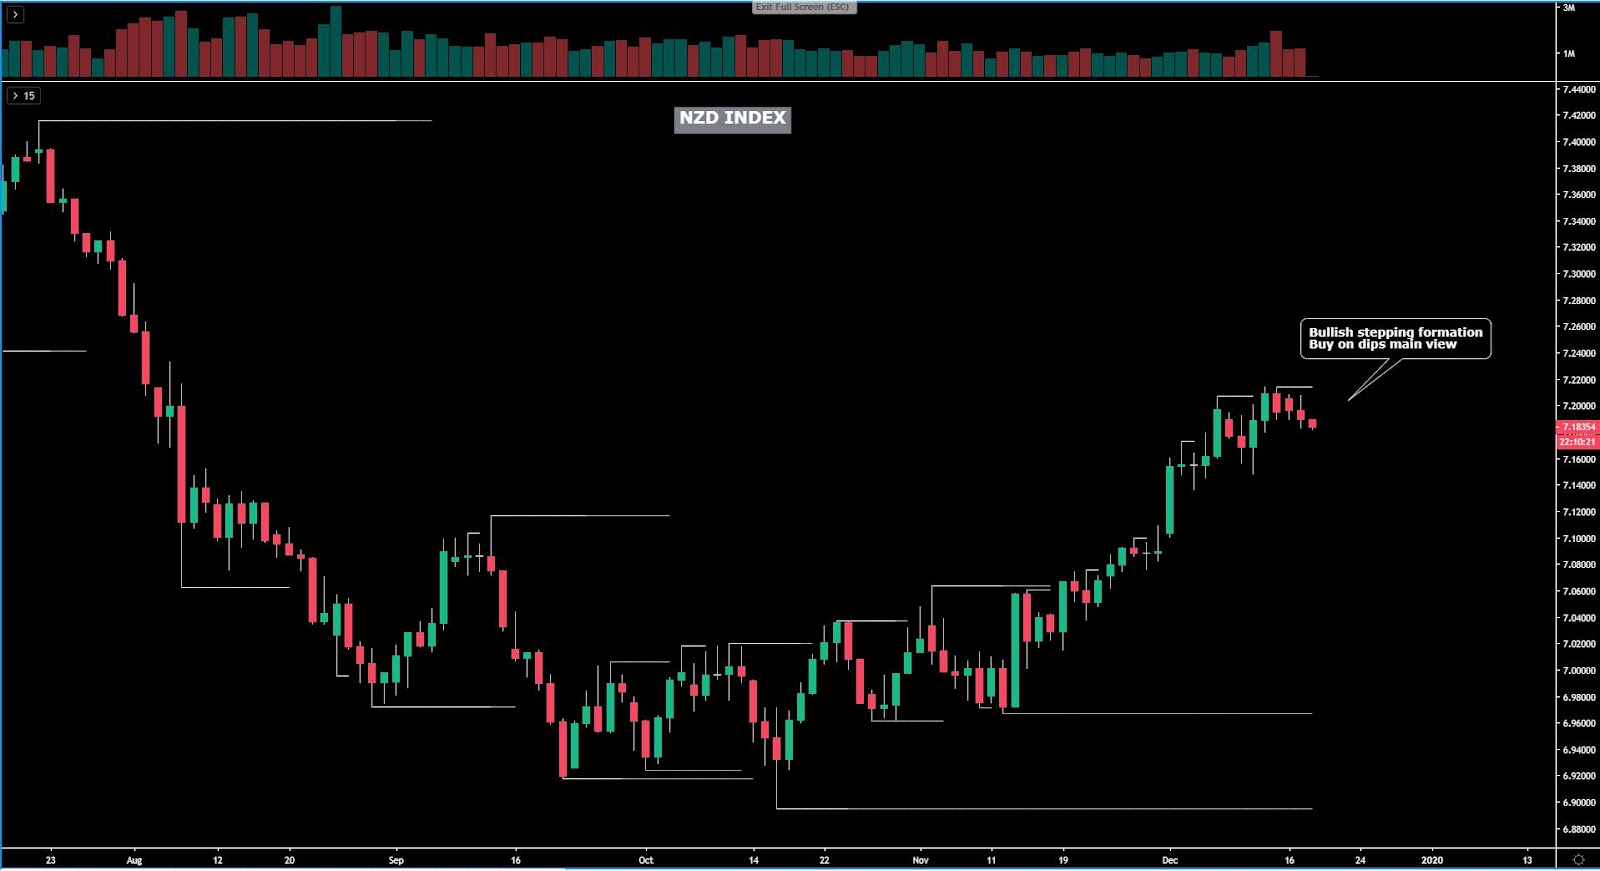
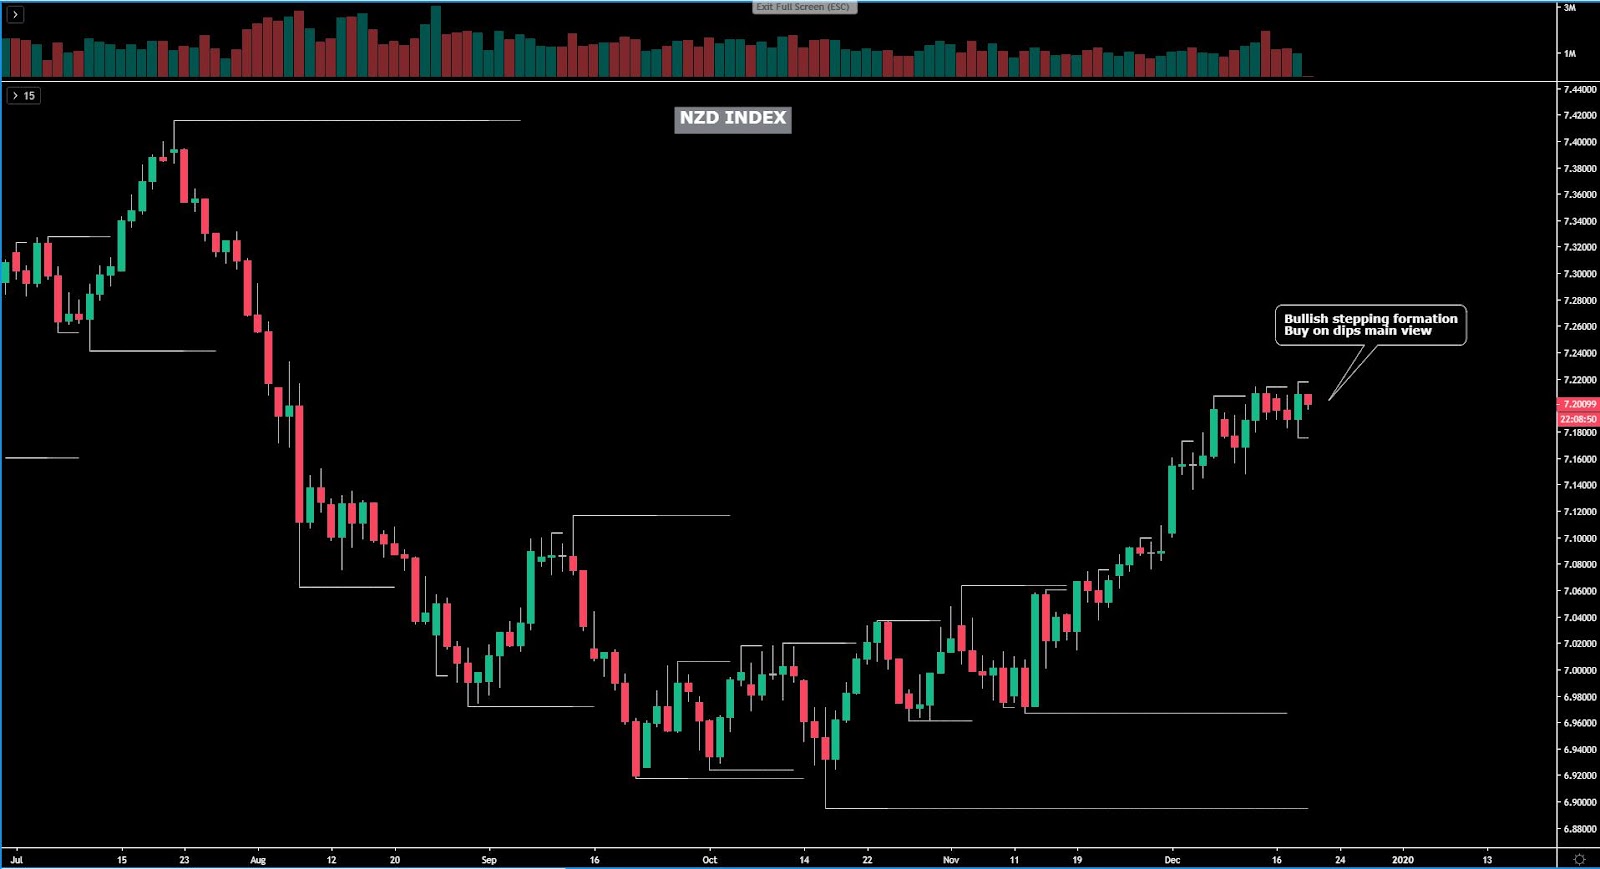
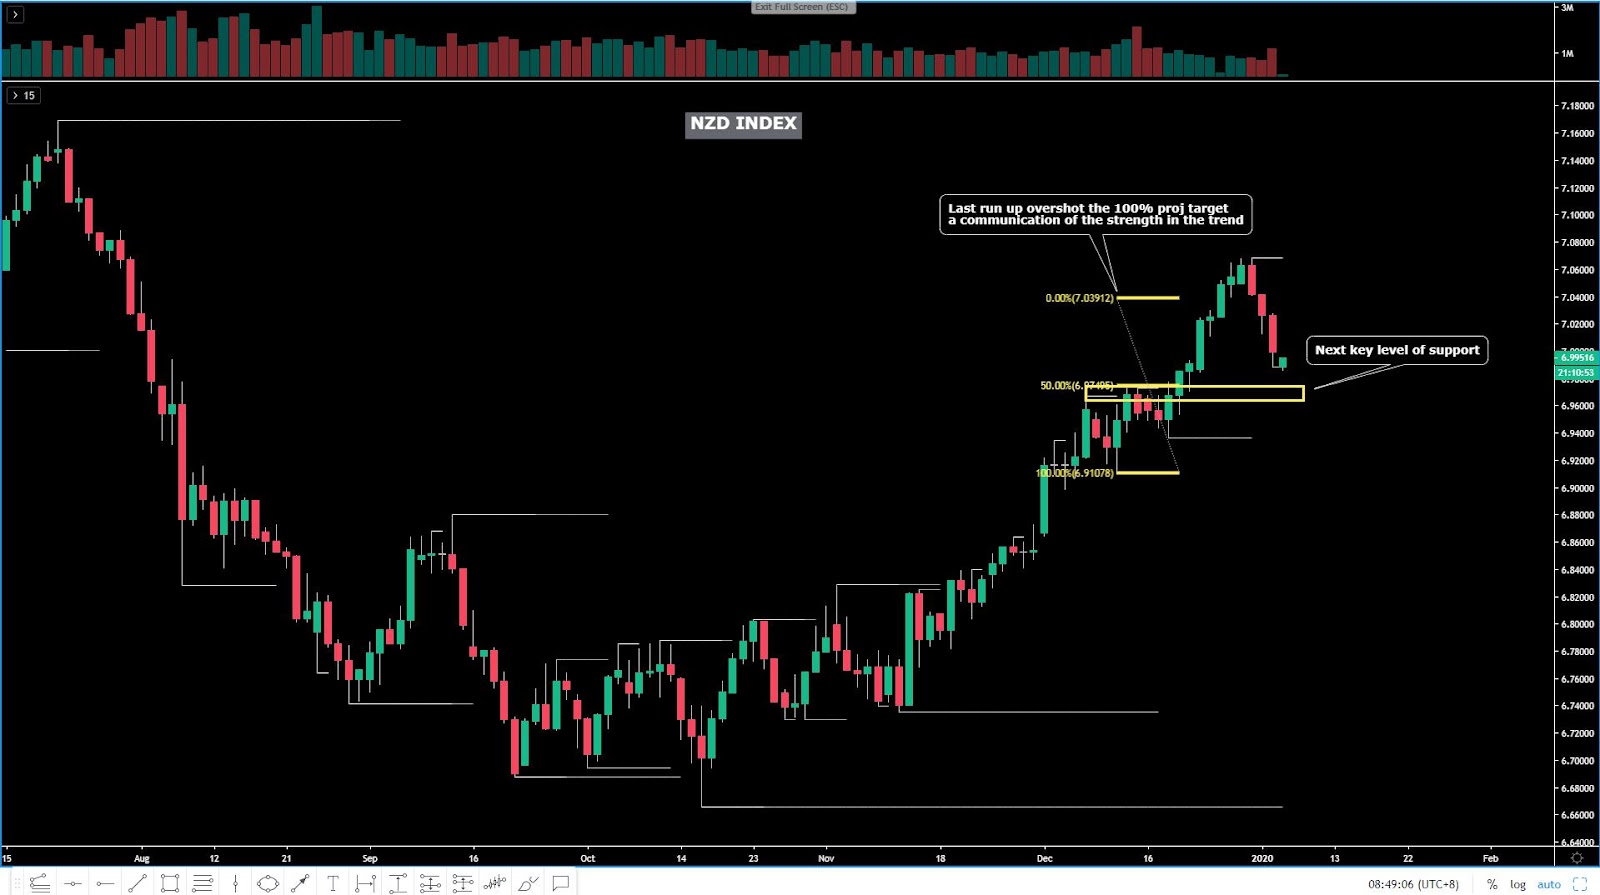
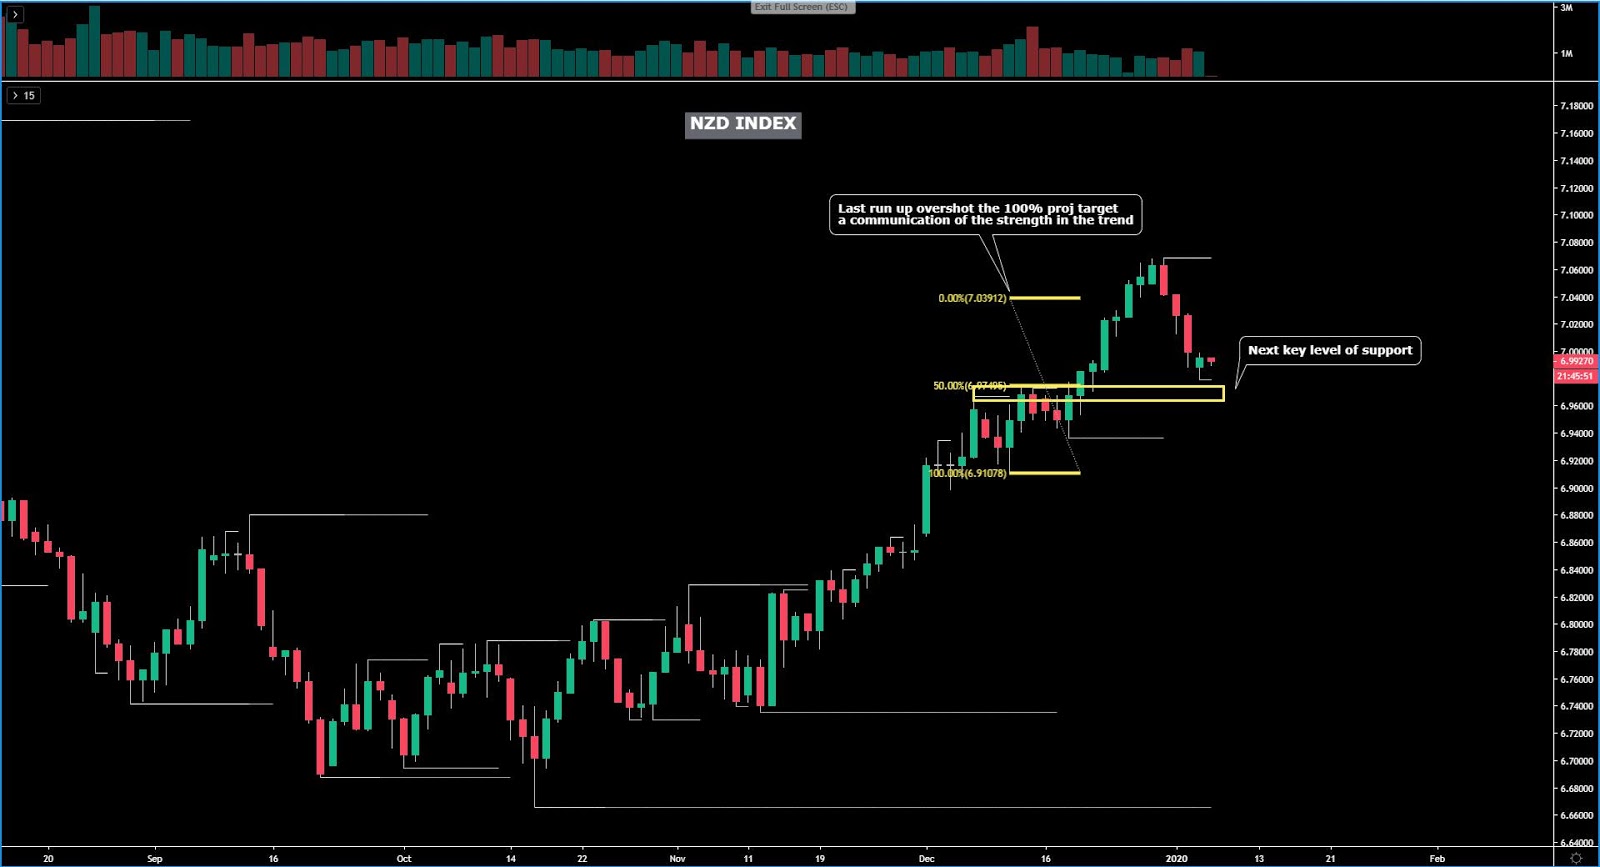
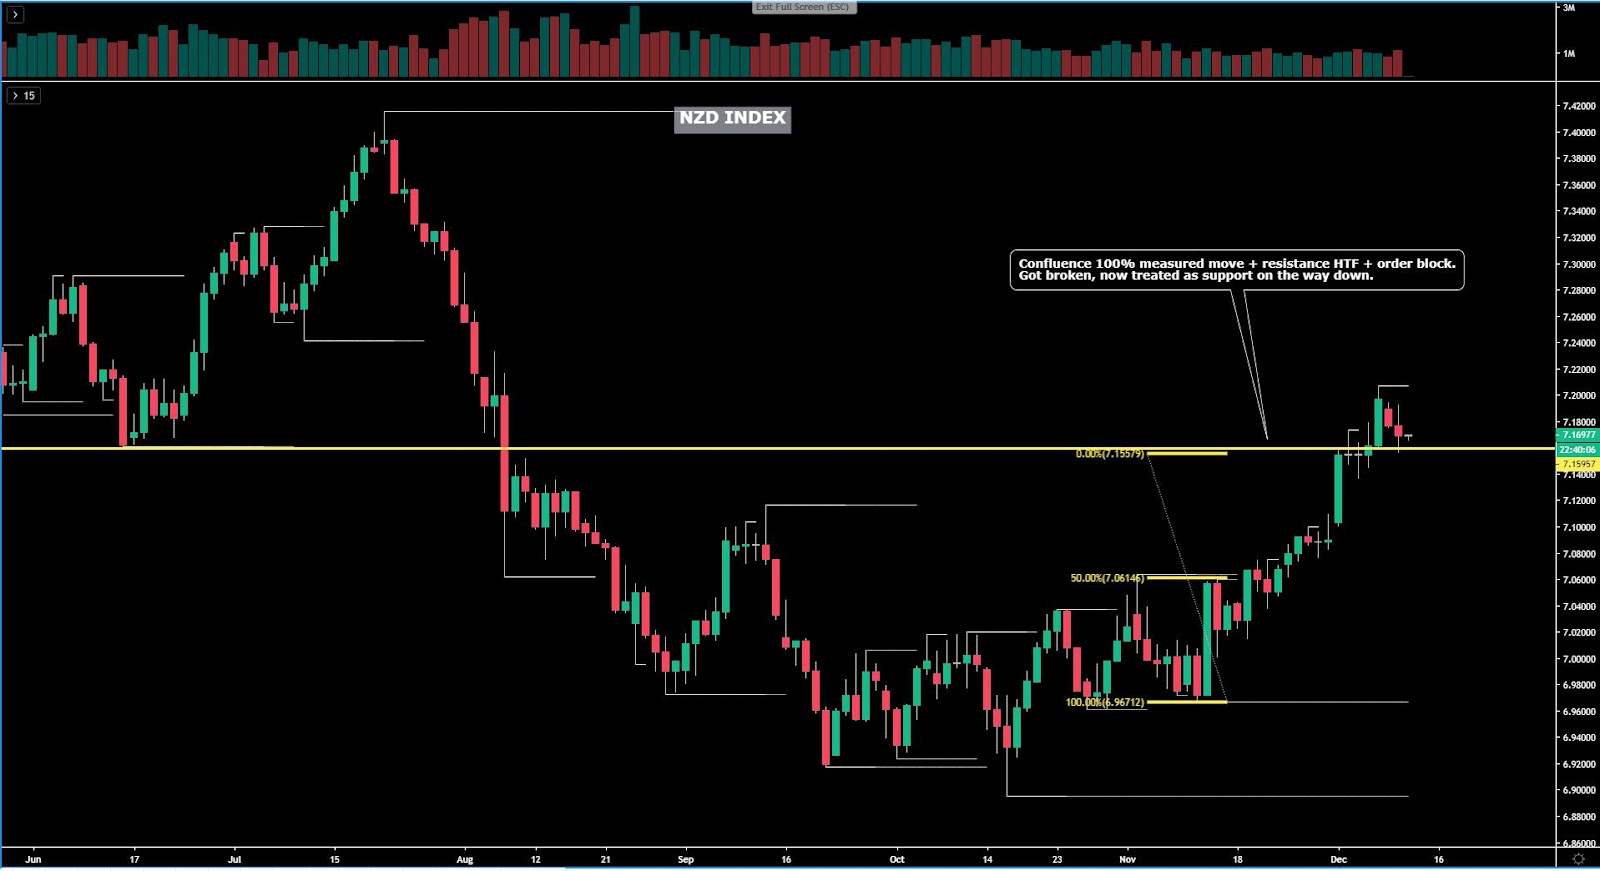
The NZD index remains in an upward stepping formation pattern with buy on dips interest still notable as per the significant down wick printed in Tuesday’s candle as the price returned towards its latest point of a demand imbalance. Remember, the momentum in this market is strong, and a testament of that is how bulls managed to gun through what I’d have expected to be a potential top given the level of confluence. Now this very same level is acting as a bastillon where buyers are looking to keep the upper hand. As I wrote in yesterday’s report, “there is no reason to be a hero by looking to engage in shorts unless you have a well calculated and premeditated strategy."
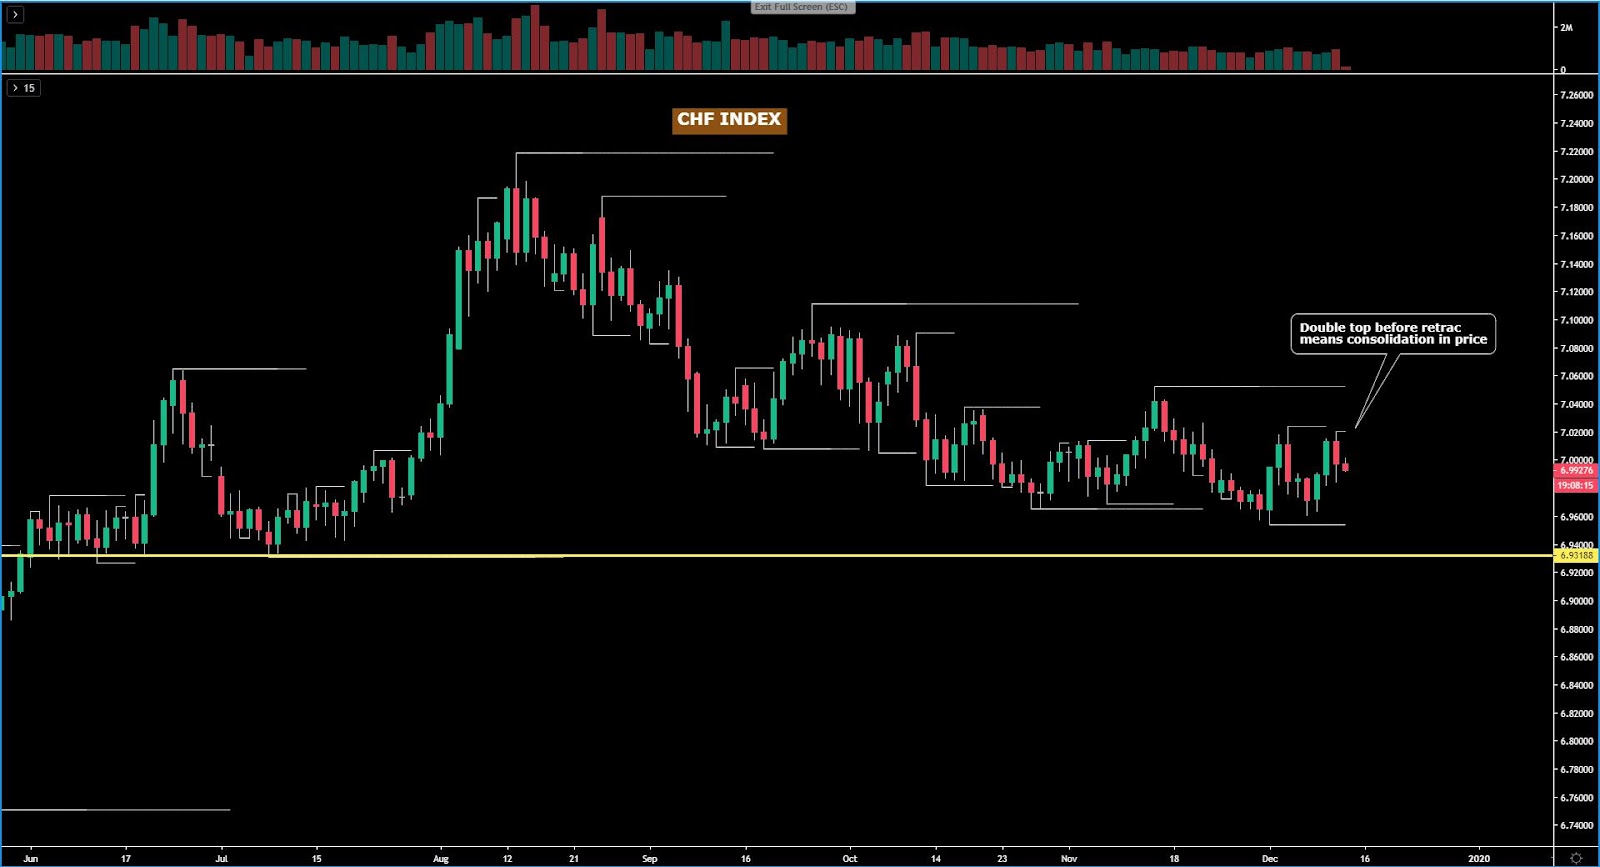
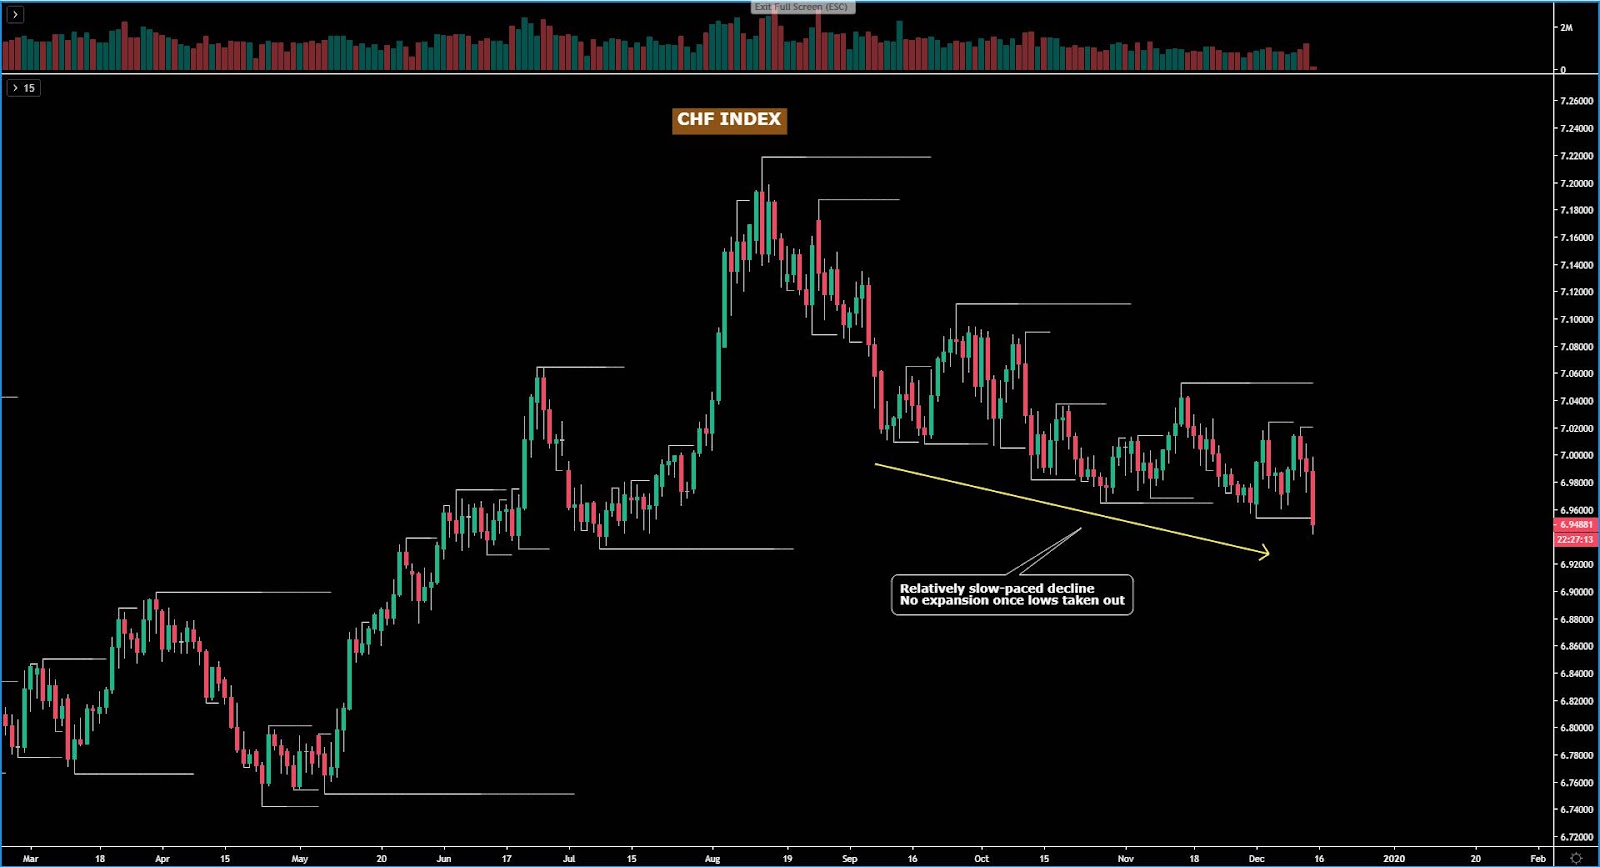
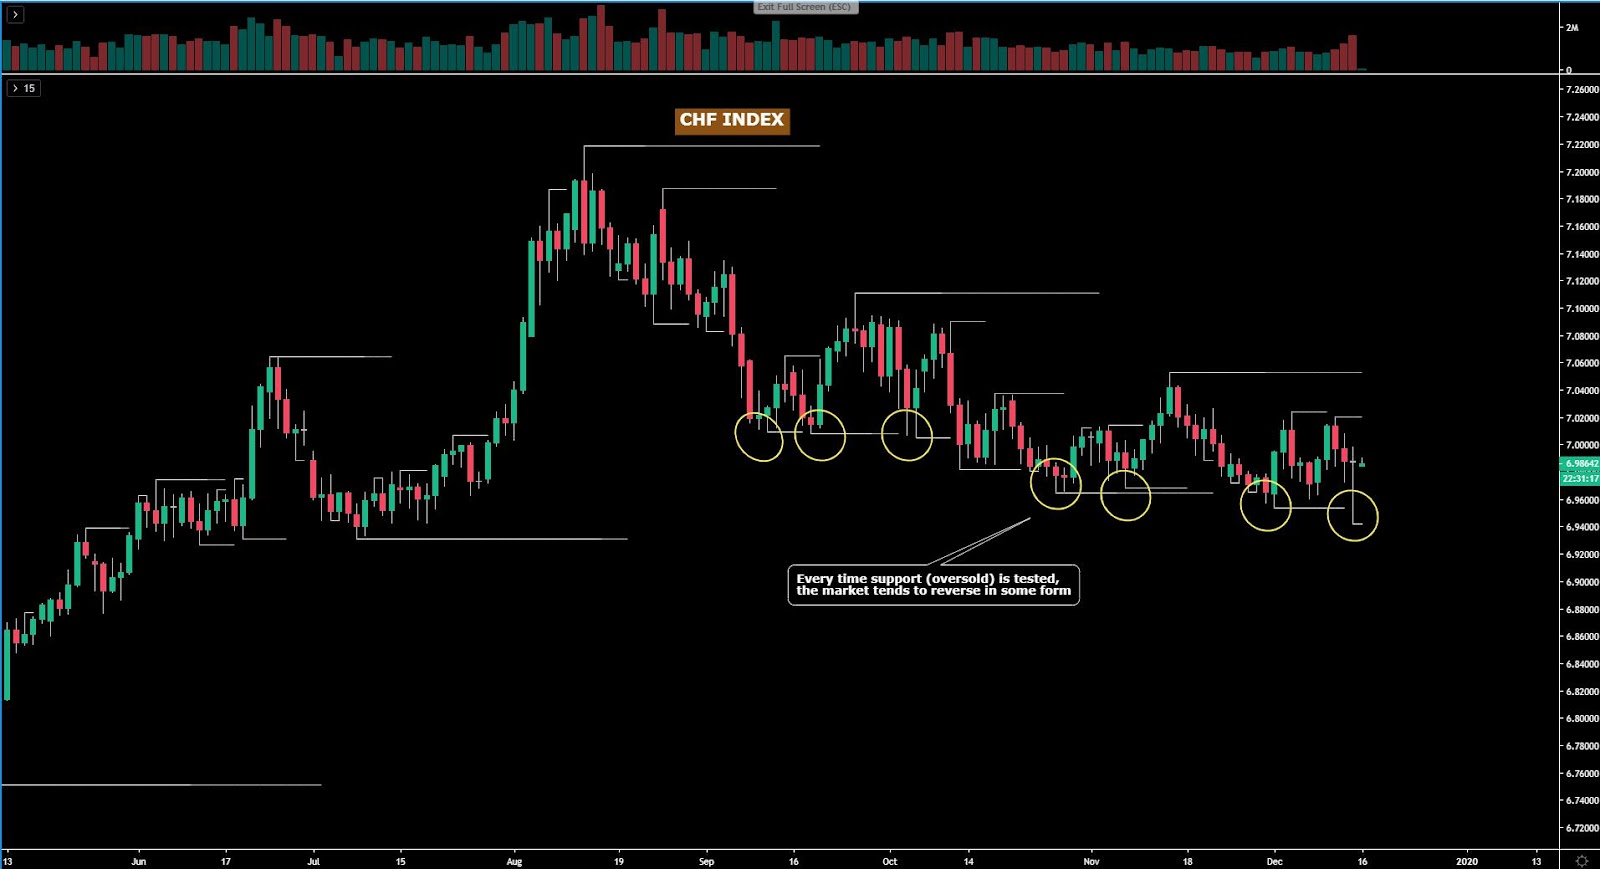
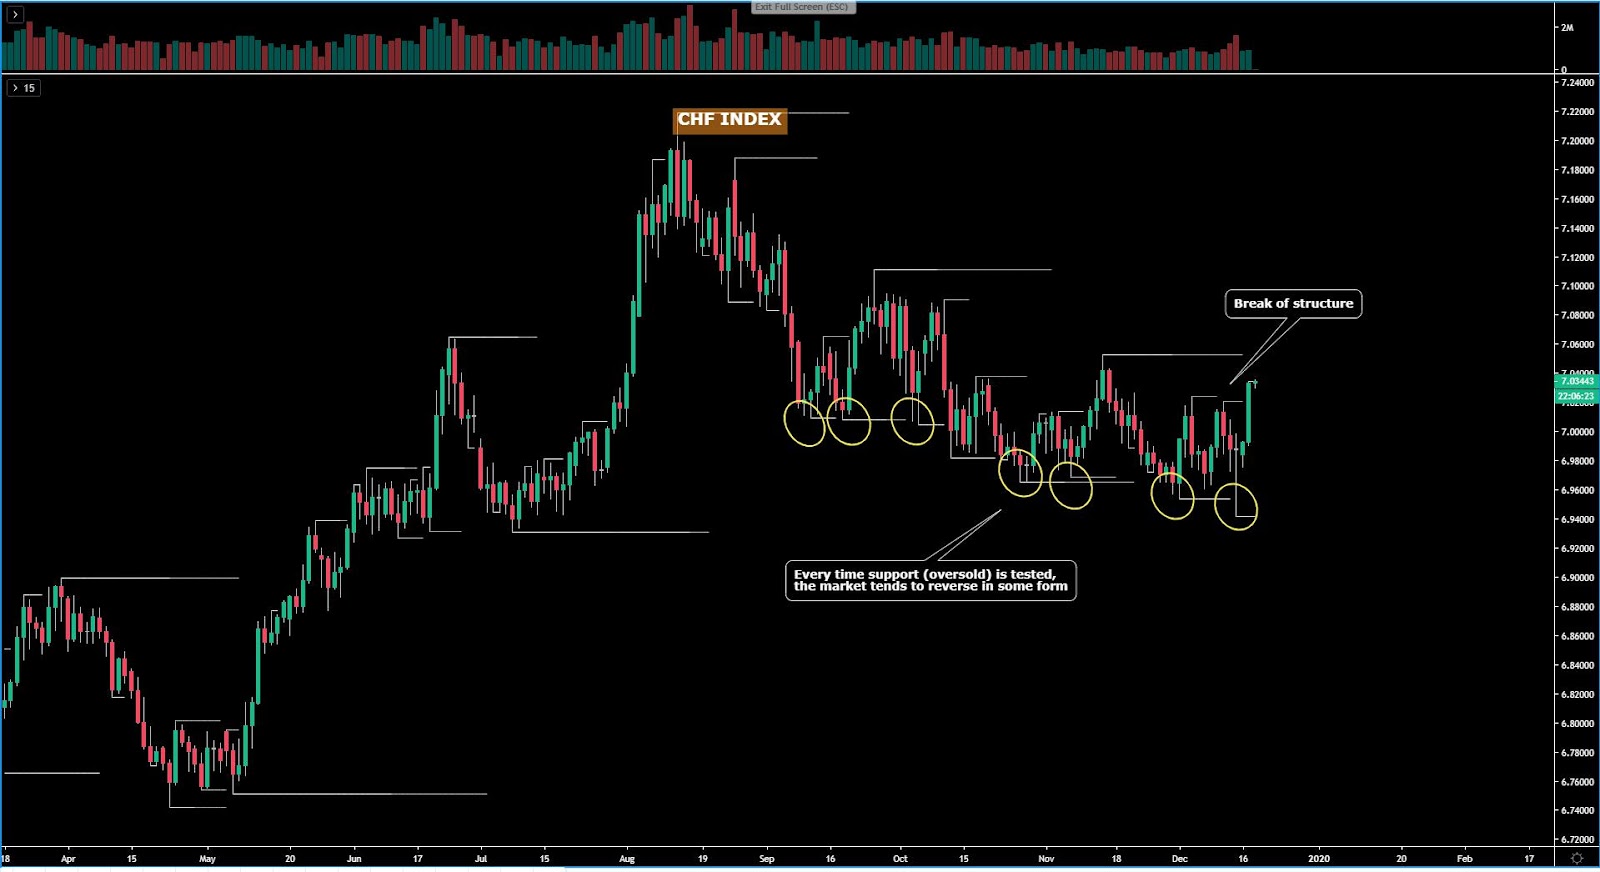
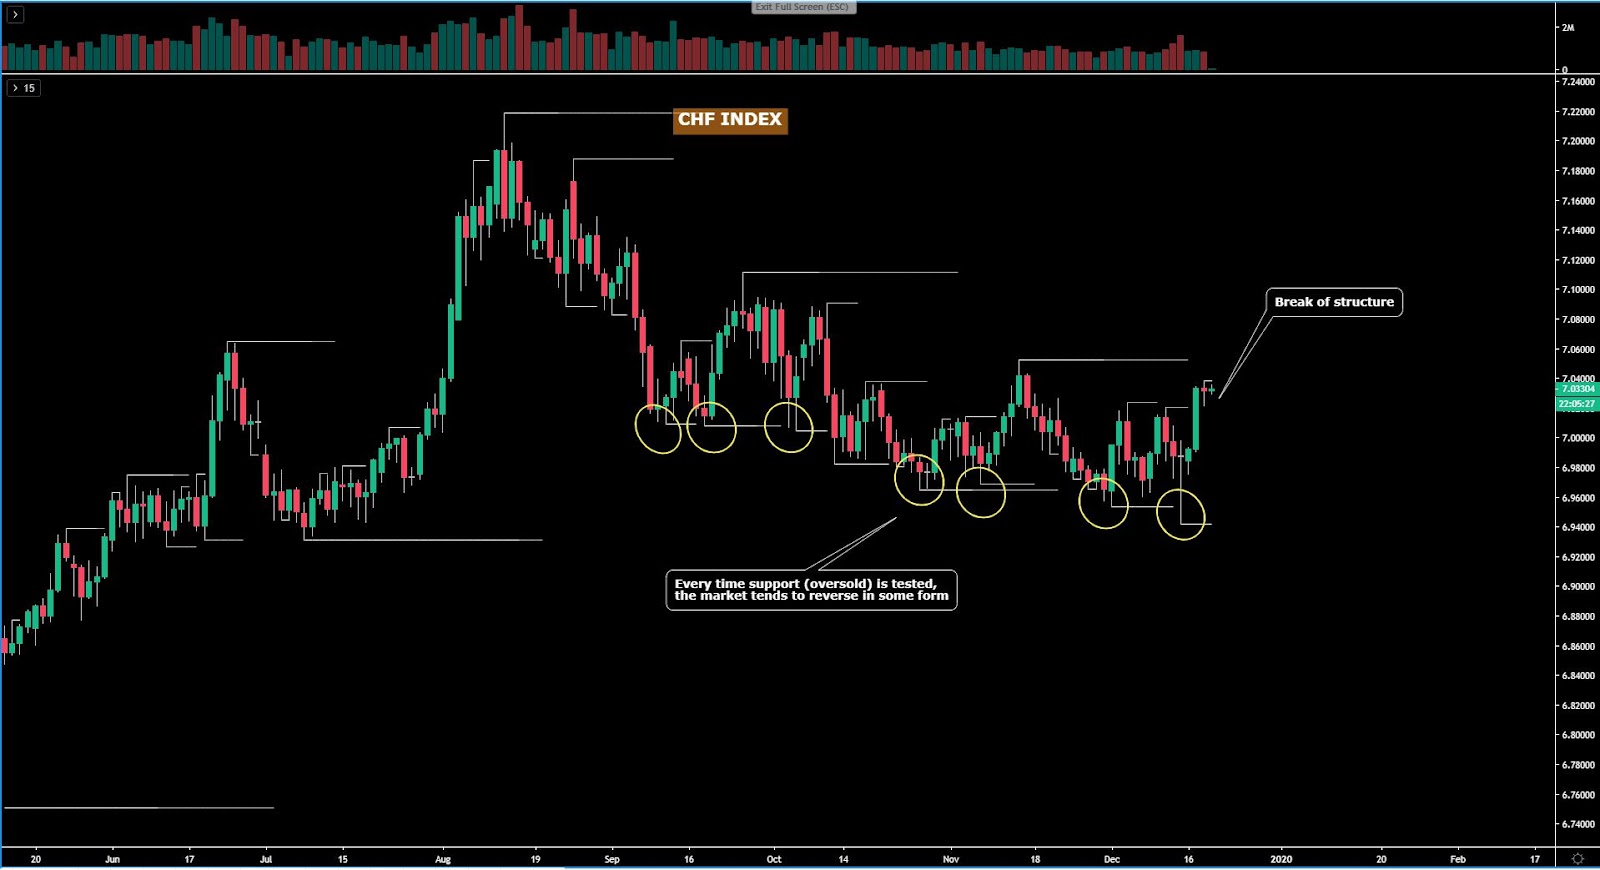
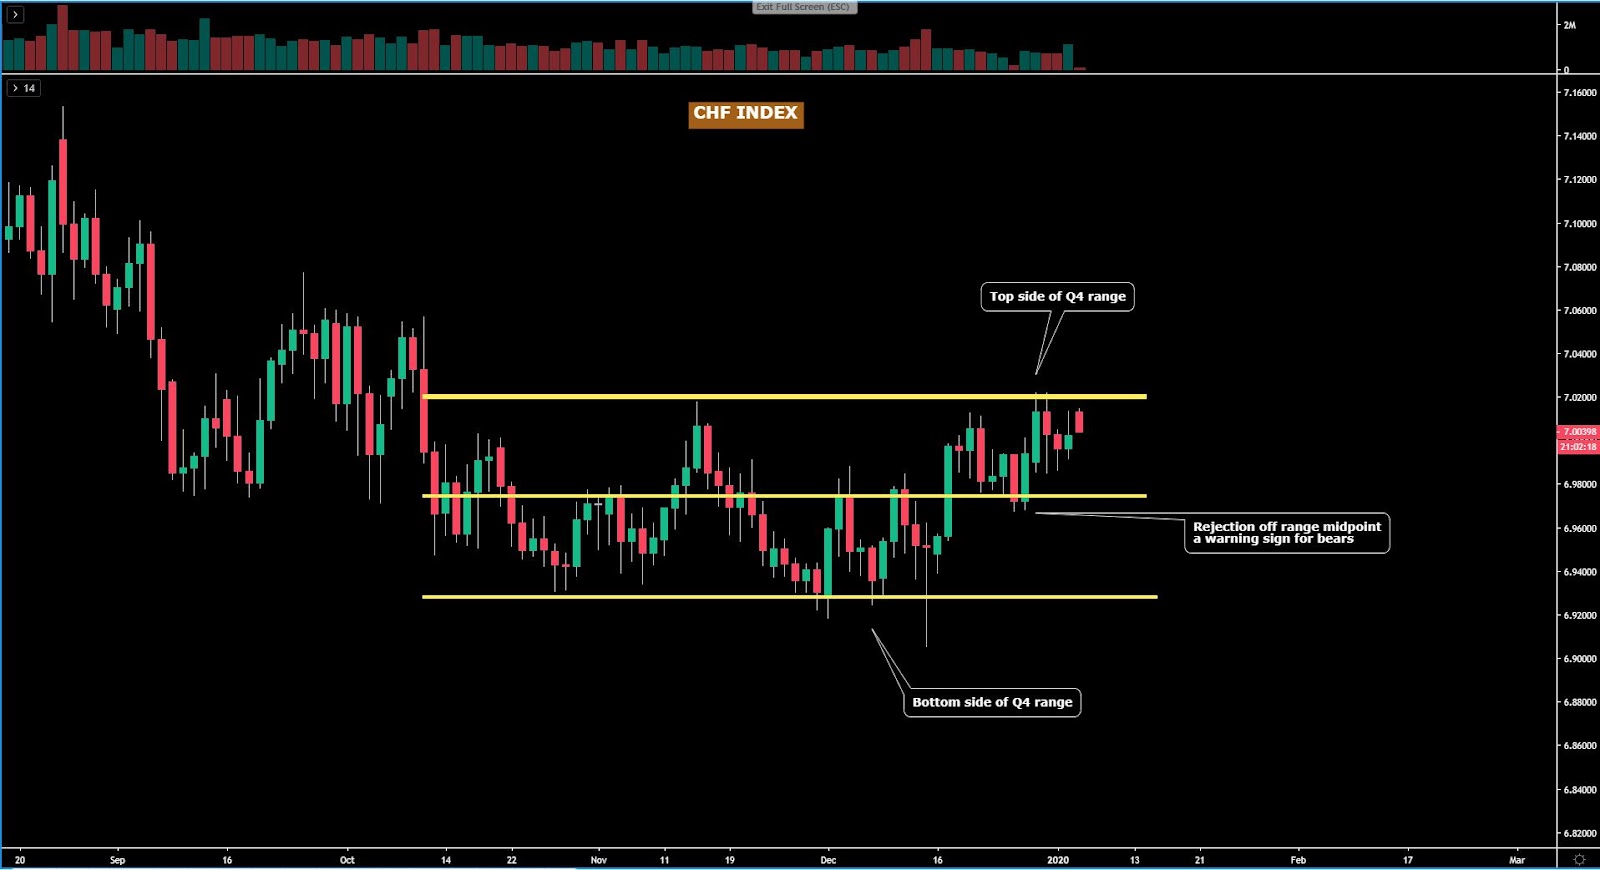
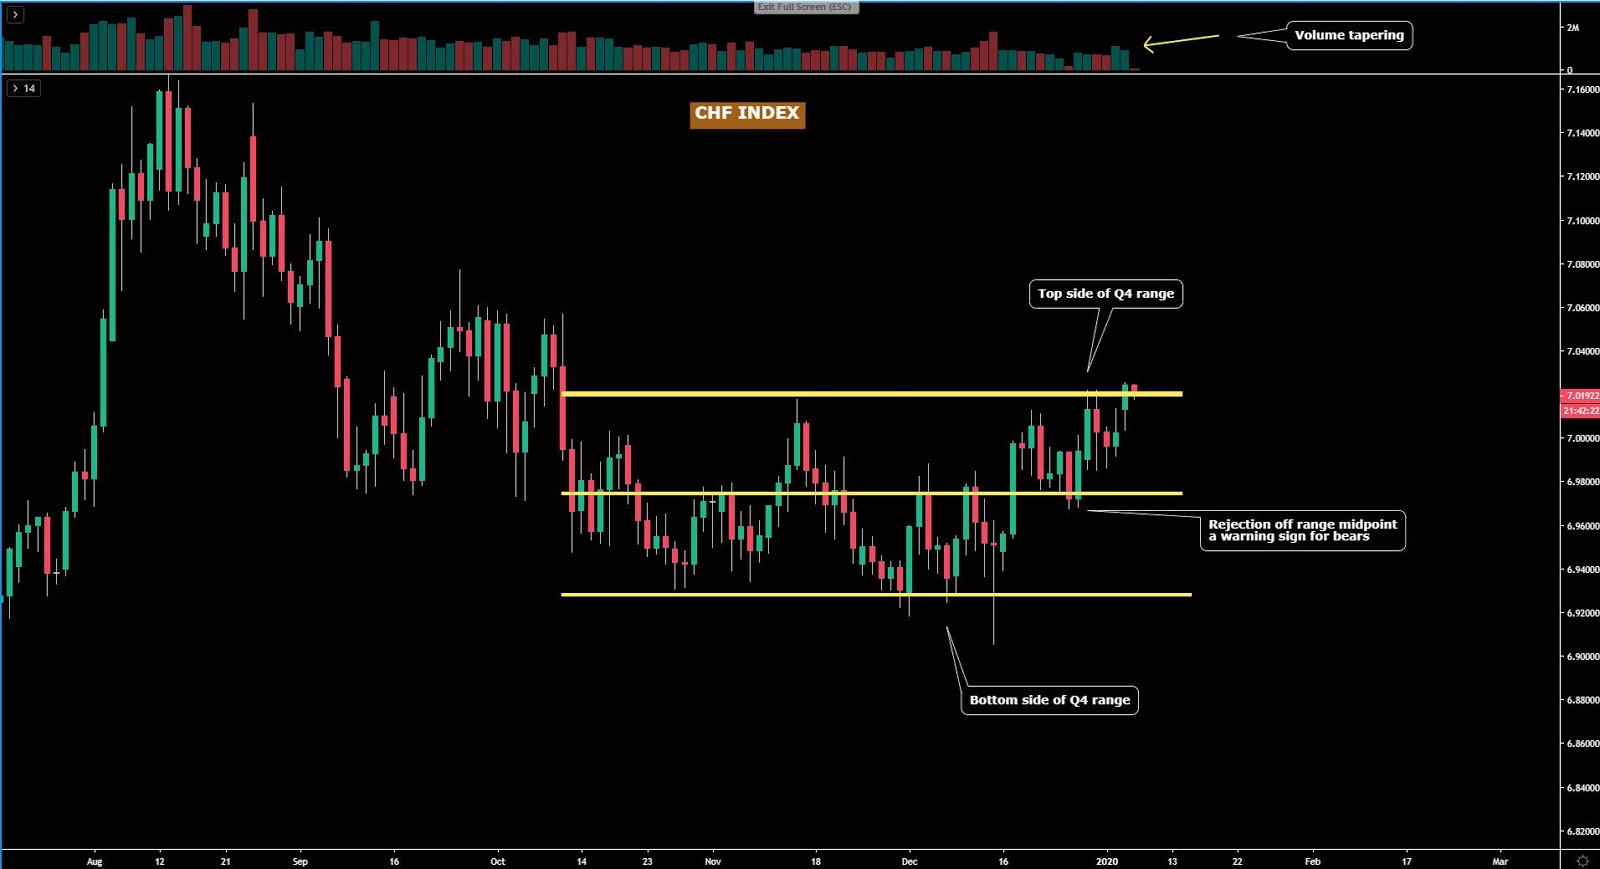
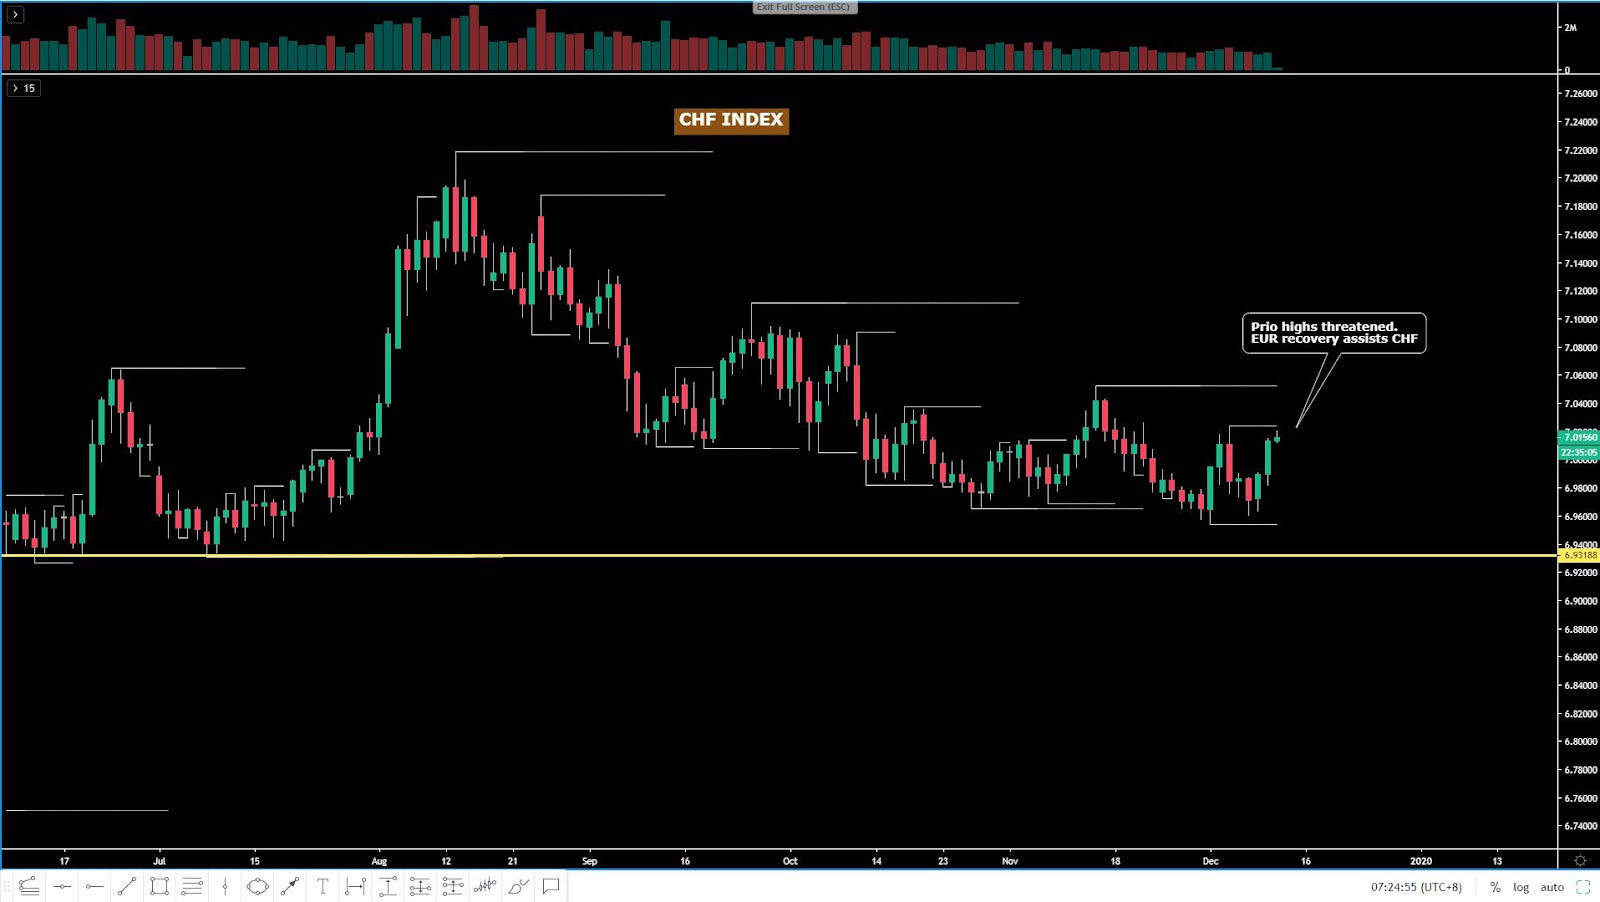
The CHF index has improved its outlook in the last 24h, as the rotational price action seen is now headed straight into the next resistance level. This test would confirm that the last rotation back down has failed and automatically increases the prospects of a fresh bullish cycle developing, although the option of a failure at the resistance resulting in range-bound dynamics is another scenario that must be accounted for. My view to personally staying away from forming any strong opinion on the Swissy as the overall flows stand remains true.
Important Footnotes
Euro Capitalizes On Germany's Green Shoots
The EUR was emboldened by the prospects of a 'gentle turning point' in the German economy, with the CHF also benefiting from the ebbs and flows. The GBP showed residual demand only to evaporate Tuesday's gains by a setback in the UK Gov MRP poll. The USD remains lagging behind ahead of today's FOMC as does the AUD as the suspense on the Chinese tariffs continues.
The Daily Edge is authored by Ivan Delgado, 10y Forex Trader veteran & Market Insights Commentator at Global Prime. Feel free to follow Ivan on Twitter & Youtube weekly show. You can also subscribe to the mailing list to receive Ivan’s Daily wrap. The purpose of this content is to provide an assessment of the conditions, taking an in-depth look of market dynamics - fundamentals and technicals - determine daily biases and assist one’s trading decisions.
Let’s get started…
- Quick Take
- Narratives in Financial Markets
- Recent Economic Indicators
- Dive Into Pro FX Chart Insights
- Educational Material
Quick Take
The European currencies were the main winners on Tuesday, with the Swissy leading the pack from the early hours of trading in Asia, only to be followed by a perky Euro as the German data continues to show some very early signs of green shoots in the country. The Sterling remained well supported throughout the day until a moment of reckoning by an overly long market led to a unwinding of positions as the market learned that the benchmark UK Gov MRP model survey came worse than expected for the Conservatives. Their lead is narrowing dangerously, bringing back fears of a hung parliament, even if that is still far from being the base case scenario being priced in by the market. The US Dollar, meanwhile, remains very subdued ahead of today’s FOMC where the market expects very few changes to the statement as the Fed has shifted to a neutral and data dependent stance. It’s worth noting that the USD, as reiterated this week, tends to perform poorly in Dec judging by the collection of historical data in the last 3 decades of price action at this time of the year. The Canadian Dollar was better bid, partly in line with improved technicals, but also getting an extra breather in the way of a new NAFTA deal finally approved by officials. Lastly, the oceanic currencies suffered sell-side pressures since the start of the European session as the market is none the wiser as to whether or not Chinese tariffs will be enacted by Dec 15.
The indices show the performance of a particular currency vs G8 FX. An educational video on how to interpret these indices can be found in the Global Prime's Research section.
Narratives In Financial Markets
* The Information is gathered after scanning top publications including the FT, WSJ, Reuters, Bloomberg, ForexLive, Institutional Bank Research reports.
The green shoots expand to Germany: The German Dec ZEW current situation and economic sentiment kept improving, cementing the tendency of green shoots we are seeing in other corners of the world. The expectations/outlook reading came to its highest level since February 2018. ZEW said that projections for a pick up in German exports and private consumption played a key role as the German foreign trade surplus and the labour market stabilize.
China’s fundamentals keep painting a rosier picture: China’s November credit and money supply data also strengthened the groovy vibes about a global recovery as the broad Aggregate Financing measure rose by ¥1,750bn, way above exp. , which when added to the positive developments in the country's PMIs, it shows the country might be on the cusp of turning a corner, and that keeps the global recovery thematic going.
Divergence in data a trend to keep an eye on: The rebound in the German and Chinese data plays into the view of the remarks made by the research team at Morgan Stanley about emerging divergences in data trends, which should lead to higher volatility ahead as long as these trends are continuing to diverge. “Divergence is a recipe for vol, and we are starting to see signs of the data trends diverging. Global data continue to show signs of stabilization. More than half of global manufacturing PMIs ticked up in Nov, including in China where both manuf PMIs rebounded. Trade activity is also showing signs of bottoming while global credit growth is rising at the fastest pace in three years.”
Officials expect a delay in the Chinese tariffs deadline: According to a report by the WSJ, US and Chinese trade negotiators plan for a delay of the December tariff, citing officials on both sides. The report notes: “Officials have signaled that Sunday is not the final date for reaching a so-called phase-one deal ... Chinese and U.S. officials involved in the talks say they don't have a hard deadline. President Trump, however, hasn't yet made his decision, and he has overridden his advisers on trade several times to add tariffs.” Based on the market behavior, the market is expecting some type of delay to be given.
US-China officials aim for tariffs delay, will Trump agree? A report by Bloomberg notes that Beijing sees a delay of the Dec 15 tariffs along with both sides reducing existing tariffs, even if ambiguity on Trump's side remains. The article details “Chinese officials expect the U.S. will delay a threatened tariff increase set for Sunday as both sides focus on de-escalating tensions by cutting import taxes currently in place rather than removing specific products from the target list, according to people familiar with the matter.”
New NAFTA deal: Officials have finally come to agree in signing a revised NAFTA agreement. CTV news notes: “The agreement on the updated deal was reached between Canada, the U.S, and Mexico, and comes after U.S. Democrats secured adjustments to the deal that was first struck a year ago. This paves the way for the new United States-Canada-Mexico Agreement to finally be ratified.” Senate majority leader Mitch McConnell said that the Senate won’t finish USMCA this year. The Canadian Dollar was barely altered in its value as the focus is in the US-China tariffs.
GBP sold as Conservative lead shrinks: GBP saw an aggressive mark-down between NY and Tokyo as the UK election race is narrowing, according to the latest YouGov UK election poll. This survey is by far the one followed most closely by the market as the model it uses predicted the loss of majority by Theresa May back in 2017, hence the market has assumed this is the main gauge for the Dec 12 outcome. The results show Conservatives losing ground at 339 (-20) against Labour 231 (+20). Remember, earlier polls had projected a much larger majority for Johnson. What this means is that the risk of a hung parliament should not be disregarded, hence the adjustment lower in GBP.
AUD the main laggard in FX: The AUD continues to exhibit weakness following a stabilization in the NAB business survey, which showed confidence and conditions below average levels with a marginal decrease in the confidence measure. We also saw RBA’s Governor Lowe intervene in a Q&A post speech on payments, saying that “The surprise in the GDP data was weakness in consumption growth, given extra income from tax cuts. I’m still confident, given extra time, people will spend extra income. It’s quite possible that spending takes a little longer…in the current environment there’s a high level of debt, and households are paying down debt first. Says weakness of Q3 consumption ‘does not have any particular message for the future.”
FOMC next risk event: The FOMC is scheduled to release its latest decision on monetary policy. The market is not expecting major changes in language. As the economics team at Danske Bank notes: “Following three cuts in a row, we expect the Fed to remain on hold. FOMC members have made it clear that they think the ‘current stance of monetary policy is appropriate’ and that they now want to wait some time and see how things play out before acting again. At the latest meeting in October, the Fed surprised us by removing its easing bias and, as the data has not really painted a different picture, it is difficult to see why FOMC members should change their minds (if anything the strong jobs reports in recent months should calm fears despite subdued ISM/PMI indices). Hence, we do not expect major changes to the statement.”
If you found this fundamental summary helpful, just click here to share it!
Recent Economic Indicators & Events Ahead
Source: Forexfactory
Professional Insights Into FX Charts
The indices show the performance of a particular currency vs G8 FX. An educational video on how to interpret these indices can be found in the Global Prime's Research section.
If you found the content in this section valuable, give us a share by just clicking here!
The EUR index, which had its lowest close in years last Friday, has managed to find strong buy-side interest below a broken level of support as the German data keeps improving. Where we go from here is not clear as the technicals are hard to decode this week since the market is in a standby ahead of the major risk events ahead. The structure in the index still warrants caution as the sequence of lower lows and lower highs in the daily still rules.
The GBP index came within a hair of the anticipated hard resistance in the form of a horizontal line and the 100% projected target. The latest UK election poll commissioned by UK Gov has knocked the currency down from its lofty levels as the Conservatives lead narrows. This setback in the poll has the market realizing that the risk of a hung parliament still exist, and as a result, on the lead up to the Dec 12 election results, some unwinding og GBP longs may now ensue.
The USD index has stalled at the lows and it appears to be carving out a potential reversal, which if it gathers to see follow through, may see the new leg extends back up towards last week’s breaking point. The performance in the index this week will hinge on the outcome of the FOMC today to a certain extent. What this means is that technicals won’t necessarily act as a primary driver to gauge the next direction but rather the stance on policy by the Fed will. Nonetheless, remember, Dec forex seasonals and technicals, are both against the USD.
The CAD index may be on the cusp of a meaningful bottom judging by the maturity of its downcycle. This is a view I have been endorsing since the last sell-off pre-BOC and its backing is predicated on the fact that each leg down has carried lesser commitment - magnitude of the downside extension - than the previous (-1.65%, -1.45%, -1.10%). This premise is mainly anchored by the latest BOC decision, which appeased the prospects of a rate cut, to the point that it should override somehow the horrible Canadian jobs report printed last Friday.
The JPY index, if only judged by its most recent price action over the last week, still shows moderate bearish tendencies, even if the lack of any downside momentum makes it hard to crystalize with conviction a particular direction. When one adds to the mix the raft of risk events in line, it is no wonder that the market fails to manifest, via its aggregated flows, a clear picture as the market has dialed down its commitment to take any aggressive bets. Bottom line, the Yen is in a ‘wait and see’ mode going nowhere fast until the market digests the risks to come.
The AUD index continues to be a laggard in FX and as feared, the double bottom eventually got raided as the next logical target where plenty of liquidity would have been available in AUD-related pairs. The acceptance below this low should shift the focus towards this year’s double bottom formed in Aug-Sept. The market now awaits the binary outcome about Trump enacting or not the next round of tariffs to China. AUD will react the most as a proxy for China.
The NZD index remains in an upward stepping formation pattern with buy on dips interest still notable as per the significant down wick printed in Tuesday’s candle as the price returned towards its latest point of a demand imbalance. Remember, the momentum in this market is strong, and a testament of that is how bulls managed to gun through what I’d have expected to be a potential top given the level of confluence. Now this very same level is acting as a bastillon where buyers are looking to keep the upper hand. As I wrote in yesterday’s report, “there is no reason to be a hero by looking to engage in shorts unless you have a well calculated and premeditated strategy."
The CHF index has improved its outlook in the last 24h, as the rotational price action seen is now headed straight into the next resistance level. This test would confirm that the last rotation back down has failed and automatically increases the prospects of a fresh bullish cycle developing, although the option of a failure at the resistance resulting in range-bound dynamics is another scenario that must be accounted for. My view to personally staying away from forming any strong opinion on the Swissy as the overall flows stand remains true.
Important Footnotes
- Cycles: Markets evolve in cycles followed by a period of distribution and/or accumulation. To understand the principles applied in the assessment of cycles, refer to the tutorial How To Read Market Structures In Forex
- Horizontal Support/Resistance: Unlike levels of dynamic support or resistance or more subjective measurements such as fibonacci retracements, pivot points, trendlines, or other forms of reactive areas, the horizontal lines of support and resistance are universal concepts used by the majority of market participants. It, therefore, makes the areas the most widely followed and relevant to monitor. The Ultimate Guide To Identify Areas Of High Interest In Any Market
- Trendlines: Besides the horizontal lines, trendlines are helpful as a visual representation of the trend. The trendlines are drawn respecting a series of rules that determine the validation of a new cycle being created. Therefore, these trendline drawn in the chart hinge to a certain interpretation of market structures.
- Fundamentals: It’s important to highlight that the daily market outlook provided in this report is subject to the impact of the fundamental news. Any unexpected news may cause the price to behave erratically in the short term.
- Projection Targets: The usefulness of the 100% projection resides in the symmetry and harmonic relationships of market cycles. By drawing a 100% projection, you can anticipate the area in the chart where some type of pause and potential reversals in price is likely to occur, due to 1. The side in control of the cycle takes profits 2. Counter-trend positions are added by contrarian players 3. These are price points where limit orders are set by market-makers. You can find out more by reading the tutorial on The Magical 100% Fibonacci Projection