Global Prime: Daily Market Digest

Find my latest market thoughts

USD Demand Soars, US Soft Data Dismissed


The bullish open in equities this week is a reflection of a market that still aims to be a bullish risk as the WSJ reports that the US and China are closer to a deal. It's precisely this 2019 overarching theme that keeps providing support to US yields and the USD as a result.

Date: 3/4/19

The Daily Edge is authored by Ivan Delgado, Market Insights Commentator at Global Prime. The purpose of this content is to provide an assessment of the market conditions. The report takes an in-depth look of market dynamics, factoring in fundamentals, technicals, inter-market, futures and options, in order to determine daily biases and assist one’s decisions on a regular basis. Feel free to follow Ivan on Twitter & Youtube.

Quick Take

The bullish open in equities this week is a reflection of a market that still aims to be a bullish risk as the WSJ reports that the US and China are closer to a deal. It's precisely this 2019 overarching theme that keeps providing support to US yields and the USD as a result. The Euro remains stubborn, as does the Sterling. The Aussie and the Kiwi have not gathered much attention as of late but that's about to change with the RBA policy meeting tomorrow. The CAD and the JPY are the two most fragile currencies, but for different reasons, the former battered by poor data while the Yen acts as the perfect funding currency in an environment of low vol and risk appetite.

Currency Strength Meter

screenshot_20190303_155118.jpg


In the last 24h, the USD is ruling the roost in the FX arena, while the Canadian Dollar is by far the most unloved currency after a notable Canadian Q4 GDP miss. The Japanese Yen and the Sterling traded on the weak side during the last trading day as well, but far from the sharp losses seen in the CAD. The recent pockets of EUR demand continue to come in, keeping the currency broadly supported, while the Aussie and the Kiwi also managed to eke out some marginal gains on a daily basis.

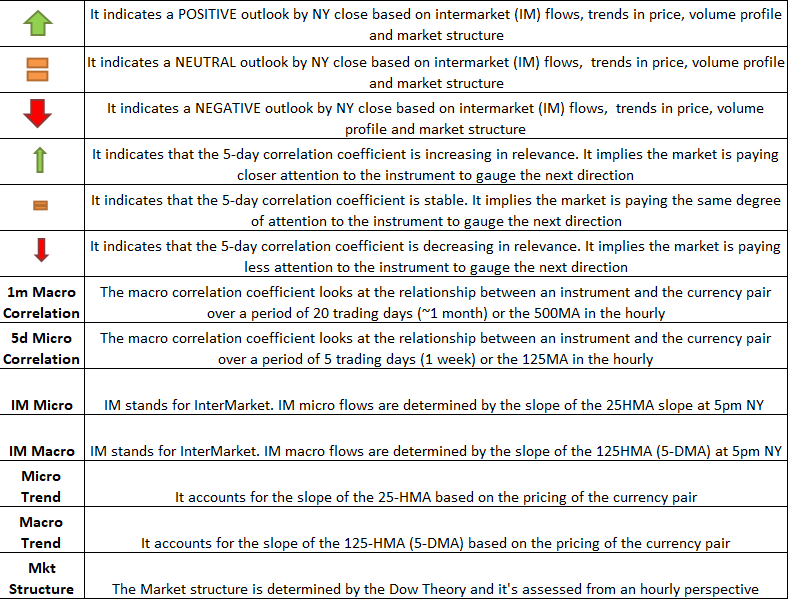
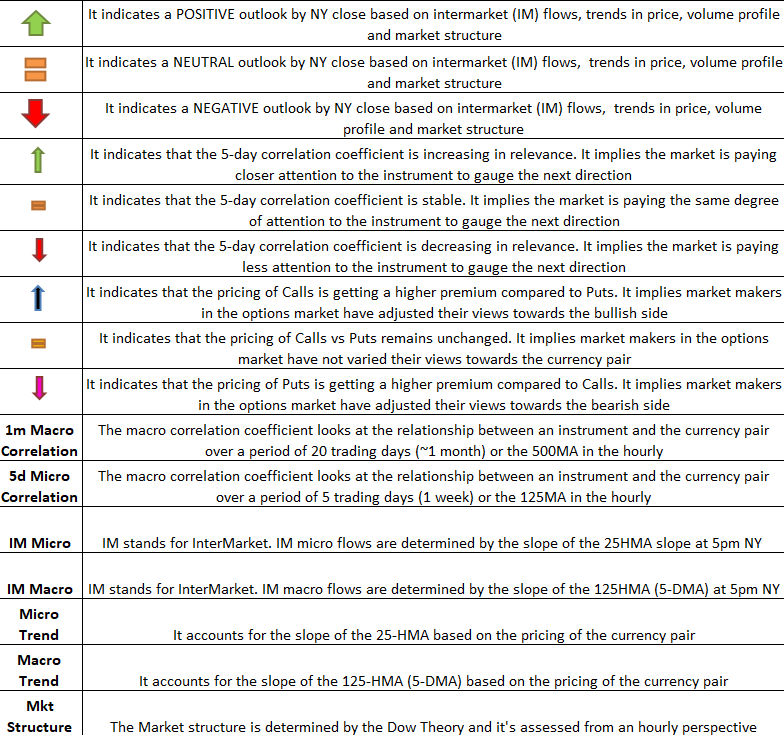
The last 24h of ebbs and flows has resulted in a micro/macro bearish permutation in the Canadian Dollar, which joins the Japanese Yen, the Aussie and to a lesser extend the Kiwi in the macro bar trends as per the 5-DMA slopes in the indices (2nd chart). On the opposite side of the equation, we still find the macro outlook dominated by a bullish GBP, followed by the EUR, while the USD has finally reverted back to macro bullish when cross-checking its performance against its 7 peers.
From a micro standpoint, only the EUR and the USD see concurrence in daily (micro) and weekly trends (macro), although it looks like the Pound is soon going to be a re-alignment again. The Japanese Yen due to ‘risk on’ conditions alongside the Canadian Dollar on negative fundamentals are the only market with the micro and macro in agreement, this time to the bearish side.

Narratives in Financial Markets
  • Markets shrug off poor US data (consumer confidence, ISM) as the USD keeps pressing higher in line with the rampant movements seen in UST yields.
  • CAD is the main laggard after a major miss on Friday’s Canadian Q4 GDP figures. The stats were released by mistake over 25m ahead of schedule, causing an early collapse in CAD value.
  • The WSJ is out with a weekend report about the US and China being in the final stages of completing a trade deal. The people cited do caution hurdles still ahead. A deal will only be formalized upon a summit between the US and Chinese President in mid-late March.
  • In other weekend news, US President Trump has asked China to immediately remove all tariffs on US agricultural products in return of postponing the March tariffs hike deadline.
  • Also over the weekend, US President Trump kept criticizing the Fed for hiking rates and promoting a strong USD, both factors hurting the economy, he said.
  • The Pound begins a new week on a stronger note after weekend news that Conservative Brexiteers are softening their stance to support UK’s PM May to leave the EU. As of late, the GBP has been on a tear on the basis of a favorable Brexit outcome, be it a delay of the Brexit deadline by extending Article 50 or even the celebration of a 2nd referendum down the road.
  • A long list of important economic news lined up to simulate flows this week, including Australia’s RBA policy meeting, Australia’s GDP, BoC’s policy meeting, US jobs…
Recent Economic Indicators & Events Ahead

screenshot_20190303_150558.jpg
screenshot_20190303_150428.jpg


Source: Forexfactory

RORO - Risk On Risk Off Conditions

95In6AF7BoJntQLJvo0jA2goOWZ4XUNJltOCQ6UnatWe9SqHs-Q05TDLlEjwrZDz9RTGWfB0kYkhFKNnUwHxOtR6WkGRB6ka_v0cdFHTEdQnWuJGtVl77TyT7DcNWVK_hItjcXAo
screenshot_20190303_154308.jpg


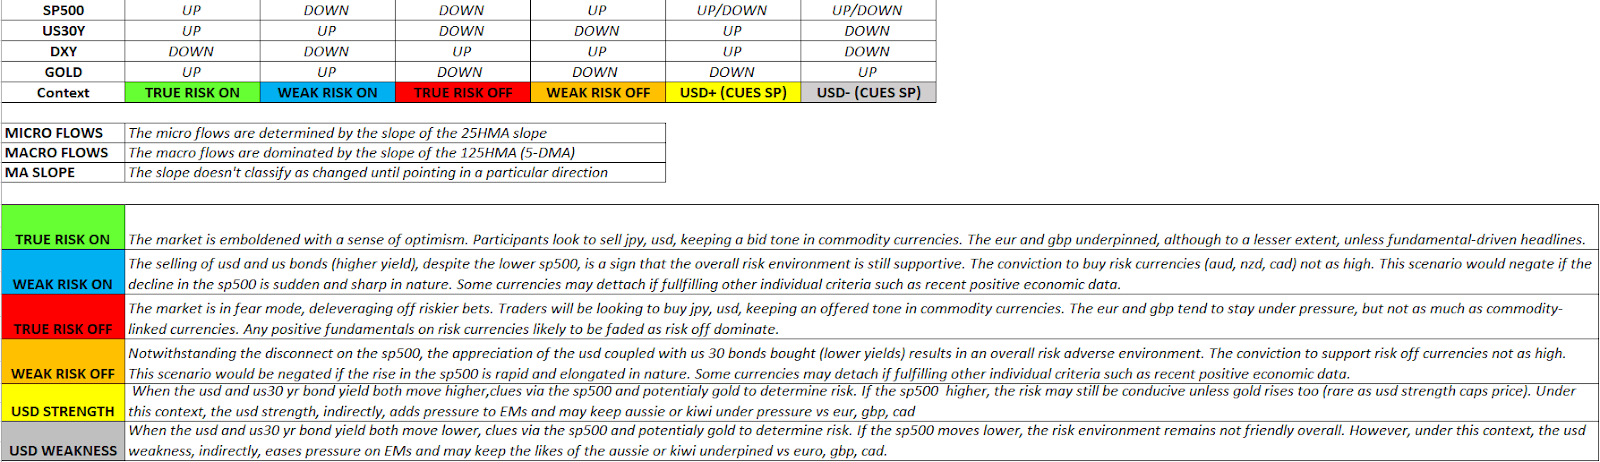
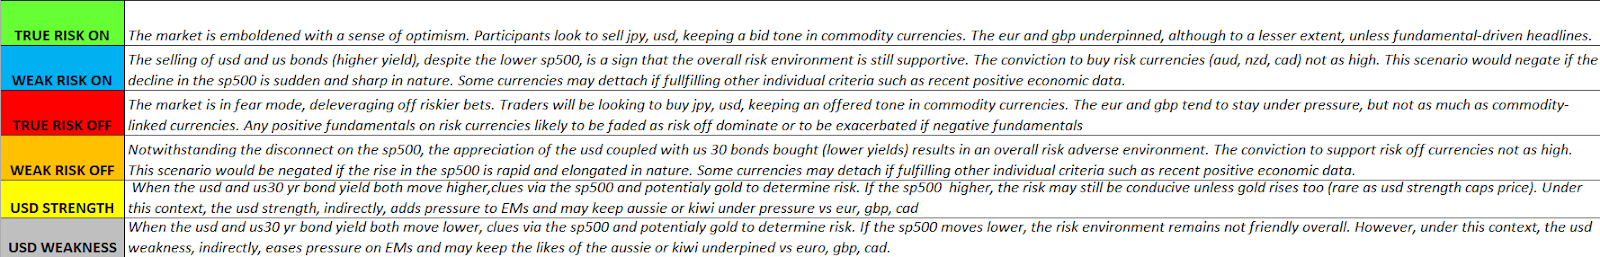
The short-term model indicates an environment where the world’s reserve currency (USD) is in high demand, with the persistent selling of US bonds (higher yields) propelling the momentum. Amid this environment, the SP 500 futures as the bellwether for the global equity market, have gone ballistic at the open of markets in Asia, hence the present dynamics of USD strength must be put into a context of ‘risk on’ as equities rise. The macro outlook only gets better for risk conditions, as the slope of the 5-DMA still qualifies as a ‘true risk on’ scenario, with currencies the likes of the Japanese Yen or other fundamentally weaker (CAD as of late) set to suffer the most. Note, if the USD can extend its gains through Monday, we might finally permute, from a macro standpoint, into an environment characterized by USD strength in a context of risk appetite (scenario #5).

Dashboard: Intermarket Flows & Technical Analysis

-Tx_eA1JNs1uXYRbs2192N1YgI4sBzy2YyFLCxUFIKdu5rpk62at-qGKZTj77Uni5XCVVYCIk87TKN0626FLEgKUkV96CcoFR6jGZMoei3LQ51BM3YBNIyQReCRZ84boyb-Gb4aq
screenshot_20190304_085727.png


EUR/USD has come under renewed downward pressure
even if the overall pockets of demand to amass the single currency in one’s portfolio remains quite solid. Testament of that stubbornness is the lingering range despite the rampant demand for USDs as the microenvironment enters a USD strength period amid soaring US yields, reflected on the collapse of the German-US yield spread. It is because of this sharp downward move in the yield spread that this pair still offer sufficient justification to be a sell on rallies at technically attractive areas. Last Friday, with the 10y yield spread serving as the true guidance of intrinsic value, the retest of 1.14 became a pristine opportunity to look for sell-side opportunities in line with the bearish divergence in the spread.

eu-6.jpg


If you are a swing trader looking for opportunities in the currency market, the recent pullback in the Sterling is worth monitoring. The strong bullish trend in US yields doesn’t make the USD the best market to capitalize the potential return of GBP demand, so pay attention to GBP vs AUD, JPY, CAD on the basis of ‘risk on’ conditions (negative JPY) and AUD, CAD (negative fundamentals). With such a powerful movement in the DXY and the UK vs US yield spread, it’s hard to justify much higher levels in GBP/USD at this stage, which is not the case if looking to play GBP longs vs above-mentioned currencies. Remember, the GBP is the market with the strongest macro bullish trend out there, that’s why picking the right timing to engage in a buy-side campaign could yield great opportunities.

gu-7.jpg


The USD/JPY, as in the case of Gold, are two markets currently experiencing the perfect storm
as the DXY rises in tandem with soaring US yields. From an hourly perspective, the market spent the entire Friday trading up through overbought conditions as per the slow stoch readings, which was a scenario able to be achieved due to the consistent sell-off of US bonds (higher yields). We can notice the growing influence that US yields have exerted on the price of the pair as of late, with the micro and macro correlation coefficients rising fast. Finding the appropriate technical levels to engage in ‘buy on dip’ strategies is the base scenario as per the latest technical/intermarket analysis, with the trend, the market structure and the slopes in the micro and macro backing up the trend.

uj-7.jpg


Do note that even if today’s Australian data came downbeat, and the technical picture has deteriorated substantially, the micro slope in correlated asset argues for a rebound in the AUD/USD. The report of the WSJ suggesting further progress in the US/China trade negotiations has been anchoring correlated assets (Yuan, equities…). From a technical perspective, the Aussie is testing the critical support areas at 7050-7060c with the latest push lower failing miserably to extend much beyond the prior low. This is all compounding evidence that makes further downside risks limited. A resumption of the Aus--US yield spread alongside DXY rallying would negate the constructive case.

au-7.jpg


As the table above shows, the extreme demand imbalance in the USD/CAD has resulted in another perfect ‘bullish storm’, which as in the case of the USD/JPY, makes this market a clear ‘buy on weakness’. The overextension in the hourly is clear as per the slow stoch, so be prudent on what areas you pick with the current pricing offering a very poor reward to risk for those swing/day traders, while intraday type accounts and momentum EAs may still find opportunities to capitalize as as long the flows emanating from correlated assets such as the DXY, Oil, yields remain in favor.

uc-5.jpg


Important Footnotes
  • Risk model: The fact that financial markets have become so intertwined and dynamic makes it essential to stay constantly in tune with market conditions and adapt to new environments. This prop model will assist you to gauge the context that you are trading so that you can significantly reduce the downside risks. To understand the principles applied in the assessment of this model, refer to the tutorial How to Unpack Risk Sentiment Profiles
  • Cycles: Markets evolve in cycles followed by a period of distribution and/or accumulation. The weekly cycles are highlighted in red, blue refers to the daily, while the black lines represent the hourly cycles. To understand the principles applied in the assessment of cycles, refer to the tutorial How To Read Market Structures In Forex
  • POC: It refers to the point of control. It represents the areas of most interest by trading volume and should act as walls of bids/offers that may result in price reversals. The volume profile analysis tracks trading activity over a specified time period at specified price levels. The study reveals the constant evolution of the market auction process. If you wish to find out more about the importance of the POC, refer to the tutorial How to Read Volume Profile Structures
  • Tick Volume: Price updates activity provides great insights into the actual buy or sell-side commitment to be engaged into a specific directional movement. Studies validate that price updates (tick volume) are highly correlated to actual traded volume, with the correlation being very high, when looking at hourly data. If you wish to find out more about the importance tick volume, refer to the tutorial on Why Is Tick Volume Important To Monitor?
  • Horizontal Support/Resistance: Unlike levels of dynamic support or resistance or more subjective measurements such as fibonacci retracements, pivot points, trendlines, or other forms of reactive areas, the horizontal lines of support and resistance are universal concepts used by the majority of market participants. It, therefore, makes the areas the most widely followed and relevant to monitor. The Ultimate Guide To Identify Areas Of High Interest In Any Market
  • Trendlines: Besides the horizontal lines, trendlines are helpful as a visual representation of the trend. The trendlines are drawn respecting a series of rules that determine the validation of a new cycle being created. Therefore, these trendline drawn in the chart hinge to a certain interpretation of market structures.
  • Correlations: Each forex pair has a series of highly correlated assets to assess valuations. This type of study is called inter-market analysis and it involves scoping out anomalies in the ever-evolving global interconnectivity between equities, bonds, currencies, and commodities. If you would like to understand more about this concept, refer to the tutorial How Divergence In Correlated Assets Can Help You Add An Edge.
  • Fundamentals: It’s important to highlight that the daily market outlook provided in this report is subject to the impact of the fundamental news. Any unexpected news may cause the price to behave erratically in the short term.
  • Projection Targets: The usefulness of the 100% projection resides in the symmetry and harmonic relationships of market cycles. By drawing a 100% projection, you can anticipate the area in the chart where some type of pause and potential reversals in price is likely to occur, due to 1. The side in control of the cycle takes profits 2. Counter-trend positions are added by contrarian players 3. These are price points where limit orders are set by market-makers. You can find out more by reading the tutorial on The Magical 100% Fibonacci Projection
 
Find my latest market thoughts

Relentless USD Demand, Mysterious Equity SellOff


Traders were left scratching the heads after a late sell-off in the S&P 500 led to a 'true risk-off' tone on Monday. The breakout of the range in the EUR/USD, the broad-based temporary demand for the Japanese Yen were some of the highlights in the currency market.

Date: 4/4/19

The Daily Edge is authored by Ivan Delgado, Market Insights Commentator at Global Prime. The purpose of this content is to provide an assessment of the market conditions. The report takes an in-depth look of market dynamics, factoring in fundamentals, technicals, inter-market in order to determine daily biases and assist one’s decisions on a regular basis. Feel free to follow Ivan on Twitter & Youtube.

Quick Take

Traders were left scratching the heads after a late sell-off in the S&P 500 led to a 'true risk-off' tone on Monday. The breakout of the range in the EUR/USD, the broad-based temporary demand for the Japanese Yen were some of the highlights in the currency market. The market is paying an awful lot more attention to yields as of late, as the correlation coefficient measurements in the Intermarket analysis section below shows. I also draw some parallels about the selling in stocks and the potential period we may be entering, in which the market reaches a period of climax optimism, having fully priced in the Sino-US trade deal, which according to a report by the WSJ over the weekend, looms near. As I remind the audience, it is precisely this 'buy the rumor sell the fact' dynamic what followed the first halt of tariff increases last year. Dejavu?

Currency Strength Meter

With the late NY ‘risk off’ twist came even more ample demand towards the Yen, which ended Monday as the best-performing currency. The currencies that followed by putting on a decent performance included the US Dollar as a ‘risk off’ currency, and surprisingly the Kiwi and to a lesser extent the Australian Dollar on hopes of an immediate Sino-US trade deal and one would think lack of interest to commit in either direction ahead of today's RBA policy meeting. The Sterling, the Euro and a battered Canadian Dollar did poorly, the latter still dragging on its downward momentum since the big miss from Friday’s Canadian GDP numbers.

In the 2nd window below, we find 3 currencies (GBP, USD, EUR) still displaying a macro trend as per the slope of the 5-DMA (125-HMA), while commodity currencies (AUD, NZD, CAD) and the JPY are yet to find sufficient demand interest to shift the dynamics of its weekly trend (macro measurement). The latter is rapidly getting there and much of its outlook going forward will hinge on the performance of equities.

screenshot_20190304_153106.jpg


Narratives in Financial Markets
  • A rather mysterious late sell-off in US stocks erases all the gains and some more from the main US equity indices, including the S&P 500. Talk in the floors has it that such reaction without a particular catalyst at a time when the WSJ had reported that the US and China were almost done hashing out all the necessary details before US and China Presidents sign it off.
  • Market participants should be reminded that a ‘buy the rumor sell the fact’ dynamics in the Sino-US trade conundrum was precisely what preceded the decision from the Trump administration back in Q4 2018 when the US halted further tariff increases on China as a transitionary period of negotiations followed, which is still dragging on. The day of the announcement led to a significant top in risky assets across financial markets.
  • US December construction spending fell by 0.6% vs +0.2% expected. The data will undoubtedly weight on the next reading of the US GDP and understandably adds concerns to a slowdown in the US economy on the back of last Friday’s disappointing US ISM and consumer confidence.
  • According to Reuters, citing sources familiar with the matter, June OPEC meeting is likely to extend curbs through year end and may only discuss easing supply caps if the output drops further in exempt producers, with Iran being the main actor involved if US ramps up sanctions.
  • Canada has agreed to extradite China’s Huawei CFO to the United States. In a separate report, the NYT reports that Huawei is looking to sue the US government for banning federal agencies from making use of its products. The detention of the Huawei executive has caused increased tensions among the US and China but not to the point of derailing trade negotiations.
Recent Economic Indicators & Events Ahead

ice_screenshot_20190304-172806.jpeg
ice_screenshot_20190304-172818.jpeg


Source: Forexfactory

RORO - Risk On Risk Off Conditions

95In6AF7BoJntQLJvo0jA2goOWZ4XUNJltOCQ6UnatWe9SqHs-Q05TDLlEjwrZDz9RTGWfB0kYkhFKNnUwHxOtR6WkGRB6ka_v0cdFHTEdQnWuJGtVl77TyT7DcNWVK_hItjcXAo
screenshot_20190304_153510.jpg


Micro conditions:
The spontaneous setback in US equities late on the day has led to a turnaround lower in the 25-HMA, which when combined with the bearish move in US yields and the sustained demand in the DXY puts us in a short-term (micro) risk-off environment. What this means, as the table above explains, is that “the market is in fear mode, deleveraging off riskier bets. Traders will be looking to buy jpy, usd, keeping an offered tone in commodity currencies unless fundamentally driven events still promote demand flows. The eur and gbp tend to stay under pressure, but not as much as commodity-linked currencies. Any positive fundamentals on risk currencies likely to be faded as risk off dominate.”

Macro conditions: Even the macro picture has turned ugly, as the 125-HMA downward exhibits and finally carves out a bottom in the DXY. These two assets moving in such respective directions, independently of the moves of the US yields, makes for some poor dynamics to support risky currencies. If the long-dated US yields were to also confirm a macro bearish trend (for now only micro), we’d be entering a ‘true risk off’ scenario. Until then, the conditions are best classified as macro USD strength (risk cues from equities). As per the table above, “when the usd and US30 yr bond yield move higher, look for clues via the S&P 500 and potentially gold to determine risk. If the S&P 500 is higher, the risk may still be conducive unless gold rises too (rare as usd strength caps price). Under this context, the usd strength, indirectly, adds pressure to EMs and may keep aussie or kiwi under pressure vs eur, gbp, cad.”

Dashboard: Intermarket Flows & Technical Analysis

-Tx_eA1JNs1uXYRbs2192N1YgI4sBzy2YyFLCxUFIKdu5rpk62at-qGKZTj77Uni5XCVVYCIk87TKN0626FLEgKUkV96CcoFR6jGZMoei3LQ51BM3YBNIyQReCRZ84boyb-Gb4aq
screenshot_20190305_083436.png


EUR/USD: Breakout Of The Range Shifts Focus South
1-4.jpg

  • Correlation with the 10y yield spread remains strong, which reinforces sell on rallies.
  • The resolution of the range sees a move strong in magnitude and speed, it creates a new bearish structure and it suggests supply imbalances may persist based on dow theory.
  • Both the micro and macro trends as per the 25/125HMA slope in line for a bearish continuation, which is further evidence on top of the downward structure based on cycles.
  • The 10y yield spread ends NY on an upward micro slope, which sees potential capital flows returning for a retest of the 1.1360 vicinity for a backtest of the range breakout.
  • Sellers should keep control of the 1.1385 level (midpoint of the broken range) to stay in charge of the directional bias, which for now has set out to be in their favor.

GBP/USD: Cluster of Bids Kept Selling Contained
2-4.jpg

  • Overall USD strength keeps the Sterling lower, which is also a function of the current pair’s regime, a clear proxy of the DXY (runs high correlation coefficients).
  • From a micro standpoint, there are no indications of buyers ready yet to step in unless algo-led spontaneous spikes on Brexit headlines or a significant setback in the USD, which is not foreseen now that the micro and macro trends in the DXY are both pointing up.
  • From a macro perspective, the only arguments to be found to keep the prospects of a trend resumption alive include the bullish macro slope in the UK-US bond yield spread, the macro trend based on the price of the pair (125HMA slope upwards) and/or positive Brexit headlines.

USD/JPY: Risk-Off Hiccups Result In Range Establishment
3-4.jpg

  • The disjointed currency market has seen solid USD demand both at times of ‘risk on’ but also ‘risk off’. The sell-off in risk on Monday has led to ample demand for JPY as one would expect, resulting in a range between 111.60 and 112.00 within the context of a bullish trend.
  • The all-time favorite correlation of following the DXY and US yields to determine the USD/JPY direction is back in vogue, running very high correlation coefficients (exc 1-month DXY).
  • If the short-term risk-off conditions we ended NY with persist, any retest of 112.00 (range top) should translate in value propositions to be a seller on strength even if one must be are that the trades would be against the dominant bull trend.
  • Buy on weakness becomes a Go-To strategy as long as the slopes of the DXY and US30Y both point in the same direction. Micro-wise the US30Y hinders the bullish prospects. From a macro standpoint, if equities find renewed demand, the macro DXY/US30Y still promote buy on dips.

USD/CAD: Firm Uptrend, Equilibrium Found At Hefty Levels
5-4.jpg

  • The sustained buying despite 24h+ of overbought conditions on the hourly as per the slow stoch is a reflection of the ample supply imbalances on the CAD post-Friday’s GDP miss.
  • We are starting to see the market paying more importance to the US-CA bond yield spread, as the focus shifts back towards a more dovish BOC this week after the dismal CA GDP read.
  • Other than the recovery in Oil prices, which has been ignored by negative CAD flows, the rest of technical/intermarket measures point at further strength in this market.
  • The risk-reward prospect is never going to be too attractive for a swing/day trader after 24h+ of trading under overbought conditions. Momentum traders still thriving in this market.
Important Footnotes
  • Risk model: The fact that financial markets have become so intertwined and dynamic makes it essential to stay constantly in tune with market conditions and adapt to new environments. This prop model will assist you to gauge the context that you are trading so that you can significantly reduce the downside risks. To understand the principles applied in the assessment of this model, refer to the tutorial How to Unpack Risk Sentiment Profiles
  • Cycles: Markets evolve in cycles followed by a period of distribution and/or accumulation. The weekly cycles are highlighted in red, blue refers to the daily, while the black lines represent the hourly cycles. To understand the principles applied in the assessment of cycles, refer to the tutorial How To Read Market Structures In Forex
  • POC: It refers to the point of control. It represents the areas of most interest by trading volume and should act as walls of bids/offers that may result in price reversals. The volume profile analysis tracks trading activity over a specified time period at specified price levels. The study reveals the constant evolution of the market auction process. If you wish to find out more about the importance of the POC, refer to the tutorial How to Read Volume Profile Structures
  • Tick Volume: Price updates activity provides great insights into the actual buy or sell-side commitment to be engaged into a specific directional movement. Studies validate that price updates (tick volume) are highly correlated to actual traded volume, with the correlation being very high, when looking at hourly data. If you wish to find out more about the importance tick volume, refer to the tutorial on Why Is Tick Volume Important To Monitor?
  • Horizontal Support/Resistance: Unlike levels of dynamic support or resistance or more subjective measurements such as fibonacci retracements, pivot points, trendlines, or other forms of reactive areas, the horizontal lines of support and resistance are universal concepts used by the majority of market participants. It, therefore, makes the areas the most widely followed and relevant to monitor. The Ultimate Guide To Identify Areas Of High Interest In Any Market
  • Trendlines: Besides the horizontal lines, trendlines are helpful as a visual representation of the trend. The trendlines are drawn respecting a series of rules that determine the validation of a new cycle being created. Therefore, these trendline drawn in the chart hinge to a certain interpretation of market structures.
  • Correlations: Each forex pair has a series of highly correlated assets to assess valuations. This type of study is called inter-market analysis and it involves scoping out anomalies in the ever-evolving global interconnectivity between equities, bonds, currencies, and commodities. If you would like to understand more about this concept, refer to the tutorial How Divergence In Correlated Assets Can Help You Add An Edge.
  • Fundamentals: It’s important to highlight that the daily market outlook provided in this report is subject to the impact of the fundamental news. Any unexpected news may cause the price to behave erratically in the short term.
  • Projection Targets: The usefulness of the 100% projection resides in the symmetry and harmonic relationships of market cycles. By drawing a 100% projection, you can anticipate the area in the chart where some type of pause and potential reversals in price is likely to occur, due to 1. The side in control of the cycle takes profits 2. Counter-trend positions are added by contrarian players 3. These are price points where limit orders are set by market-makers. You can find out more by reading the tutorial on The Magical 100% Fibonacci Projection
 
Find my latest market thoughts

Bond Yield Spreads Playing A Greater Role in FX


While it may be argued that there is still some residual demand to be found once the US and China can ink a trade agreement, the price action this week is quite revealing about a potential permutation in regime.

Date: 3/6/19

The Daily Edge is authored by Ivan Delgado, Market Insights Commentator at Global Prime. The purpose of this content is to provide an assessment of the market conditions. The report takes an in-depth look of market dynamics, factoring in fundamentals, technicals, inter-market in order to determine daily biases and assist one’s decisions on a regular basis. Feel free to follow Ivan on Twitter & Youtube.

Quick Take

While it may be argued that there is still residual demand to be found once the US and China can ink a trade deal, the price action this week is quite revealing about a potential permutation in the rhetoric that has dominated flows.

Are we getting to a point where the market has priced in all there was to be discounted from the Sino-US story (assumption if a deal is almost baked in the cake) and the attention is swiftly shifting towards economic fundamental divergences?

Risk on risk off fluctuations, the growing influence of capital flows derived off yield spreads (US at the forefront of the recent divergences spotted) must simultaneously coexist with the immediate risk of politics in Europe (Brexit) as we enter a key period.

In the last week or so, the typical risk-on, risk-off gyration have started to decouple due to fundamentally-charged triggers in Canada, Australia to name a few. That's why it's been a fairly disjointed affair finding the connections between risk and sensitive currencies to deleveraging episodes in financial markets. This decoupling also applies to the USD, which by default tends to debilitate when risk thrives; it has not been the case as the currency keeps its appeal intact.

What we are seeing is a market that is increasing its correlations toward bond yield spreads, and that is evidence that more attention is being paid towards the prospects of growth and economic divergences on an individual merit basis. At the center of this new re-adjustment towards yield differentials we find the sell-off in US bonds, which keeps stubbornly high demand towards the US Dollar in a world with ultra-low interest rates.

If you are looking for that extra layer of conviction on your Forex trades, this is the time to factor in the bond yield spread to gauge the next flows while keeping an open mind about what currencies may or may not benefit from risk-on or risk-off as fundamentals and politics (EUR, GBP) play an increasing role.

RORO - Risk On Risk Off Conditions

auhnIeKCboP36uxSW_RDgyNQvbTGSxpg15oXsjcpirkOLkiydbQNxW3gTblawQiZURTza_d-gVVo1EO3Y-5cpY75kL6GWIK-di4BsqgZ8_iQ6vwFs_wWQjTRxg9MXSVBcXweUKwm
roro-6.jpg


In the near term (microflows), the pendulum has swung towards ‘true risk off’ conditions, an environment characterized by a firmer JPY and USD. The recent aggressive setback in the S&P 500, alongside back-to-back corrective days in US yields coupled with a rising USD, qualifies the latest daily fluctuations as a juncture not risk friendly, even if the relatively contained range in the S&P 500 over the last 24h has somehow tamed the selling of risky assets.

Evidence of that, even if more fundamentally driven, is the performance of the Aussie and the Kiwi, on the back of the RBA policy meeting. I must say that in the last week, we are starting to see some disjointed FX moves away from respecting RORO conditions, as divergence in fundamentals take centerstage.

That’s the reason we’ve seen such a depressed CAD since last Friday, as the market prices in a more dovish BOC this week. In terms of the EUR and GBP, as the Brexit deadline approaches, that’s at the epicenter to determine next flows. Meanwhile, the USD and US yields for this matter, have both been rising as the US economy keeps showing signs or a strong comeback after the hiccups of Q4 and post the US government shutdown.

We are transitioning into a period where fundamental divergences may start to play a greater role to assess the forward-looking performance in currencies, a very important consideration that one must reconcile with when looking to gauge flows beside the RORO-led rotations.
When it comes to the macro picture, the 5-DMA slope in the DXY and US yields is firmly pointing upwards, which when combined with a flat 5-DMA slope in the S&P 500, makes the current context a source of concern to see further deleveraging on risky assets if equities remain fragile. If the risk-off conditions extend, playing risk-sensitive currencies such as the CAD at a time of negative fundamental news, can potentially result, as seen recently, in ample movements.

Dashboard: Intermarket Flows & Technical Analysis

X8OkqIRcEOMkE78TwakUdg10LUXDdnzOeJxmujUpVzqs9NmQE6oymswdFB14pqQ2lkNxZfbcQAFuv9vebLVcv43XIyiIU8H1IpDdY6UXiHaB5m67QrhAZUz2AF5JDUwC2WyFwUze
screenshot_20190306_113645.png


EUR/USD: In A Bearish Cycle Phase, Divergence W/ Bond Yield Spread
  • Technicals are clearly bearish with lower lows printed.
  • Negative Brexit headlines the catalyst for the latest sell-off.
  • Clear divergence opening up between price action and 10-y bond yield spread.
  • Higher risks of playing bullish yield divergence as Brexit key driver and situation fluid.
  • The 5-DMA slope has turned lower for the first time since mid-February.
eu-7.jpg


GBP/USD: V-Shaped Turn at Key Horizontal Line

  • The Sterling is knocked down by negative Brexit headlines that led to algo selling.
  • The rebound off 1.31 round number erases most of the daily losses.
  • No clear directional biases developing amid two of the strongest currencies as of late.
  • The bond yield spread still constructive but DXY adds downward pressure.
  • The pair no longer characterized as in a bullish trend from a macro perspective (5-DMA).
gu-8.jpg


USD/JPY: Return Of Risk-Off Flows Encapsulates The Pair

  • The micro trend in US yields is causing JPY demand to make its way back.
  • The sharp sell-off in US equities on Tuesday has firmed up prognosis of value selling strength.
  • The DXY strength keeps demand on weakness but alone unlikely to sustain the bull trend.
  • A resolution of the tight range critical to stimulating next directional flows.
  • The overall technical outlook remains positive as per higher highs prior to current acceptance.
uj-8.jpg


AUD/USD: Sellers In Control As Range Breakout Looms

  • The Aussie is pressured on the back of a poor Aus Q4 GDP reading.
  • Across the board bearish signals from intermarket analysis see risk skewed to the downside.
  • Macro bearish trends in AU-US bond yield spread and DXY+Yuan (inverted) adds to AUD - case.
  • Break and hold sub 7050/60 swing low is critical to open up next target at 70c.
au-8.jpg


USD/CAD: Clearest Bull Trend In the FX Space

  • Combo of risk-off and negative Canadian GDP last Friday a double whammy for bears.
  • The order flows continues to play out in a low vol fashion, with momo traders thriving.
  • No indication via DXY or bond yield spread that the trend is unjustified.
  • BoC policy meeting is the next catalyst to inject volatility into the pair.
  • The divergence between price action and Oil quite notable (not as big of a role last 5 days).
uc-6.jpg


Gold: Follows DXY/US Yields In Locksteps

  • The perfect bearish storm of higher DXY, short-dated US yields continues.
  • Technicals have turned sour, with the acceptance near trend lows a bad omen for bulls.
  • The synchronicity in bullish movements in the DXY/UST yields is a recipe to sell strength.
  • Micro and macro trends in DXY/UST yields agree for more ambitious bearish targets.
gold-5.jpg


AUD/JPY: Setting Up For An Outlier Move

  • Risk-off dynamics paired with negative fundamentals may see significant supply imbalances.
  • Breakout of the range sets out a projected target of at least 50 pips towards 78.50.
  • USD strength damages outlook for EMs and the Aussie. S&P 500 key determiner.
  • Buy on weakness on the thesis of a China-US trade deal an argument for contrarians.
aj-2.jpg


EUR/AUD: Follow The Yield Spread To Keep You Safer

  • From a macro perspective, the German-Aus bond yield spread has acted reliably.
  • The upward trend in the yield spread alongside corrective structure bodes well for the Euro.
  • The macro trend derived off price action provides further technical support.
  • The developing trend in the Yuan (lower) + negative Aus data adds to the bullish case.
ea-2.jpg


NZD/USD: As Negative As It’s Been For Weeks

  • The absence of own fundamental drivers keeps NZD playing catch up with lower Aussie.
  • DXY strength has all the merit amid a relatively strong performance by the NZD vs peers.
  • Clear macro bearish trend in the NZ-US bond yield spread (highly correlated micro + macro).
  • If momentum picks up, next bear target found at the origin of the RBNZ-led spike at 0.6750.
nu-4.jpg


Important Footnotes
  • Risk model: The fact that financial markets have become so intertwined and dynamic makes it essential to stay constantly in tune with market conditions and adapt to new environments. This prop model will assist you to gauge the context that you are trading so that you can significantly reduce the downside risks. To understand the principles applied in the assessment of this model, refer to the tutorial How to Unpack Risk Sentiment Profiles
  • Cycles: Markets evolve in cycles followed by a period of distribution and/or accumulation. The weekly cycles are highlighted in red, blue refers to the daily, while the black lines represent the hourly cycles. To understand the principles applied in the assessment of cycles, refer to the tutorial How To Read Market Structures In Forex
  • POC: It refers to the point of control. It represents the areas of most interest by trading volume and should act as walls of bids/offers that may result in price reversals. The volume profile analysis tracks trading activity over a specified time period at specified price levels. The study reveals the constant evolution of the market auction process. If you wish to find out more about the importance of the POC, refer to the tutorial How to Read Volume Profile Structures
  • Tick Volume: Price updates activity provides great insights into the actual buy or sell-side commitment to be engaged into a specific directional movement. Studies validate that price updates (tick volume) are highly correlated to actual traded volume, with the correlation being very high, when looking at hourly data. If you wish to find out more about the importance tick volume, refer to the tutorial on Why Is Tick Volume Important To Monitor?
  • Horizontal Support/Resistance: Unlike levels of dynamic support or resistance or more subjective measurements such as fibonacci retracements, pivot points, trendlines, or other forms of reactive areas, the horizontal lines of support and resistance are universal concepts used by the majority of market participants. It, therefore, makes the areas the most widely followed and relevant to monitor. The Ultimate Guide To Identify Areas Of High Interest In Any Market
  • Trendlines: Besides the horizontal lines, trendlines are helpful as a visual representation of the trend. The trendlines are drawn respecting a series of rules that determine the validation of a new cycle being created. Therefore, these trendline drawn in the chart hinge to a certain interpretation of market structures.
  • Correlations: Each forex pair has a series of highly correlated assets to assess valuations. This type of study is called inter-market analysis and it involves scoping out anomalies in the ever-evolving global interconnectivity between equities, bonds, currencies, and commodities. If you would like to understand more about this concept, refer to the tutorial How Divergence In Correlated Assets Can Help You Add An Edge.
  • Fundamentals: It’s important to highlight that the daily market outlook provided in this report is subject to the impact of the fundamental news. Any unexpected news may cause the price to behave erratically in the short term.
  • Projection Targets: The usefulness of the 100% projection resides in the symmetry and harmonic relationships of market cycles. By drawing a 100% projection, you can anticipate the area in the chart where some type of pause and potential reversals in price is likely to occur, due to 1. The side in control of the cycle takes profits 2. Counter-trend positions are added by contrarian players 3. These are price points where limit orders are set by market-makers. You can find out more by reading the tutorial on The Magical 100% Fibonacci Projection
 
Find my latest market thoughts

The Vanquishment Of The Unfounded ECB Optimism


It’s all about the Euro as Friday gets underway. The ECB was utterly and without any ambiguity much more dovish than the market had anticipated after it revealed a trifecta of measures (lower growth forecasts, push out of the forward guidance and a new TLTRO program).

Date: 3/8/19

The Daily Edge is authored by Ivan Delgado, Market Insights Commentator at Global Prime. The purpose of this content is to provide an assessment of the market conditions. The report takes an in-depth look of market dynamics, factoring in fundamentals, technicals, inter-market in order to determine daily biases and assist one’s decisions on a regular basis. Feel free to follow Ivan on Twitter & Youtube.

Quick Take

It’s all about the Euro as Friday gets underway. The ECB was utterly and without any ambiguity much more dovish than the market had anticipated after it revealed a trifecta of EUR-negative measures (lower growth forecasts, push out of the forward guidance and a new TLTRO program).

One thing is to speculate on the ultimate outcome of what appears inevitable, that is, that sooner or later the ECB would fully cave in by recognizing there is no way in hell they can exit their unorthodox policies. Another thing very different, and that’s what makes trading financial market such a challenging endeavor, is timing when the domino pieces will start falling. Judging by the reaction of the Euro - lowest against the USD since mid-2017 -, the market was caught by surprise not expecting such boldness in the ECB rhetoric.

After the dust settled, we face a Euro battered, a Pound unable to find renewed demand on lack of Brexit breakthroughs, a USD and JPY being the safest houses as micro/macro ‘true risk off’ conditions settle in, while the commodity complex suffers fundamentally gloomy times, especially the AUD and CAD.

Currency Strength Meter

The Euro got hammered on the back of what’s coined in some reports I've been reading this morning as Draghi’s triple, that is, the admission that an exit from its negative rates settings won’t occur in 2019, the downgrade in growth and a new TLTRO. Meanwhile, on the other side of the spectrum, the Japanese Yen and the US Dollar were propelled to much higher levels on the combination of EUR weakness (by default DXY positive) and ‘true risk off’. Sandwiched in relatively confined ranges were the commodity currencies, while the Sterling also came under pressure as pessimism over a breakthrough in the UK-EU Brexit talks reign.

So, where does the latest fluctuation in currency prices leaves us from a trend-generation standpoint? Right off the bat, we can see the Euro is joining the Canadian Dollar in macro bearish dynamics as the thick lines in the 2nd chart below exhibit. Interestingly, the Pound has also lost enough steam to show bearish tendencies at a macro level (measured by the 5-DMA slope). On the contrary, the USD and the JPY have risen victorious courtesy of the latest deleveraging spell by projecting bullish dynamics, both from a micro and macro perspective. Lastly, we see the Oceanic currencies, finding enough pockets of demand, especially the Kiwi, to keep its micro and macro outlook mildly bullish.

meter.jpg


Narratives in Financial Markets
  • ECB President Draghi finally conceded defeat on its overly hawkish outlook of the European economy by revealing a new round of TLTRO (cheap funding for banks), downgrading the growth forecast and most importantly, pushing further out the forward guidance in rates. As a result, the Euro trades at the lowest since mid-2017 against the US Dollar.
  • The majority of Brexit-related reports had a common denominator. There is no breakthrough in amending the divorce deal between the UK and the EU. There has been reports of a new offer made by the EU to the UK on the backstop which appears to fall short of UK demands. Reuters expanded on the story by noting nothing suggests anything will change in talks in the next 48h.
  • According to a story by the NYT, Chinese officials are increasingly worried about any last minute changes in a trade deal between the US and China. As the NYT notes, “some of the biggest details like the enforcement mechanism and the timing for the removal of tariffs still haven’t been hammered out. China is worried that details may not be as favorable.”
  • On the back of the dovish outcome during Wednesday’s BoC policy meeting, BOC Deputy Lynn Patterson presented the latest projections as part of the economic progress report. It turned out to be a reiteration of what the statements carried by the BOC statement. In a way, what this latest report shows is that their forecasts have been highly inaccurate and need more time to find out how bad things can get from here on out, which is a pattern among G10 Central Banks.
Recent Economic Indicators & Events Ahead

cal-2.jpeg
cal2.jpeg

Source: Forexfactory

RORO - Risk On Risk Off Conditions

95In6AF7BoJntQLJvo0jA2goOWZ4XUNJltOCQ6UnatWe9SqHs-Q05TDLlEjwrZDz9RTGWfB0kYkhFKNnUwHxOtR6WkGRB6ka_v0cdFHTEdQnWuJGtVl77TyT7DcNWVK_hItjcXAo
roro-7.jpg


The pronounced downward angle of the 25-HMA slope states a clear fact, that is, the microenvironment has firmed up its ‘true risk off’ nature. But it gets worse, as we've also permuted into a macro ‘true risk off’ backdrop following the aggressive movements in equities (down), US bond yields (down) and the DXY (up). To top it off, gold has found very strong buy-side interest to counter-balance the strong rise in the DXY and keep the precious metal in a tight range.

As a reminder, a ‘true risk off’ environment is characterized by a market that is in fear mode, deleveraging off riskier bets. Traders will be looking to buy two currencies above all others (JPY and USD), keeping an offered tone in commodity currencies unless other currencies get hit by negative fundamentals/politics, as it’s the case of the Euro on the ECB dovish turnaround or the GBP on Brexit. This has caused the European currencies to suffer greater losses than commodity-linked currencies even in a ‘true risk off’ context.

Dashboard: Intermarket Flows & Technical Analysis

screenshot_20190308_110147.png
screenshot_20190308_105415.png


Summary: Intermarket Flows & Technical Analysis

EUR/USD: Massive Mark Down As ECB Reveals Dovish Trifecta
  • The triple news by the ECB included slashing growth, deferring exit of negative rates and the announcement of a new TLTRO, leading to a major re-adjustment of the Euro value.
  • The next focal point includes the US NFP figures. One must be prudence if exposure heading into the high-impact volatile event. A headline number of 181k is expected.
  • The breakout of the 1.12 could unravel a marked improvement in the low vol regime of the pair after many months of depressed market fluctuations.
  • No signs of buying interest at the elongated lows, with the latest push by the sellers even breaking through a 100% projection target based on the last POC print.
  • The combination of negative ECB-induced fundamental news, no progress in Brexit, risk-off tone has promoted increased supply imbalanced in the pair.
  • The main ‘leading’ indicator of the EUR/USD continues to be, as per the macro/micro correlation coefficients, the 10-year yield differential between Germany and the US.
eu-8.jpg


GBP/USD: DXY Strength Offsets Improvement in Yield Spread

  • No Brexit breakthrough, DXY fortitude added further pressure on the Sterling, even if the slide in prices is starting to show a tepid divergence with a rising UK-US yield spread.
  • The next focal point includes the US NFP figures. One must be prudence if exposure heading into the high-impact volatile event. A headline number of 181k is expected.
  • The micro and macro cycles have turned bearish but the real test comes upon a breakout of the 1.3050/1.30 area (POC last range + round number).
  • It’s going to take a deterioration in the Brexit headlines to see a further unwinding of longs as the run in DXY mainly a function of EUR weakness plus spells of risk-off.
gu-9.jpg


USD/JPY: Low Vol Gyrations As ‘True Risk Off’ Dominates

  • Fairly balanced flows as both currencies benefit from cross-asset flows. The DXY spike post ECB offsets the textbook ‘true risk off’ move by equities and fixed income.
  • The next focal point includes the US NFP figures. One must be prudence if exposure heading into the high-impact volatile event. A headline number of 181k is expected.
  • The contained pullback at times of ‘true risk off’ bodes well for the pair conditioned to the benign outlook in the DXY. A recovery in equities and/or yields necessary to resume uptrend.
  • The corrective nature of the price action in the last week vs impulsive rally from late Feb suggests the order flow is still very much constructive of higher prices.
  • The loss of correlation between the pair and the DXY is simply a reflection of the ‘true risk off’ nature of the current market conditions, where the Yen tends to be king despite a rising USD.
  • uj-9.jpg
AUD/USD: Accentuated Divergence W/Yield Spreads Amid Risk-Off
  • The Aussie is starting to look cheap if accounting for capital flows in search of yields as the bond yield differential between Australia and the US improves further…
  • The next focal point includes the US NFP figures. One must be prudence if exposure heading into the high-impact volatile event. A headline number of 181k is expected.
  • However, in an environment of ‘true risk off’, the drop in equities (rising correlation) alongside the strength in the DXY so far counterbalances the positive yield spread development.
  • The micro and macro trend derived off price action still argues the path of least resistance remains lower even if major buy-side interest is expected at 0.70c.
  • Any signs of strength in equities or fixed income that may relax the ‘true risk off’ conditions may provide a genuine buy-side opportunity around the round number, but remember US NFP.
au-9.jpg


USD/CAD: Running Risk Of Long Liquidations After 3 Cents Rally

  • Whenever we see a pair experience a 300 pips rally from bottom to top under the lowest vol regime in years, be wary of the risks of long liquidations near-term.
  • The next focal point includes the US NFP + Canadian job figures. One must be prudence if exposure heading into the high-impact volatile events.
  • Significant divergence with Oil but beware the energy instrument has been gradually decoupling as a reliable indicator with the DXY and bond yield spreads playing a greater role.
  • Any pullback is seen as a buy-side opportunity at key decision points in what’s become one of the clearest trending markets ever since the miss in Canadian GDP, and then exacerbated by a dovish BOC and the transition into ‘true risk off’ conditions.
uc-7.jpg


Gold: Low Interest As Conflicting Signals Emerge

  • The two strongest correlated assets (DXY, US02y) driving the price of gold are moving in completely opposite directions, keeping the directional bias neutral.
  • The next focal point includes the US NFP figures. One must be prudence if exposure heading into the high-impact volatile event. A headline number of 181k is expected.
  • Break outside the current narrow range is a precondition to engaging away from the noise in anticipation of the next expansion in price after 4 days of consolidation.
  • The consolidation of the price could be interpreted as absorption at a critical demand juncture with reference dating back Jan 21-24, when a strong demand originated.
gold-6.jpg


AUD/JPY: Perfect Bearish Storm This Week

  • Not only the data out of Australia has come softer-than-expected (Q4 GDP, retail sales) but the ‘true risk off’ has exacerbated the pain in the Aussie vs Yen exchange rate.
  • A cluster of bids is expected around the 78.20-78.00 vicinity where a 100% proj target off the 79.80-79.00 range meets with a psychological round number.
  • The impulsivity of the selling flows vs the corrective nature of the buy-side action is a clear indication of a market fully dominated by sellers at this stage.
  • The correlation between fixed income (US 30Y) , equities (SP500) and the pair have reached levels near a ratio of 1:1 as one would expect given the ‘true risk off’ context.
  • With the pre-conditions of the fixed income and equities aligning in favor, this is a market with an increasing appeal to short of strength at key decision points.
aj-3.jpg


EUR/AUD: Follow The Yield Spread As True Leading Indicator

  • The weakness in the Yuan and equities should act as a force to limit the downside scope in the market, even if the bond yield spread remains by far the most accurate indicator of flows.
  • The ECB event, by itself, should be enough of a driver to keep the prospects of EUR supply imbalances firmly in place near term, even if AUD not best positioned to exploit EUR weakness.
  • As the table above shows, this is a market that still shows fairly rotational credences as both currencies are suffering from deteriorating fundamentals in recent times.
  • What this means is that any overextension of a move carries a bigger risk of a reversal as opposed to the same short EUR play against the likes of the USD or JPY.
ea-3.jpg


NZD/USD: Risk-Off Dictates Bearish Direction But Value Higher

  • If ‘true risk off’ conditions can relax, watch for a potential recovery in the Kiwi as the bond yield spread keeps a bullish structure of higher highs and higher lows (blue line).
  • Technicals remain suppressive for the interest of buyers due to the deleveraging of risky bets, of which the Kiwi is clearly part of, resulting in the highlighted divergences in yield spread.
  • Be wary of being overly fixated in the yield spread (lower correlation) as long as the ‘true risk off’ nature of this market continues to play out, as that’s a period to stay defensive.
  • The Kiwi found a pocket os strong buying interest originating off the spike in demand from the RBNZ-induced outcome from back on Feb 13th, making the area a temp bottom to be found.
nu-5.jpg


Important Footnotes
  • Risk model: The fact that financial markets have become so intertwined and dynamic makes it essential to stay constantly in tune with market conditions and adapt to new environments. This prop model will assist you to gauge the context that you are trading so that you can significantly reduce the downside risks. To understand the principles applied in the assessment of this model, refer to the tutorial How to Unpack Risk Sentiment Profiles
  • Cycles: Markets evolve in cycles followed by a period of distribution and/or accumulation. The weekly cycles are highlighted in red, blue refers to the daily, while the black lines represent the hourly cycles. To understand the principles applied in the assessment of cycles, refer to the tutorial How To Read Market Structures In Forex
  • POC: It refers to the point of control. It represents the areas of most interest by trading volume and should act as walls of bids/offers that may result in price reversals. The volume profile analysis tracks trading activity over a specified time period at specified price levels. The study reveals the constant evolution of the market auction process. If you wish to find out more about the importance of the POC, refer to the tutorial How to Read Volume Profile Structures
  • Tick Volume: Price updates activity provides great insights into the actual buy or sell-side commitment to be engaged into a specific directional movement. Studies validate that price updates (tick volume) are highly correlated to actual traded volume, with the correlation being very high, when looking at hourly data. If you wish to find out more about the importance tick volume, refer to the tutorial on Why Is Tick Volume Important To Monitor?
  • Horizontal Support/Resistance: Unlike levels of dynamic support or resistance or more subjective measurements such as fibonacci retracements, pivot points, trendlines, or other forms of reactive areas, the horizontal lines of support and resistance are universal concepts used by the majority of market participants. It, therefore, makes the areas the most widely followed and relevant to monitor. The Ultimate Guide To Identify Areas Of High Interest In Any Market
  • Trendlines: Besides the horizontal lines, trendlines are helpful as a visual representation of the trend. The trendlines are drawn respecting a series of rules that determine the validation of a new cycle being created. Therefore, these trendline drawn in the chart hinge to a certain interpretation of market structures.
  • Correlations: Each forex pair has a series of highly correlated assets to assess valuations. This type of study is called inter-market analysis and it involves scoping out anomalies in the ever-evolving global interconnectivity between equities, bonds, currencies, and commodities. If you would like to understand more about this concept, refer to the tutorial How Divergence In Correlated Assets Can Help You Add An Edge.
  • Fundamentals: It’s important to highlight that the daily market outlook provided in this report is subject to the impact of the fundamental news. Any unexpected news may cause the price to behave erratically in the short term.
  • Projection Targets: The usefulness of the 100% projection resides in the symmetry and harmonic relationships of market cycles. By drawing a 100% projection, you can anticipate the area in the chart where some type of pause and potential reversals in price is likely to occur, due to 1. The side in control of the cycle takes profits 2. Counter-trend positions are added by contrarian players 3. These are price points where limit orders are set by market-makers. You can find out more by reading the tutorial on The Magical 100% Fibonacci Projection
 
Find my latest market thoughts

‘True Risk On’ Back In Vogue, Brexit Vote Awaits


In what was a low key affair, the Pound was the biggest mover. The Sterling tops the gainers’ leaderboard as UK PM May secured further concessions from the EU, while a ‘true risk on’ microenvironment led to a major deterioration in the Yen exchange rate as well as the USD.

Date: 3/12/19

The Daily Edge is authored by Ivan Delgado, Market Insights Commentator at Global Prime. The purpose of this content is to provide an assessment of the market conditions. The report takes an in-depth look of market dynamics, factoring in fundamentals, technicals, inter-market in order to determine daily biases and assist one’s decisions on a regular basis. Feel free to follow Ivan on Twitter & Youtube.

Currency Strength Meter

In what was a low key affair, the Pound was the biggest mover. The Sterling tops the gainers’ leaderboard as UK PM May secured further concessions from the EU, while a ‘true risk on’ microenvironment led to a major deterioration in the pricing of the Japanese Yen as well as the US Dollar. Despite the renewed optimism on Brexit, the buying flows in the Euro were very limited in comparison. The Australian Dollar and the Kiwi did relatively well while the Canadian Dollar fell somewhere in the middle.

meter-1.jpg


Main Narratives in Financial Markets
  • UK PM May has secured legally binding changes that strengthen and improve the Brexit withdrawal agreement after the Strasbourg meeting with Juncker. Pound soared on the news.
  • Despite not being a clear catalyst, stocks in the US posted very strong gains, with the S&P 500 ending about 1.5% higher while the Nasdaq Composite rose by over 2%.
  • US Trump administration has released the $4.7T budget proposal for the fiscal year 2020, with the spending up almost 5% from the 2019-2020 budget.
  • US retail sales for January, released with a delay due to the US government shutdown, came upbeat at 0.2% vs 0% exp while the core reading was even better at +0.9%. With regards to the prior month data, it was revised lower at -1.6% vs -1.2%.
Recent Economic Indicators & Events Ahead

cal-3.jpeg


Source: ForexfactoryRORO - Risk On Risk Off Conditions

wHT35Cb1fjAOnNuIANxhnU5af1a6Zu3LKcgjC5rT5nLND3-gGwtN8P2iiPK0gc-St-nFx_3Ure9SPf73pDctqtKL5lW1_XRxWPnNsBcrXZscfRIBijLqH4YzfOtBgcYhxEl6pFy7
roro-8.jpg


The massive gains in stocks, combined with the sharp selling of the DXY late on the day (driven by Brexit headlines), alongside the recovery in global yields with the US 30Y bond as the bellwether, classifies the current microenvironment as ‘true risk on’.

From a weekly perspective, which is the time horizon used to interpret the macro flows, the spike in equities has been so strong that even the 5-DMA slope has now turned positive, although this is still not backed up by fixed income, with the macro slope in yields still down, while the macro tendency in the US Dollar remains bullish.

What this means is that the ‘true risk on’ environment still needs to be taken as part of a ‘weak risk off’ context as per the RORO model. Remember, under such depressed vol conditions, excluding the GBP, the developing micro dynamics have become far more relevant to stay in tune with the fluid and constant change of market flows. In other words, notwithstanding the macro ‘weak risk off’, it’s the micro ‘true risk on’ that should be kept more present on everyone’s mind when coming up with your approach today.

Dashboard: Intermarket Flows & Technical Analysis

mMgw-2lydB-bkMTCl8_QRrde3_bY1DX07hMrqM8k5ofM3RAD_rPtW3pmwgSjT5Gpnx7pT8LHaKx443h4XDtBuk4nygiyTyAB1GC4cUSPGqylX6uSBrEhxI4Iw82Wai5-j-2-5yoj
screenshot_20190312_101845.png


Summary: Intermarket Flows & Technical Analysis

EUR/USD: Piggybacking A Bullish GBP

  • With the attention fully anchored around the latest Brexit developments, the Euro is acting as a proxy to the flows in the Sterling, further assisted by a softer USD tone.
  • Expect volatility to increase from the normal depressed levels as a result as the UK prepares to vote on the amended Brexit withdrawal agreement.
  • The playbook for the Euro is likely to deviate away from the tight correlation with the German vs US yield spread to instead behave more erratically conditioned by Brexit.
  • The 2-day recovery post the elongated ECB-induced sell-off is testing a critical level of resistance as per the intersection of a descending trendline circa 1.1275.
  • The market is structurally bearish with an increasing number of supply clusters from 1.1275 up to 1.1325, with bids through 1.13 to test the ECB-led supply origin.
eu-9.jpg
eu-c.jpg

GBP/USD: Monster Move As Brexit Optimism Is Back
  • The Sterling has an impressive 300 pips + outlier day as reports emerge that the UK has secured a concession with the EU to improve the Brexit divorce deal.
  • The spike looks overdone based on the status of the correlated instruments, although the erratic algos-led vol this week is likely to see a decoupling of reliable correlations.
  • Starting from 1.3190-1.3200, there are well-defined areas where most buying interest is expected as per the most recent highs, lows and demand origins.
  • Trading the Sterling is going to be extremely tricky as episodes of high vol should be expected on a headline-by-headline basis as the next Brexit vote is just hours away.
gu-10.jpg
gu-c.jpg

USD/JPY: Buy On Dips Re-Emerges As Risk Recovers
  • The buy on weakness strategies have flourished in the last 24h of trading after an aggressive ‘true risk on’ swing led by a strong rise in stocks.
  • The next area of critical supply is found from 111.50. Once offers start to get filled on a retest, monitor very closely the trifecta of equities, fixed income, DXY to plan your trading approach.
  • As the correlation dynamics stand by the end of business in NY, the areas highlighted in green should attract solid buy-side interest as long as the cross-asset flows are conducive.
uj-11.jpg
uj-c.jpg

AUD/USD: Re-Testing A Critical Supply Area
  • Negative fundamentals continue to pile up against the Aussie following the latest downbeat NAB business conditions/confidence, leading to a test of Monday’s POC.
  • From a micro perspective, the performance of the DXY + Yuan, coupled with the mood in the equity market, has acted as the key determiners of the Aussie direction.
  • From a macro perspective, the AU-US bond yield spread continues to be, alongside equities, the most reliable indicator to gauge the next direction in detriment of the DXY +Yuan flows.
  • The short-term recovery has the characteristics of being very corrective in nature vs the more impulsive reaction during the latest selling period. A bad omen from an order flows standpoint.
  • As intermarket flows stand, with equities on the rise and the DXY weaker across the board, any dips still represent a buying opportunity even if the upside looks technically quite limited.
au-10.jpg
au-c.jpg

USD/CAD: Transition From Bullish Trend Into A Range
  • The micro weakness in the DXY and the US-CA bond yield spread since last Friday has resulted in the establishment of a consolidation period.
  • We are going through a low correlation period with Oil, so pay a lot more attention to the combination of DXY and bond yield spreads to stay on the right side of the market.
  • The BOC-led demand from March 6th keeps acting as a firm area of demand to absorb the latest selling rounds, which does make sense on macro bullish DXY + US-CA yield spreads.
  • Any re-adjustment higher in the micro slope of the DXY and/or the bond yield spread makes the current area sub 1.34 an attractive buy-side proposition.
uc-8.jpg
uc-c.jpg


Important Footnotes
  • Risk model: The fact that financial markets have become so intertwined and dynamic makes it essential to stay constantly in tune with market conditions and adapt to new environments. This prop model will assist you to gauge the context that you are trading so that you can significantly reduce the downside risks. To understand the principles applied in the assessment of this model, refer to the tutorial How to Unpack Risk Sentiment Profiles
  • Cycles: Markets evolve in cycles followed by a period of distribution and/or accumulation. The weekly cycles are highlighted in red, blue refers to the daily, while the black lines represent the hourly cycles. To understand the principles applied in the assessment of cycles, refer to the tutorial How To Read Market Structures In Forex
  • POC: It refers to the point of control. It represents the areas of most interest by trading volume and should act as walls of bids/offers that may result in price reversals. The volume profile analysis tracks trading activity over a specified time period at specified price levels. The study reveals the constant evolution of the market auction process. If you wish to find out more about the importance of the POC, refer to the tutorial How to Read Volume Profile Structures
  • Tick Volume: Price updates activity provides great insights into the actual buy or sell-side commitment to be engaged into a specific directional movement. Studies validate that price updates (tick volume) are highly correlated to actual traded volume, with the correlation being very high, when looking at hourly data. If you wish to find out more about the importance tick volume, refer to the tutorial on Why Is Tick Volume Important To Monitor?
  • Horizontal Support/Resistance: Unlike levels of dynamic support or resistance or more subjective measurements such as fibonacci retracements, pivot points, trendlines, or other forms of reactive areas, the horizontal lines of support and resistance are universal concepts used by the majority of market participants. It, therefore, makes the areas the most widely followed and relevant to monitor. The Ultimate Guide To Identify Areas Of High Interest In Any Market
  • Trendlines: Besides the horizontal lines, trendlines are helpful as a visual representation of the trend. The trendlines are drawn respecting a series of rules that determine the validation of a new cycle being created. Therefore, these trendline drawn in the chart hinge to a certain interpretation of market structures.
  • Correlations: Each forex pair has a series of highly correlated assets to assess valuations. This type of study is called inter-market analysis and it involves scoping out anomalies in the ever-evolving global interconnectivity between equities, bonds, currencies, and commodities. If you would like to understand more about this concept, refer to the tutorial How Divergence In Correlated Assets Can Help You Add An Edge.
  • Fundamentals: It’s important to highlight that the daily market outlook provided in this report is subject to the impact of the fundamental news. Any unexpected news may cause the price to behave erratically in the short term.
  • Projection Targets: The usefulness of the 100% projection resides in the symmetry and harmonic relationships of market cycles. By drawing a 100% projection, you can anticipate the area in the chart where some type of pause and potential reversals in price is likely to occur, due to 1. The side in control of the cycle takes profits 2. Counter-trend positions are added by contrarian players 3. These are price points where limit orders are set by market-makers. You can find out more by reading the tutorial on The Magical 100% Fibonacci Projection
 
Find my latest market thoughts

The Never-Ending Brexit Quandary


Date: 3/13/19


The Daily Edge is authored by Ivan Delgado, Market Insights Commentator at Global Prime. The purpose of this content is to provide an assessment of the market conditions. The report takes an in-depth look of market dynamics, factoring in fundamentals, technicals, inter-market in order to determine daily biases and assist one’s decisions on a regular basis. Feel free to follow Ivan on Twitter & Youtube.

Quick Take

The currency that stands out above any other is the Kiwi with the pricing out of rate cuts since the last RBNZ policy meeting having set out the currency for a distinctive short-term trend at a time when the rest of Central Banks have been sounding unambiguously more bearish. The rest of the currency fluctuations make for a more complicated jigsaw to solve, as the USD and the JPY still enjoy macro bullish trends due to the spells of risk aversion from last week, although this week’s abrupt reversal towards appetite to seek out riskier bets has sunk the currencies as the 2nd chart shows. But no currency shows more variable and irregular gyrations than the GBP, taken hostage by the never-ending Brexit quandary. The Canadian Dollar starts to show signs of life again, with the onset of its solid performance originated off last Friday’s back-to-back blockbuster Canadian jobs report. The Aussie has also been faring quite well despite the recent blow in yet another Australian data (consumer confidence). In short, continue to pay much more attention to the developing micro trends to increase the odds of being on the right side of the flows. This is not a time to take much guidance from the macro-developing trends as the irregularity of the risk swings coupled with the absence of central bank policy divergences create an environment where flows remain king vs macro positions.

meter-2.jpg


Key Narratives in Financial Markets
  • The Brexit vote on the revised May-Juncker deal was rejected in the UK parliament, with the next focal point a vote on Wed about blocking a ‘no deal’ Brexit and Thursday’s vote on ‘Article 50 extension’. These outcomes are still conditioned to the EU’s position (an absolute mess!)
  • Australia’s NAB and Westpac surveys, paired with the latest finance approvals, raises the odds of the RBA eventually cutting the benchmark rates. The pricing is for 2 cuts so far in the next 12 months, with the Aussie still not reflecting such pessimism in its pricing.
  • The US inflation data came a tad softer than expected despite the market has definitely 'moved on' as the price action demonstrates and no longer pays close attention to the rather benign CPI readings (the era of deflationary pressures goes on). CPIs are not a driver for markets at this stage.
  • US trade representative Lighthizer said to be looking for a ‘sweet spot’ to remove Canada and Mexico tariffs while protecting the US industry.
  • US trade representative Lighthizer notes critical stage in the US-China trade talks, and that a solution to current outstanding issues must be addressed if a deal is to be inked between the US President Trump and Chinese President Xi.
  • Saudi Arabia has proposed to extend Oil output cuts until year end according to Tass and Interfax. The news has been well telegraphed in recent weeks and should be interpreted as almost fully priced in by the market, even if residual demand for Oil still observed.
Recent Economic Indicators & Events Ahead

ice_screenshot_20190313-095307.jpeg
ice_screenshot_20190313-095322.jpeg


Source: Forexfactory

RORO - Risk On Risk Off Conditions

wHT35Cb1fjAOnNuIANxhnU5af1a6Zu3LKcgjC5rT5nLND3-gGwtN8P2iiPK0gc-St-nFx_3Ure9SPf73pDctqtKL5lW1_XRxWPnNsBcrXZscfRIBijLqH4YzfOtBgcYhxEl6pFy7
roro-9.jpg


From a risk perspective, the soothing of fears in equities continues as the marginal gains in the S&P 500 after a midday rebound demonstrate. The 0.4% gains in the benchmark index add to the vigorous rise from Tuesday, which has resulted in both the micro and macro slopes to turn bullish. A completely different picture can be observed in the fixed income market, where if we take the US 30Y bond yield as the barometer to take the pulse of the dynamics in global yields, the trend is firmly bearish, with fresh lows printed as the US30Y breaks (marginally) the 3% level amid the seemingly global coordinated pattern of new easing measures considered by G10 Central Banks. The rapid appreciation in the pricing of US bonds (lower yields) is also weighing on the appeal towards the US Dollar, as the overall micro risk appetite mood seen in stocks underpins the sell-side bias in the DXY. The latest dynamics, therefore, are best described as ‘broad USD weakness’, which makes the direction of the equity market all the more relevant to determine the susceptibility towards risk. However, with the DXY now retesting the ECB-induced demand area amid a compressive price pattern, should the USD regain its mojo, we’d be realigning the macro ‘weak risk off’ environment with that of the micro landscape, which would not be welcoming news for risk amid a clear downtrend in yields. Overall, the dynamics are benign for risk-seeking strategies but pay attention to the next fluctuations of the DXY as they may be key to determine commodity-linked FX and the Yen.

Dashboard: Intermarket Flows & Technical Analysis

mMgw-2lydB-bkMTCl8_QRrde3_bY1DX07hMrqM8k5ofM3RAD_rPtW3pmwgSjT5Gpnx7pT8LHaKx443h4XDtBuk4nygiyTyAB1GC4cUSPGqylX6uSBrEhxI4Iw82Wai5-j-2-5yoj
ice_screenshot_20190313-103948.png


Summary: Intermarket Flows & Technical Analysis
EUR/USD: ECB-Led Liquidity Removal Retested
  • The ascendancy in the exchange rate keeps playing out in line with the spike in the German vs US 10yr bond yield spread, by far the most correlated asset to the pair.
  • The latest bullish market structure on the hourly keeps respecting technicals levels with pristine precision as the backside retest and rejection of the descending trendline shows.
  • The upside should get far stickier as the exchange rate returns to fill offers at an inflection point circa 1.13 psychological level (origin of the ECB selloff catalyst last week).
  • The short-term bullish structure, if one takes as reference Dow theory, will not be compromised until sellers can take out the latest swing low at 1.1250 and find acceptance below.
  • Interestingly, the German vs US 10-yr yield spread trades slightly higher than its pre-ECB level, suggesting that the present levels appears a relatively well adjusted value area.
eu-10.jpg
eu-c-1.jpg

GBP/USD: Barrage Of Vol, Bears Take Control
  • Yesterday’s UK vote was a time to throw micro technical level out of the window as vol picked up. Relatively lower levels of vol today, so expect micro techs off hourly to be more respected.
  • The latest swings worth over 3c. in either direction are a clear testament of the poor liquidity and algo-induced intervention in a market fully driven by a Brexit headline by headline basis.
  • The latest aggressive sell-off, combined with a double rejection off 1.3150 clearly states the bearish intentions of the market amid the defeat of UK May’s Brexit agreement in parliament.
gu-11.jpg
gu-c-1.jpg

USD/JPY: Hostile Intermarket Backdrop To Be Long Commited
  • The micro slopes in the DXY and the US bond yields (US30Y as reference) indicate unfriendly dynamics for further upwards extensions.
  • The macro bullish trend in the DXY paired with bullish equities underpins the downside as demonstrated by the ‘buy on dips’ mentality off the ascending trendline.
  • The move up has been slow in nature, which is indicative of what’s often referred to as corrective order flow. A break of the ascending trendline may see the next bear cycle initiated with impetus justified if the DXY + US30Y bear micro slope can prevail.
  • The recent directional ‘risk off’ or ‘risk off’ movements in our RORO model have led to a significant decoupling of the DXY as a key driver of this market near term.
uj-12.jpg
uj-c-1.jpg

AUD/USD: Negative Aus Data Mounts, Knocks Down Yield Spread
  • The macro bond yield spread correlation runs above 50%, so the renewed sharp drop in Aus yields should lead to more negative capital flow dynamics that may weight in the Aussie.
  • The level of the Aus-US bond yield spread is back down approaching its year-low of -0.75bp, time when the exchange rate touted 0.70c. It now remains considerably higher, which implies a decent sell-side value level if equities or the DXY trends can revert its current course.
  • The micro backdrop is not conducive of follow-through selling as the performance of equities, DXY , Yuan continue to be an impending factor capping the downside.
  • The breakout of an ascending trendline, at the bare minimum, should see the market profile permutate into range-bound conditions following the poor Westpac consumer confidence.
au-11.jpg


USD/CAD: One-Way-Street Bearish Run

  • The 3rd touch of a descending trendline, which coincided with bearish microdynamics in the DXY and Oil inverted leads to a ferocious sell-off in the exchange rate.
  • The pair looks overextended but the close on the daily alongside the deterioration in intermarket studies across the board implies further follow through not to be ruled out.
  • The pair remains driven by the performance of the DXY and the US-CA bond yield spread, with Oil recently not acting as reliably to gauge the directional bias.
  • In favor of the bull case, the macro slope based on the DXY and the one derived off the pair’s pricing remain with a slight upward angle, which may still draw significant macro bids interest.
    uc-9.jpg


Gold: Congruence In Intermarket Flows Leads To 1.3k Breakout
  • The sell-off in the US yields has led to bullish dynamics in both the micro and macro slopes, further asserting the constructive technical view in the precious metal.
  • The fortified position by bulls has been vindicated by the bearish backdrop in the DXY, which continues to suffer from the rise in equities and the lower yield spread advantage vs G10.
  • Watch the level of resistance at 1,305.00 although judging by the latest flows derived off intermarket studies, the level looks fragile to be broken.
  • For those that buy into the thesis of 2019 being a bullish year for Gold, the current levels to engage in buy-side action remain attractive with the developing structure supporting this view.
gold-t.jpg
gold-8.jpg


AUD/JPY: Enters Noisier Spell As Equities/Yields Diverge

  • The opposite directions by the S&P 500 and the long-dated US yields since the last US session have resulted in a period of more erratic gyrations in the exchange rate.
  • The latest sell-off, courtesy of Westpac’s downbeat consumer confidence, sees the exchange rate landing at a critical intersection (3rd touch ascending trendline + horizontal support).
  • Buying on dips far from a clear cut as any setback in equities may see intermarket microflows re-anchored towards the bearish side, with the added caveat that selling interest derived from the latest Aus negative fundamentals may accelerate the move down.
aj-5.jpg


EUR/AUD: Bond Yield Spread Rules Dynamics

  • The importance of monitoring the correlation coefficient can’t be sufficiently overstated as a precursor to understanding what makes a market move. In this one in particular, it’s all about the German vs Australian bond yield spread vs Yuan or equities.
  • The rough patch of fundamentals by both the EU and Australia have resulted in a market confined in a fairly tight range and market participants turning all absolute attention towards any developing yield spread advantage as the ‘leading’ indication to set out the next directions.
  • The upward slope in the German vs Aus bond yield spread from a micro and macro standpoint is a clear signal that any weakness should be potentially perceived as buying opportunities.
  • If bulls are to take more decisive control of technicals, a breakout and hold above the 1.60 round number (currently tested in Asia) is absolutely necessary.
ea-5.jpg
ea-c-1.jpg


Important Footnotes
  • Risk model: The fact that financial markets have become so intertwined and dynamic makes it essential to stay constantly in tune with market conditions and adapt to new environments. This prop model will assist you to gauge the context that you are trading so that you can significantly reduce the downside risks. To understand the principles applied in the assessment of this model, refer to the tutorial How to Unpack Risk Sentiment Profiles
  • Cycles: Markets evolve in cycles followed by a period of distribution and/or accumulation. The weekly cycles are highlighted in red, blue refers to the daily, while the black lines represent the hourly cycles. To understand the principles applied in the assessment of cycles, refer to the tutorial How To Read Market Structures In Forex
  • POC: It refers to the point of control. It represents the areas of most interest by trading volume and should act as walls of bids/offers that may result in price reversals. The volume profile analysis tracks trading activity over a specified time period at specified price levels. The study reveals the constant evolution of the market auction process. If you wish to find out more about the importance of the POC, refer to the tutorial How to Read Volume Profile Structures
  • Tick Volume: Price updates activity provides great insights into the actual buy or sell-side commitment to be engaged into a specific directional movement. Studies validate that price updates (tick volume) are highly correlated to actual traded volume, with the correlation being very high, when looking at hourly data. If you wish to find out more about the importance tick volume, refer to the tutorial on Why Is Tick Volume Important To Monitor?
  • Horizontal Support/Resistance: Unlike levels of dynamic support or resistance or more subjective measurements such as fibonacci retracements, pivot points, trendlines, or other forms of reactive areas, the horizontal lines of support and resistance are universal concepts used by the majority of market participants. It, therefore, makes the areas the most widely followed and relevant to monitor. The Ultimate Guide To Identify Areas Of High Interest In Any Market
  • Trendlines: Besides the horizontal lines, trendlines are helpful as a visual representation of the trend. The trendlines are drawn respecting a series of rules that determine the validation of a new cycle being created. Therefore, these trendline drawn in the chart hinge to a certain interpretation of market structures.
  • Correlations: Each forex pair has a series of highly correlated assets to assess valuations. This type of study is called inter-market analysis and it involves scoping out anomalies in the ever-evolving global interconnectivity between equities, bonds, currencies, and commodities. If you would like to understand more about this concept, refer to the tutorial How Divergence In Correlated Assets Can Help You Add An Edge.
  • Fundamentals: It’s important to highlight that the daily market outlook provided in this report is subject to the impact of the fundamental news. Any unexpected news may cause the price to behave erratically in the short term.
  • Projection Targets: The usefulness of the 100% projection resides in the symmetry and harmonic relationships of market cycles. By drawing a 100% projection, you can anticipate the area in the chart where some type of pause and potential reversals in price is likely to occur, due to 1. The side in control of the cycle takes profits 2. Counter-trend positions are added by contrarian players 3. These are price points where limit orders are set by market-makers. You can find out more by reading the tutorial on The Magical 100% Fibonacci Projection
 
GBP Vol Through The Roof


JPY and USD supply flows were the common denominator as the environment turned ‘true risk on’ once again. Further diversification into riskier assets, including beta currencies, has clearly transpired, as the micro and macro slopes of the SP500 vindicate.

Date: 3/14/19


The Daily Edge is authored by Ivan Delgado, Market Insights Commentator at Global Prime. The purpose of this content is to provide an assessment of the market conditions. The report takes an in-depth look of market dynamics, factoring in fundamentals, technicals, inter-market in order to determine daily biases and assist one’s decisions on a regular basis. Feel free to follow Ivan on Twitter & Youtube.

Quick Take

JPY and USD supply flows were the common denominator as the environment turned ‘true risk on’ once again. Further diversification into riskier assets, including beta currencies, has clearly transpired, as the micro and macro slopes of the SP500 vindicate. Interestingly, global yields, taking the US 30-yr as a reference, while marginally higher, continue to exhibit a rather sluggish behavior. Short-term, the environment remains very positive for risk trades, especially for the Canadian Dollar, as it takes up the slack from a heavier Aussie, weighted by constant negative fundamentals in Australia (Westpac’s consumer confidence the last disappointment). Meanwhile, the dynamics around the Euro have been relatively benign, while the Sterling is flying as the UK secures, in theory, the rejection of a ‘no deal’ Brexit after Wednesday’s vote in the Commons.

auhnIeKCboP36uxSW_RDgyNQvbTGSxpg15oXsjcpirkOLkiydbQNxW3gTblawQiZURTza_d-gVVo1EO3Y-5cpY75kL6GWIK-di4BsqgZ8_iQ6vwFs_wWQjTRxg9MXSVBcXweUKwm
roro-10.jpg


Dashboard: Intermarket Flows & Technical Analysis

X8OkqIRcEOMkE78TwakUdg10LUXDdnzOeJxmujUpVzqs9NmQE6oymswdFB14pqQ2lkNxZfbcQAFuv9vebLVcv43XIyiIU8H1IpDdY6UXiHaB5m67QrhAZUz2AF5JDUwC2WyFwUze
ice_screenshot_20190314-094847.png


Summary: Intermarket Flows & Technical Analysis
EUR/USD: Buy-Side Flows Dominate On Brexit Delay Speculation
  • The Euro follows the bullish directional move in the GBP as the market keeps pricing in the avoidance of a ‘no deal’ to leave the EU, removing temporarily the inherited tail risk of Brexit.
  • The latest upthrust buy-side candle on the hourly guns through a sticky resistance above 1.13 with the supply that came post ECB last week left behind after being absorbed.
  • Technicals and intermarket (German vs US yield spread) continue to be in congruence for an extension to the upside, with the green lines drawn to act as key buy-side zones on retracements.
  • The bullish structure of higher highs and higher lows has allowed up to draw an ascending trendline that serves as a visual representation of the benign buy-side dynamics.
eu-11.jpg


GBP/USD: Huge Volatile Swings The Norm This Week

  • Straight move up in another blockbuster 300 pips + spike as the market perceives as a GBP positive the vote to reject a “no deal” Brexit scenario.
  • The passage of the most recent bills through the UK parliament does not fully eliminate the risk of a so-called “hard Brexit” as the ball is still in the EU’s courtyard to make a final call.
  • Technicals are overextended post the late GBP upthrust which has failed to find acceptance above the 1.3350 but still plenty of demand pockets nearby as the green lines indicate.
  • If you are trading the Pound, it continues to be wise to adjust your normal trade and stop size to accommodate the increasing amount of volatility this week.
gu-12.jpg


USD/JPY: Trapped In A Range As Interest Elsewhere

  • The wax and wane dynamics within a confined 50 pips box remain the norm as none the USD nor the JPY experience enough imbalances as both sold hard on the risk appetite tone.
  • The positive trend in equities acts as a source of demand, but this continues to be counterbalanced by the negative tendencies in the DXY and US yields, hence the range.
  • The majority of technical measures are still negative, while the intermarket flows have turned slightly more constructive as US yields recover as part of the ‘true risk on’ microflows.
  • Amid the lack of clear catalysts, other than a Brexit shocker with broad-based ripple effects, it looks like engaging in buy/sell side activity at the edges for rotations is a sensible strategy.
uj-13.jpg
uj-c-2.jpg


AUD/USD: ‘Risk On’ Outweighs Aus Bond Yield Debacle

  • The ‘true risk on’ flows has led to a resurgence of the interest to hold Aussie longs in a move that may appear counterintuitive based on the AU-US bond yield spread fall but…
  • ...It makes perfect sense as the ‘true risk on’ flows lead to a lower DXY, higher Yuan, spike in equities, which results in AUD positive flows absorbing diminished appeal towards AU yields.
  • The latest swing has created a higher high structure which seems to be falling way short in magnitude compared to the previous buy-side flows originating from March 8th low.
  • With the Aus-US bond yield spread so depressed, any hiccup in the ‘risk on’ environment that leads to a DXY recovery exposes a fragile Aussie to significant supply imbalances.
au-12.jpg
au-c-2.jpg


USD/CAD: Perfect Bearish Storm Sinks The Rate

  • An even more pronounced downward angle can be observed by connecting the latest two peaks, a testament of the strong sell-side activity in the exchange rate.
  • The combination of ‘true risk on’ coupled with strong gains in the Oil prices has encouraged sell-side flows, while rumors of tariff removal by the US to Canada also assists.
  • Unless scalping the market, I see limited risk-reward to play this market short until at least a correction towards the 3rd touch of the most recent trendline at play.
  • As usual, wait for the price to come up to decision areas to then assess the market conditions and whether or not there is an edge to be found via intermarket analysis.
  • As intermarket studies stand, this market has written all over the wall to still sell on strength judging by the alignment of micro/macro slopes in Oil, DXY, yield spreads.
uc-10.jpg
uc-c-2.jpg


Additional Charts
Gold Resumes Its Bullish Trend As Intermarket Flows Align

gold-9.jpg
gold-c-1.jpg


AUD/JPY: Finds Decent Demand As 'True Risk On' Re-Ignited

aj-6.jpg
aj-c-2.jpg


EUR/AUD: Recovery In German vs Aus Yield Spread Leads The Way

ea-6.jpg
ea-c-2.jpg


NZD/USD: Uptrend In Place, Setback Finds Buyers

NU-6.jpg
nz-c.jpg


IMPORTANT FOOTNOTES
  • Risk model: The fact that financial markets have become so intertwined and dynamic makes it essential to stay constantly in tune with market conditions and adapt to new environments. This prop model will assist you to gauge the context that you are trading so that you can significantly reduce the downside risks. To understand the principles applied in the assessment of this model, refer to the tutorial How to Unpack Risk Sentiment Profiles
  • Cycles: Markets evolve in cycles followed by a period of distribution and/or accumulation. The weekly cycles are highlighted in red, blue refers to the daily, while the black lines represent the hourly cycles. To understand the principles applied in the assessment of cycles, refer to the tutorial How To Read Market Structures In Forex
  • POC: It refers to the point of control. It represents the areas of most interest by trading volume and should act as walls of bids/offers that may result in price reversals. The volume profile analysis tracks trading activity over a specified time period at specified price levels. The study reveals the constant evolution of the market auction process. If you wish to find out more about the importance of the POC, refer to the tutorial How to Read Volume Profile Structures
  • Tick Volume: Price updates activity provides great insights into the actual buy or sell-side commitment to be engaged into a specific directional movement. Studies validate that price updates (tick volume) are highly correlated to actual traded volume, with the correlation being very high, when looking at hourly data. If you wish to find out more about the importance tick volume, refer to the tutorial on Why Is Tick Volume Important To Monitor?
  • Horizontal Support/Resistance: Unlike levels of dynamic support or resistance or more subjective measurements such as fibonacci retracements, pivot points, trendlines, or other forms of reactive areas, the horizontal lines of support and resistance are universal concepts used by the majority of market participants. It, therefore, makes the areas the most widely followed and relevant to monitor. The Ultimate Guide To Identify Areas Of High Interest In Any Market
  • Trendlines: Besides the horizontal lines, trendlines are helpful as a visual representation of the trend. The trendlines are drawn respecting a series of rules that determine the validation of a new cycle being created. Therefore, these trendline drawn in the chart hinge to a certain interpretation of market structures.
  • Correlations: Each forex pair has a series of highly correlated assets to assess valuations. This type of study is called inter-market analysis and it involves scoping out anomalies in the ever-evolving global interconnectivity between equities, bonds, currencies, and commodities. If you would like to understand more about this concept, refer to the tutorial How Divergence In Correlated Assets Can Help You Add An Edge.
  • Fundamentals: It’s important to highlight that the daily market outlook provided in this report is subject to the impact of the fundamental news. Any unexpected news may cause the price to behave erratically in the short term.
  • Projection Targets: The usefulness of the 100% projection resides in the symmetry and harmonic relationships of market cycles. By drawing a 100% projection, you can anticipate the area in the chart where some type of pause and potential reversals in price is likely to occur, due to 1. The side in control of the cycle takes profits 2. Counter-trend positions are added by contrarian players 3. These are price points where limit orders are set by market-makers. You can find out more by reading the tutorial on The Magical 100% Fibonacci Projection
 
Find my latest market thoughts

Brexit Is All That Matters


Brexit, Brexit and more Brexit. This week, the dynamics in the currency markets were almost exclusively dominated by the topsy-turvy state of affairs in the Brexit front.

Date: 3/15/19

The Daily Edge is authored by Ivan Delgado, Market Insights Commentator at Global Prime. The purpose of this content is to provide an assessment of the market conditions. The report takes an in-depth look of market dynamics, factoring in fundamentals, technicals, inter-market in order to determine daily biases and assist one’s decisions on a regular basis. Feel free to follow Ivan on Twitter & Youtube.

Quick Take

Brexit, Brexit and more Brexit. This week, the dynamics in the currency markets were almost exclusively dominated by the topsy-turvy state of affairs in the Brexit front. After all said and done, the market has found sufficient consolation in the anticipation of a delayed Brexit, which is seen in the market’s playbook as a temporary GBP positive as it removes an immediate tail risk. The ball seems to be moving to the EU courtyard, which means that the European Council meeting next week (21/22 March) should be the platform where an extension is agreed, in theory. As a pre-condition, the UK needs all 27 member states to agree to the delay.

In the USD and JPY markets, sellers have swayed the price dynamics as the delayed Brexit scenario firmed up the notion of 'risk-seeking' strategies. Running their own races, the Kiwi and the Canadian Dollar were off to a great start of the week, but only the latter has been able to sustain enough momentum to preserve most of its weekly progress. The Kiwi, as a stronger by-product version of the Aussie, has faltered as US President Trump warned us that there is no rush for the US and China to ink a deal just yet, just as more reports seem to suggest that any meeting between Trump and Xi won’t happen until April, at least. Amid the crossfire of GBP vol, the Euro has found enough buying interest for the market to apparently interpret that the fair value in the exchange rate vs the US Dollar should be back to the pre ECB selloff-led episode.

Dashboard: Intermarket Flows & Technical Analysis

X8OkqIRcEOMkE78TwakUdg10LUXDdnzOeJxmujUpVzqs9NmQE6oymswdFB14pqQ2lkNxZfbcQAFuv9vebLVcv43XIyiIU8H1IpDdY6UXiHaB5m67QrhAZUz2AF5JDUwC2WyFwUze
ice_screenshot_20190315-082942.png


Summary: Intermarket Flows & Technical Analysis

EUR/USD: Breaks Ascending Trendline, Risk Of Range Establishment
  • First time since the bottom found post the ECB dovish meeting that the market structure is starting to be disrupted, with the violation of the ascending trendline a red flag.
  • Judging by the slope of the German vs US bond yield spread, both micro and macro, pockets of significant demand should still be found at key decision points (green lines).
  • The European shared currency has been at the mercy of the UK Brexit developments this week, mostly piggybacking the overall direction in the Sterling market.
  • The multiple rejections off the 1.1335-40 vicinity occur on the back of the 100% proj target as the extension of the latest market’s successful rotation from 1.1277 thru 1.1305.
  • Thursday’s setback found sufficient demand interest at the intersection of Wednesday’s PoC (Point of Control), that is, where the highest concentration of volume occurred.
eu-12.jpg
eu-t.jpg

GBP/USD: Balanced Flows Despite Another Brexit Bill Passes
  • The muted buy-side activity in the Sterling even as the article 50 extension bill won enough endorsement in the UK parliament seems to be a reflection of enough good news priced in.
  • Most of the volume concentration (PoC) fell right around the middle of the daily range, suggesting that playing the edge of the range for potential rotations is a scenario to consider.
  • The intermarket studies (DXY + bond yield spread) remain unambiguously bullish, supporting the notion of buying on weakness at relevant decision points.
  • The key levels where clusters of demand may be found come at roughly 1.1310-1.13, followed by the 3rd touch of an uptrend line and ahead of Wednesday’s POC at 1.1345-50.
  • The overall structure of HH & HL coupled with constructive order flow as per the impulsive demand observed vs corrective setback (more 2-way business) supports the bullish bias too.
gu-13.jpg
gu-c-3.jpg


USD/JPY: Demand Emerges As DXY, US30Y Regain Footing
  • The impulsive-type breakout through 111.50 sets a new intraday target for the bulls between 111.90 and the round number of 112.00, where selling should ensue.
  • The reasoning why any runaway bullish move is likely to be met by grateful sellers is predicated on the basis that both DXY & US yield exhibit bearish weekly trends.
  • The close of the exchange rate above its PoC indicates that any further pullbacks should find decently strong pockets of demand at the test of key levels.
  • The latest buy-side action comes amid a return of the positive dynamics comprised of a higher DXY and US yields, a precursor that is always going to attract solid buying interest.
  • The breakout of 111.50 has ignited new momentum with buyers now in need to keep control of this week’s volume cluster circa 111.20-30 to maintain the bullish structure.
uj-14.jpg
uj-c-3.jpg

AUD/USD: Bullish Structure Violated, Sell-Side Bias Preferred
  • The take-out of the previous swing low has disrupted the positive hourly structure on the Aussie while also breaking through the uptrend line.
  • The latest supply imbalanced has inflicted sufficient technical damage to worsen the outlook and now expect a more trappy range-bound scenario.
  • The micro intermarket backdrop has turned bearish as flows emanating from the currency market, equities and capital flows (bond yield spread) suggest.
  • Even from a macro perspective, the bearish structures in the DXY + Yuan (both inverted) alongside the Aus-US bond yield spread should counterbalance positive macro flows in equities and keep the Aussie on the backfoot.
  • Since the short-term outlook has reverted to the bearish side, the clearest area to engage in sell-side action can be found on a retest of the broken trendline ahead of 7090-7100 area.
au-13.jpg
au-c-3.jpg


USD/CAD: Descending Trendline Breakout, Back To Bullish Dynamics

  • After the overstretched bearish run, a flurry of buy-side activity has transpired amid the recovery in intermarket flows as the bullish run in the DXY and bond yield spreads indicate.
  • The price has found an area of supply imbalance at 1.3350 (origin Feb 13 sell-off), with price fizzling out into a period of balanced flows right underneath.
  • The intermarket outlook provides conflicting signals. From a daily view, buy-side strategies are justified, but technicals and weekly intermarket flows paint a gloomier picture.
  • Look to avoid trading through the noisy periods such as the one the exchange rate finds itself now and instead engage in decision points (1.3350 to the upside, 1.33-3310 to the downside).
uc-11.jpg
uc-c-3.jpg


Important Footnotes
  • Risk model: The fact that financial markets have become so intertwined and dynamic makes it essential to stay constantly in tune with market conditions and adapt to new environments. This prop model will assist you to gauge the context that you are trading so that you can significantly reduce the downside risks. To understand the principles applied in the assessment of this model, refer to the tutorial How to Unpack Risk Sentiment Profiles
  • Cycles: Markets evolve in cycles followed by a period of distribution and/or accumulation. The weekly cycles are highlighted in red, blue refers to the daily, while the black lines represent the hourly cycles. To understand the principles applied in the assessment of cycles, refer to the tutorial How To Read Market Structures In Forex
  • POC: It refers to the point of control. It represents the areas of most interest by trading volume and should act as walls of bids/offers that may result in price reversals. The volume profile analysis tracks trading activity over a specified time period at specified price levels. The study reveals the constant evolution of the market auction process. If you wish to find out more about the importance of the POC, refer to the tutorial How to Read Volume Profile Structures
  • Tick Volume: Price updates activity provides great insights into the actual buy or sell-side commitment to be engaged into a specific directional movement. Studies validate that price updates (tick volume) are highly correlated to actual traded volume, with the correlation being very high, when looking at hourly data. If you wish to find out more about the importance tick volume, refer to the tutorial on Why Is Tick Volume Important To Monitor?
  • Horizontal Support/Resistance: Unlike levels of dynamic support or resistance or more subjective measurements such as fibonacci retracements, pivot points, trendlines, or other forms of reactive areas, the horizontal lines of support and resistance are universal concepts used by the majority of market participants. It, therefore, makes the areas the most widely followed and relevant to monitor. The Ultimate Guide To Identify Areas Of High Interest In Any Market
  • Trendlines: Besides the horizontal lines, trendlines are helpful as a visual representation of the trend. The trendlines are drawn respecting a series of rules that determine the validation of a new cycle being created. Therefore, these trendline drawn in the chart hinge to a certain interpretation of market structures.
  • Correlations: Each forex pair has a series of highly correlated assets to assess valuations. This type of study is called inter-market analysis and it involves scoping out anomalies in the ever-evolving global interconnectivity between equities, bonds, currencies, and commodities. If you would like to understand more about this concept, refer to the tutorial How Divergence In Correlated Assets Can Help You Add An Edge.
  • Fundamentals: It’s important to highlight that the daily market outlook provided in this report is subject to the impact of the fundamental news. Any unexpected news may cause the price to behave erratically in the short term.
  • Projection Targets: The usefulness of the 100% projection resides in the symmetry and harmonic relationships of market cycles. By drawing a 100% projection, you can anticipate the area in the chart where some type of pause and potential reversals in price is likely to occur, due to 1. The side in control of the cycle takes profits 2. Counter-trend positions are added by contrarian players 3. These are price points where limit orders are set by market-makers. You can find out more by reading the tutorial on The Magical 100% Fibonacci Projection
 
Find my latest market thoughts

Brace For A Busy Vol Week


The USD, JPY, and the CAD have been the main laggards in the last 24h. On the flip side, the GBP, AUD, NZD keep attracting solid bids, leading to demand imbalances even if the environment remains extremely dicey ahead of crucial pending developments such as Brexit or the US-China trade negotiations.

Date: 3/18/19

The Daily Edge is authored by Ivan Delgado, Market Insights Commentator at Global Prime. The purpose of this content is to provide an assessment of the market conditions. The report takes an in-depth look of market dynamics, factoring in fundamentals, technicals, inter-market in order to determine daily biases and assist one’s decisions on a regular basis. Feel free to follow Ivan on Twitter & Youtube.

Currency Strength Meter

The USD, JPY, and the CAD have been the main laggards in the last 24h. On the flip side, the GBP, AUD, NZD keep attracting solid bids, leading to demand imbalances even if the environment remains extremely dicey ahead of crucial pending developments such as Brexit or the US-China trade negotiations. The Euro is sandwiched in the middle, with the currency largely conditioned to Brexit developments and Wed's FOMC to find its next catalyst in either direction.

meter-3.jpg


Key Narratives in Financial Markets
  • UK PM May fails to gather enough support from the DUP over the weekend. If she can get the DUP on board, the chances of the Brexit divorce bill going through parliament would increase. Only 3 days left before Thursday’s crucial EU Summit on Brexit, where an extension of Article 50 is highly likely amid the lack of alternatives.

  • Mixed US economic reports last Friday. When it comes to industrial production, it barely grew at 0.1% for the month of February, while the NY Fed’s Manuf index also imploded with a 3.7 print vs 10.1 expected. Capacity utilization also came on the soft side at 78.2% vs 78.5% exp. On a brighter note, the prelim UoM consumer sentiment stood at 97.8 vs 95.5, with the JOLTS jobs opening coming also stronger at 7.50M vs 7.27M as the labor market remains strong.

  • Traders should buckle up for increased volatility from mid this week, as not only we get Thursday’s Brexit Summit amid the dicey situation but Wednesday’s FOMC meeting is also expected to bring about a decent dose of volatility as the focus shifts towards slower growth in the US and globally, alongside clues that reinforce the renewed neutral to dovish stance.

  • On the US-China trade negotiations, a topic that has been put on the backburner of traders’ minds as the headlines activity decreases at a time when Brexit takes absolute centerstage, further reports suggested that much more progress must be done before a potential “signing ceremony” between both US and China’s Presidents, not expected before mid-April.

  • We are back to the inflammatory language from North Korea towards the US, as the leader of the latter refers to the US as taking a ‘gangster-like’ approach. The immediate thoughts crossing traders’ minds should be that any denuclearization, for now, is dead in the water.
Recent Economic Indicators & Events Ahead

cal1-1.jpeg
cal2-2.jpeg
ice_screenshot_20190318-082530.png


Source: Forexfactory

RORO - Risk On Risk Off Conditions

wHT35Cb1fjAOnNuIANxhnU5af1a6Zu3LKcgjC5rT5nLND3-gGwtN8P2iiPK0gc-St-nFx_3Ure9SPf73pDctqtKL5lW1_XRxWPnNsBcrXZscfRIBijLqH4YzfOtBgcYhxEl6pFy7
roro-11.jpg


From a micro perspective, which is really what matters amind the dicey state of affairs in Brexit and with Central Banks meeting this week, we are faced with a ‘USD weakness’ environment in a context of rising equities, which keeps promoting the ‘risk on’ environment. Even if we should not place as much weight given the unpredictability of the events unfolding this week, the macro backdrop, comprised of the weekly trends, is also reflective of weak USD dynamics amid rising equities.

As our model explains, “when the usd and us30 yr bond yield both move lower, clues must be obtained via the sp500 and potentially gold to determine risk. If the sp500 moves lower, the risk environment remains not friendly overall. However, under this context, the usd weakness, indirectly, eases pressure on EMs and may keep the likes of the aussie or kiwi underpinned vs euro, gbp, cad, barring fundamental news affecting the flows in the oceanic currencies.”

Dashboard: Intermarket Flows & Technical Analysis

mMgw-2lydB-bkMTCl8_QRrde3_bY1DX07hMrqM8k5ofM3RAD_rPtW3pmwgSjT5Gpnx7pT8LHaKx443h4XDtBuk4nygiyTyAB1GC4cUSPGqylX6uSBrEhxI4Iw82Wai5-j-2-5yoj
ice_screenshot_20190318-065435.png


Summary: Intermarket Flows & Technical Analysis

EUR/USD: Range-Bound Conditions Awaiting Brexit News
  • The Euro is set to piggyback the Sterling this week, as the Brexit plot thickens. Whatever volatility and directions emerge in the GBP, it should be replicated in smaller scale in the EUR.
  • A rather confined 40 pip range to contend with at the start of the week, so involvement at the extremes of the trading range is best suited to aim for max risk reward prospects.
  • As the German vs US bond yield spread stands, with micro and macro slopes pointing up, the path of least resistance should continue to be to the upside from a value perspective.
eu.jpeg
eu-c-1.jpeg


GBP/USD: Brace For Another Week Of Brexit-Led Vol

  • The barrage of inconclusive Brexit headlines has been translated into a very choppy price action in the last 2 days, as algos and traders await for the next catalyst.
  • Sporadic episodes of vol here and there, as seen last week, are expected ahead of the major Brexit Summit on Thursday, when vol will continue to be on the rise.
  • Market structure, technicals and fundamentals continue to be all in alignment for a resumption of the bullish trend, as the table above indicates through the assignment of arrows.
  • It’s especially notable the bullish stepping formation in the UK-US bond yield spread, which has served as a key leading indicator. The micro/macro bearish trend in the DXY only reinforces that any GBP positive news can see a move magnified given the overall USD fragility.
gu.jpeg


USD/JPY: Constructive Bullish Structure But Intermarket Bearish

  • Technicals saw a marked improvement last week, after the key breakout through 111.40 led to a new bullish cycle which stopped on its tracks at the 100% proj target.
  • As intermarket stands, with the DXY and US 30Y showing a downward trajectory, the market is unlikely to gather much buy-side support, even if deep dip buying still justified on rampant equities. Until the FOMC, a rotational market looks increasingly likely.
  • A cluster of bids can be clearly anticipated between 111.30-40, a confluence of horizontal support with the highest accumulation of volume from last week.
uj-3.jpeg
uj-c-1.jpeg


AUD/USD: Applying Pressure Against 71 cents

  • The Aussie keeps finding buyers and with good reason as intermarket has turned clearly bullish, not only from a micro standpoint but also from a macro (weekly) tendency basis.
  • The RBA minutes on Tuesday and the Australian jobs report on Thursday are the key events to inject volatility into the Aussie this week. Throw the FOMC in the US into the mix. Vol eyed.
  • Other than the market structure, which is more range-bound in nature, the rest of technicals and intermarket indicator, suggest finding cheap prices to buy at discount.
  • The clearest area to engage in buy-side opportunities at this stage is found at 0.7050, the midpoint of the range circa 0.7070 or alternatively a break and retest of 0.71.
au.jpeg
au-c-1.jpeg


USD/CAD: Established A Range, Mixed Intermarket

  • Despite general USD weakness, flows towards the Loonie have been even more depressed, allowing the exchange rate to create an hourly bullish structure…
  • However, given the tepid extension above the previous swing high at 1.3345, the market runs the clear risk of establishing in a 1.3290-1.3350 range.
  • There is a significant number of hurdles on the way up as reflected by the multiple horizontal levels of resistance created on the way down as the macro trend remains clearly down.
uc.jpeg
uc-c-1.jpeg


Gold: All Indications Point to Higher Prices

  • By taking a look at today’s outlook table, one of the markets best positioned to exploit the USD weakness is Gold, especially if equities find greater selling pressure.
  • Even with rising equities, the combination of bearish trends in the DXY alongside short-dated US yields, is enough to still perceive value by engaging in buy-side opportunities at key levels.
  • Talking of key levels, keep monitoring the horizontal lines drawn in the chart below, as each and every interaction has represented a key decision point with the usual spring effect.
  • The close of business in NY at the highest of the day, coupled with the overall structure bullish ever since the bottom found at 1,280k strengthens the case to stay constructive.
gold.jpeg
gold-c.jpeg


Important Footnotes
  • Risk model: The fact that financial markets have become so intertwined and dynamic makes it essential to stay constantly in tune with market conditions and adapt to new environments. This prop model will assist you to gauge the context that you are trading so that you can significantly reduce the downside risks. To understand the principles applied in the assessment of this model, refer to the tutorial How to Unpack Risk Sentiment Profiles
  • Cycles: Markets evolve in cycles followed by a period of distribution and/or accumulation. The weekly cycles are highlighted in red, blue refers to the daily, while the black lines represent the hourly cycles. To understand the principles applied in the assessment of cycles, refer to the tutorial How To Read Market Structures In Forex
  • POC: It refers to the point of control. It represents the areas of most interest by trading volume and should act as walls of bids/offers that may result in price reversals. The volume profile analysis tracks trading activity over a specified time period at specified price levels. The study reveals the constant evolution of the market auction process. If you wish to find out more about the importance of the POC, refer to the tutorial How to Read Volume Profile Structures
  • Tick Volume: Price updates activity provides great insights into the actual buy or sell-side commitment to be engaged into a specific directional movement. Studies validate that price updates (tick volume) are highly correlated to actual traded volume, with the correlation being very high, when looking at hourly data. If you wish to find out more about the importance tick volume, refer to the tutorial on Why Is Tick Volume Important To Monitor?
  • Horizontal Support/Resistance: Unlike levels of dynamic support or resistance or more subjective measurements such as fibonacci retracements, pivot points, trendlines, or other forms of reactive areas, the horizontal lines of support and resistance are universal concepts used by the majority of market participants. It, therefore, makes the areas the most widely followed and relevant to monitor. The Ultimate Guide To Identify Areas Of High Interest In Any Market
  • Trendlines: Besides the horizontal lines, trendlines are helpful as a visual representation of the trend. The trendlines are drawn respecting a series of rules that determine the validation of a new cycle being created. Therefore, these trendline drawn in the chart hinge to a certain interpretation of market structures.
  • Correlations: Each forex pair has a series of highly correlated assets to assess valuations. This type of study is called inter-market analysis and it involves scoping out anomalies in the ever-evolving global interconnectivity between equities, bonds, currencies, and commodities. If you would like to understand more about this concept, refer to the tutorial How Divergence In Correlated Assets Can Help You Add An Edge.
  • Fundamentals: It’s important to highlight that the daily market outlook provided in this report is subject to the impact of the fundamental news. Any unexpected news may cause the price to behave erratically in the short term.
  • Projection Targets: The usefulness of the 100% projection resides in the symmetry and harmonic relationships of market cycles. By drawing a 100% projection, you can anticipate the area in the chart where some type of pause and potential reversals in price is likely to occur, due to 1. The side in control of the cycle takes profits 2. Counter-trend positions are added by contrarian players 3. These are price points where limit orders are set by market-makers. You can find out more by reading the tutorial on The Magical 100% Fibonacci Projection
 
Find my latest market thoughts

Limited Flows Ahead Of Brexit, FOMC


The Aussie and to a lesser extent the New Zealand Dollar, were the best performers, followed closely by the Euro. It was a bit of a disjointed affair, as even the JPY performed relatively well against its peers despite the persistent rise in equities, taking the S&P 500 as our barometer (up 0.6%).

Date: 3/19/19

The Daily Edge is authored by Ivan Delgado, Market Insights Commentator at Global Prime. The purpose of this content is to provide an assessment of the market conditions. The report takes an in-depth look of market dynamics, factoring in fundamentals, technicals, inter-market in order to determine daily biases and assist one’s decisions on a regular basis. Feel free to follow Ivan on Twitter & Youtube.

Quick Take

The Aussie and to a lesser extent the New Zealand Dollar, were the best performers, followed closely by the Euro. It was a bit of a disjointed affair, as even the JPY performed relatively well against its peers despite the persistent rise in equities, taking the S&P 500 as our barometer (up 0.6%). The Sterling succumbed to the lack of progress between the UK government and the DUP to be able to re-table the divorce deal. Meanwhile, the Canadian Dollar remains under clear sell-side pressure amid a substantial deterioration in the Canadian bond yields, now inverted up to 10y. The USD traded mixed for the day awaiting further stimulants.

meter-1.jpeg


Key Narratives in Financial Markets
  • Markets on hold ahead of Brexit developments and the FOMC monetary policy minutes.
  • UK Speaker prevents UK PM May to re-table the same divorce deal that was rejected last week, hence no further meaningful vote can proceed unless changes made.
  • The negotiations to get the DUP on board by adjusting to some of their backstop demands so that an amended divorce deal can have another vote are still ongoing. However, an increasing number of reports suggest May is failing in efforts to yield any substantial results, which will lead to Theresa May not risking a third meaningful vote (not even allowed).
  • UK junior Brexit Minister notes that if EU doesn’t grant an extension to the UK after this month’s Brexit deadline, the country will leave with no deal.
  • Indications of the complicated state of affairs in the ongoing US-China trade deal negotiations keep emerging, as the South China Morning Post reports that a signing ceremony to ink a potential agreement by the US and China President may not take place until June, assuming they do hash out a deal.
Recent Economic Indicators & Events Ahead

cal1-2.jpeg


Source: Forexfactory

RORO - Risk On Risk Off Conditions

wHT35Cb1fjAOnNuIANxhnU5af1a6Zu3LKcgjC5rT5nLND3-gGwtN8P2iiPK0gc-St-nFx_3Ure9SPf73pDctqtKL5lW1_XRxWPnNsBcrXZscfRIBijLqH4YzfOtBgcYhxEl6pFy7
roro-2.jpeg


The rampant mood in equities has continued to build up, taking the S&P 500 into new yearly highs as technicals in what remains a fairly well structured and orderly bullish stepping formation dynamics. The micro and macro slopes are reflective of a market in buy-only mode. When it comes to US yields, the long-dated 30-year is going through a period of very low vol after finding a floor circa 3%, with the low activity leading to the micro and macro slopes turning more flattish ahead of the FOMC. Meanwhile, the DXY appears to have found enough buying interest to potentially setting up a short-term range as it attempts to recovery off 96.40, allowing the micro slope to revert back to neutral terrain. Overall, the current market conditions are still best defined as USD weakness in a context of risk appetite, but be aware that we really are in a holding pattern ahead of vol events later this week.

Dashboard: Intermarket Flows & Technical Analysis

mMgw-2lydB-bkMTCl8_QRrde3_bY1DX07hMrqM8k5ofM3RAD_rPtW3pmwgSjT5Gpnx7pT8LHaKx443h4XDtBuk4nygiyTyAB1GC4cUSPGqylX6uSBrEhxI4Iw82Wai5-j-2-5yoj
ice_screenshot_20190319-093830.png


Summary: Intermarket Flows & Technical Analysis

EUR/USD: Hourly Bullish Cycle In Place
  • Demand imbalance through the European session leads to the formation of a new up-cycle even if the conviction half-hearted judging by the abrupt rejection of 1.1350 resistance.
  • Any pullback should find a cluster of bids touted between 1.1315-25 (Friday’s POC + trendline) ahead of the next critical support at the 1.13 area.
  • The reversal lower in the German vs US bond yield spread does not promote further rises by the end of business in NY as the micro slope fails to keep the upward momentum.
  • The volume profile structure shows a single distribution-type formation with the price closing below Monday’s POC (highest volume accumulation), suggesting a neutral/rotational bias.
eu-1.jpeg
eu-c-2.jpeg


GBP/USD: Trapped In A Range Until New Catalysts

  • For 3 days in a row, GBP has been confined in a relatively tight range between 1.3210 and 1.3330 with market makers dominating the edges amid lack of fresh Brexit news to latch on.
  • Other than the micro slope in the UK vs US bond yield spread, which has turned south, the rest of intermarket indicators (micro/macro DXY + macro yield spread) support the bullish bias.
  • Vol is set to pick up considerably from March 21st when the Brexit Summit gets underway. For the next 24h, as dynamics stand, engaging at the extremes of the range with the synchronicity of intermarket flows in one’s favor looks like the best course of action.
  • The only event, outside Brexit headlines, that should bring some minor injection of vol to the Sterling, is the publication of today’s UK employment report.
gu1.jpeg
gu-c-2.jpeg


USD/JPY: Testing A Key Ascending Trendline

  • Monday’s volume profile structure (P shape) has trapped longs, with the close at the lows of the day set in motion a flurry of offers to test a key level to the downside.
  • … that key level is the third touch of an ascending trendline, which makes the context of the pullback still to occur under a relatively benign price action structure.
  • Unfortunately for the interest of buyers, the intermarket flows are far from supportive due to the bearish slopes in the DXY and US yields (both micro and macro).
  • The rise in equities still provides a respite that should see residual pockets of demand at key levels of support, but most likely to lack the impetus to shift the momentum unless we start to see higher US yields backing the trend in equities for a return of ‘true risk on’.
uj-4.jpeg
uj-c-2.jpeg


AUD/USD: Hourly Bullish Trend Still Underway

  • The upthrust bar breaking the 71 cents market has validated a new up-cycle in the hourly chart, with a movement quite strong in magnitude and velocity as stop got triggered it was reported.
  • The area of support between 0.7090/0.7100 has become the first potential accumulation point for buyers to re-group for a retest of the most recent swing high.
  • If you are looking to engage in long-side action, wait for at least 2 out of 3 correlated instruments to be in alignment. Currently, equities support the uptrend, bond yield spread does not, so the make or break determiner should be the DXY + Yuan indicator.
  • Monday’s volume profile structure resulted in a single distribution with the price closing around the same level as the POC. It still provides credence to be a buyer.
au-1.jpeg
au-c-2.jpeg


USD/CAD: Range-Bound Conditions Amid Lack Of Catalyst

  • Yo-yo type movement in the last 4 days of trading, with a well-defined range between 1.3290 and 1.3370 with most of the volume concentrated at the midpoint of 1.3330-40.
  • The intermarket analysis fails to support the upward bias given the bullish trend in Oil and the bearish momentum seen recently in the DXY. On the flip side, the US-CA bond yield spread does promote higher prices, which may transpire if the DXY can recover its footing.
  • Monday’s volume profile formation shows a single distribution, which is encompassed within a wider range, so all signs are pointing for further rotational dynamics until the FOMC.
uc-1.jpeg
uc-c-2.jpeg


Important Footnotes
  • Risk model: The fact that financial markets have become so intertwined and dynamic makes it essential to stay constantly in tune with market conditions and adapt to new environments. This prop model will assist you to gauge the context that you are trading so that you can significantly reduce the downside risks. To understand the principles applied in the assessment of this model, refer to the tutorial How to Unpack Risk Sentiment Profiles
  • Cycles: Markets evolve in cycles followed by a period of distribution and/or accumulation. The weekly cycles are highlighted in red, blue refers to the daily, while the black lines represent the hourly cycles. To understand the principles applied in the assessment of cycles, refer to the tutorial How To Read Market Structures In Forex
  • POC: It refers to the point of control. It represents the areas of most interest by trading volume and should act as walls of bids/offers that may result in price reversals. The volume profile analysis tracks trading activity over a specified time period at specified price levels. The study reveals the constant evolution of the market auction process. If you wish to find out more about the importance of the POC, refer to the tutorial How to Read Volume Profile Structures
  • Tick Volume: Price updates activity provides great insights into the actual buy or sell-side commitment to be engaged into a specific directional movement. Studies validate that price updates (tick volume) are highly correlated to actual traded volume, with the correlation being very high, when looking at hourly data. If you wish to find out more about the importance tick volume, refer to the tutorial on Why Is Tick Volume Important To Monitor?
  • Horizontal Support/Resistance: Unlike levels of dynamic support or resistance or more subjective measurements such as fibonacci retracements, pivot points, trendlines, or other forms of reactive areas, the horizontal lines of support and resistance are universal concepts used by the majority of market participants. It, therefore, makes the areas the most widely followed and relevant to monitor. The Ultimate Guide To Identify Areas Of High Interest In Any Market
  • Trendlines: Besides the horizontal lines, trendlines are helpful as a visual representation of the trend. The trendlines are drawn respecting a series of rules that determine the validation of a new cycle being created. Therefore, these trendline drawn in the chart hinge to a certain interpretation of market structures.
  • Correlations: Each forex pair has a series of highly correlated assets to assess valuations. This type of study is called inter-market analysis and it involves scoping out anomalies in the ever-evolving global interconnectivity between equities, bonds, currencies, and commodities. If you would like to understand more about this concept, refer to the tutorial How Divergence In Correlated Assets Can Help You Add An Edge.
  • Fundamentals: It’s important to highlight that the daily market outlook provided in this report is subject to the impact of the fundamental news. Any unexpected news may cause the price to behave erratically in the short term.
  • Projection Targets: The usefulness of the 100% projection resides in the symmetry and harmonic relationships of market cycles. By drawing a 100% projection, you can anticipate the area in the chart where some type of pause and potential reversals in price is likely to occur, due to 1. The side in control of the cycle takes profits 2. Counter-trend positions are added by contrarian players 3. These are price points where limit orders are set by market-makers. You can find out more by reading the tutorial on The Magical 100% Fibonacci Projection
 
Back
Top