Global Prime: Daily Market Digest

Find my latest market thoughts

USD Suppressed As Data Keeps Disappointing

POSTED ON: 27 MAY, 2019

The story making the headlines in the currency market is the follow-through weakness in the US Dollar, exacerbated by yet another round of poor US economic data, this time the goods orders series was the culprit behind the sell-off last Friday.


The Daily Edge is authored by Ivan Delgado, Market Insights Commentator at Global Prime. The purpose of this content is to provide an assessment of the market conditions. The report takes an in-depth look of market dynamics, factoring in fundamentals, technicals, inter-market in order to determine daily biases and assist one’s decisions on a regular basis. Feel free to follow Ivan on Twitter & Youtube.

Quick Take

The story making the headlines in the currency market is the follow-through weakness in the US Dollar, exacerbated by yet another round of poor US economic data, this time the goods orders series was the culprit behind the sell-off last Friday. Movements in the Forex market are expected to come to a halt for most of the day with the two financial centers injecting the most currency vol closed due to public holidays this Monday. The rest of the currencies, with the exception of the Sterling, attracted tepid flows. Remember, most of the gains seen in majors is a function of the USD weakness we are seeing across the board vs fundamentally-backed bullish moves outside the USD.

met1-1_190527_015842.jpeg


Narratives In Financial Markets

* The Information is gathered after scanning top publications including the FT, WSJ, Reuters, Bloomberg, ForexLive, Institutional Bank Research reports.

  • US durable goods orders worsened the outlook for the US economy last Friday, adding to the lingering pessimism after Thursday’s US PMI data.
  • US President Trump suggested a trade deal with China is still possible, even if at this stage, the statement is clearly aimed at boosting falling stocks rather than being realistic in nature. Especially when Trump said that even Huawei could be included as part of the deal. Go figure.
  • Trump said that there is a “good possibility that the negotiations with Beijing could get "back on track” and that he is set to meet President Xi at the G20 meeting in Osaka.
  • Meanwhile, in China, the Xinhua news agency says the US demands are an ‘invasion’ on its economic sovereignty, ramping up even further the trade rhetoric.
  • The US commerce department is proposing a rule against countries that undervalue their currencies in order to increase trade competitiveness relative to the USD.
  • UK’s Theresa May announced her resignation as Prime Minister effective on June 10th, pledging to stay in power until a successor takes the batton. All the options are on the table at this stage, from a 2nd Brexit referendum to a general election.
  • The EU election has had a minor impact on the pricing of the Euro or the Sterling even if further fragmentation was confirmed. There was a strong voting for anti-establishment and eurosceptic groups parties such as Nigel Farage’s party or Le Pen’s far right.
  • A very light day on the economic calendar, with public holidays both in the UK and the US.
Recent Economic Indicators & Events Ahead
cal-10_190527_015928.jpeg

cal2-3_190527_015946.jpeg


Source: Forexfactory

RORO (Risk On, Risk Off Conditions)

E3Nz7AKKBak6DsxKfqS618tFvxdtc-EOr3zhWP8yon-RIOQFSCidU1QosKV9CZ_2WfuSH9eb71lV-JrdX1pkugScDndbsIHCyXriw8X16diSGbRCQAQN4CiWf-rgsKNVel4cBaVN


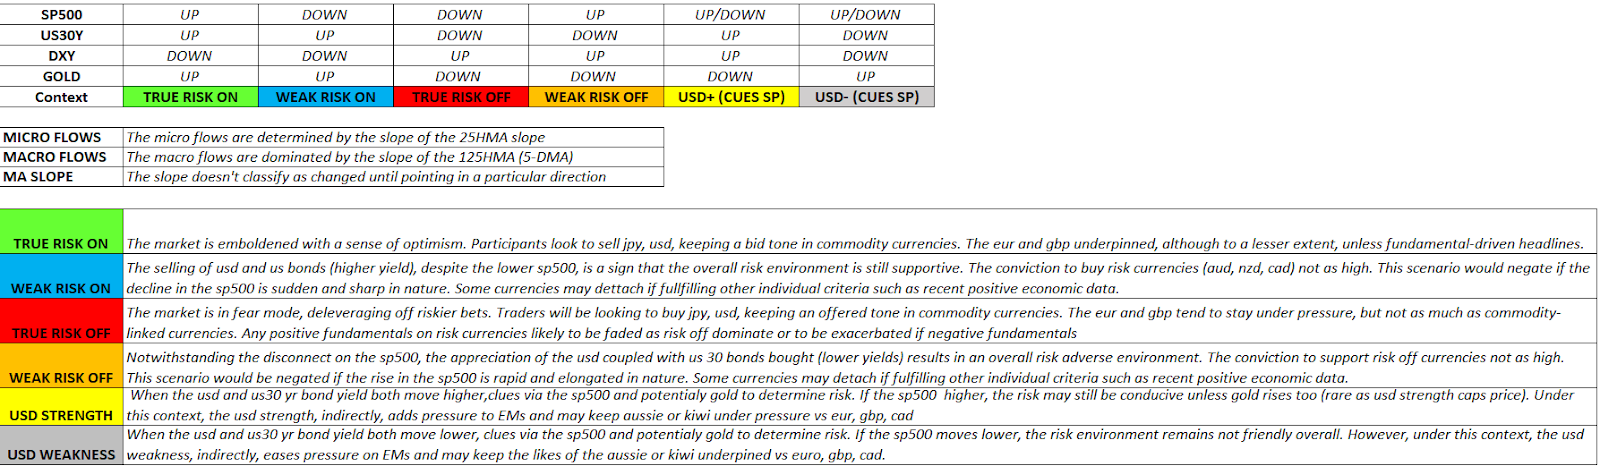
A short-lived spell of buy-side action hit the S&P 500 after Trump tried to talk up equities, which still look quite grim from an hourly structural view as well as judging by the macro trend (125HMA slope). The reversal of the micro trend based on the 25HMA slope is the one consolidation that buyers can lean on to face this week’s trading with a tad more optimism but far from bullish. When it comes to the other heavyweight to evaluate risk dynamics, the US 30y bond yield stays suppressed circa 2.75% as the market discounts a more dire outlook for global growth, with tentative evidence that it is starting to feed through sectors of the US economy after the soft data in manuf & goods orders. Remember, it’s Memorial Day in the US, so no cues will be obtained from stocks, bonds.

In the currency front, the consolidation near trend highs in the Japanese Yen, especially when cross-checked against a sharply bearish trend momentum in the USD, offers 2 takeaways. Firstly, we remain in a highly uncertain period where the deleveraging dynamics remain dominant based on the lofty pricing of the Yen vs G10 FX. Secondly, the major performance disparity between the JPY and the USD indicates that the market is assigning significantly higher chances of a slowdown in the US economy, as reflected by the slide in US yields and the DXY in tandem (USD weakness across the board). Don’t be misled by the retracement in the USD/CNH, as that’s a function of USD fragility vs RMB strength. If you assess the RMB vs G10 FX, flows still communicate no bets on an eventual US-China trade deal.

Overall, even if the desirability of Trump is to see an increase in equity valuations, his attempts are starting to be quite futile to revert the dominant risk-averse mood in the market. Unless there is some genuine progress for the market to latch on, looks like the risk-off dynamics are prevalent.

Latest Key Developments In FX (Technicals, Fundamentals, Intermarket)
EUR/USD: Volume Profile Stays Bullish

eu-13.jpeg


GBP/USD: Acceptance At Highs, Range Resolution Found


gu-13.jpeg


USD/JPY: Sellers Keep Making Further Headway


uj-15.jpeg


AUD/USD: First Upside Target Met, No USD Demand


au-15.jpeg


Important Footnotes

  • Risk model: The fact that financial markets have become so intertwined and dynamic makes it essential to stay constantly in tune with market conditions and adapt to new environments. This prop model will assist you to gauge the context that you are trading so that you can significantly reduce the downside risks. To understand the principles applied in the assessment of this model, refer to the tutorial How to Unpack Risk Sentiment Profiles
  • Cycles: Markets evolve in cycles followed by a period of distribution and/or accumulation. The weekly cycles are highlighted in red, blue refers to the daily, while the black lines represent the hourly cycles. To understand the principles applied in the assessment of cycles, refer to the tutorial How To Read Market Structures In Forex
  • POC: It refers to the point of control. It represents the areas of most interest by trading volume and should act as walls of bids/offers that may result in price reversals. The volume profile analysis tracks trading activity over a specified time period at specified price levels. The study reveals the constant evolution of the market auction process. If you wish to find out more about the importance of the POC, refer to the tutorial How to Read Volume Profile Structures
  • Tick Volume: Price updates activity provides great insights into the actual buy or sell-side commitment to be engaged into a specific directional movement. Studies validate that price updates (tick volume) are highly correlated to actual traded volume, with the correlation being very high, when looking at hourly data. If you wish to find out more about the importance tick volume, refer to the tutorial on Why Is Tick Volume Important To Monitor?
  • Horizontal Support/Resistance: Unlike levels of dynamic support or resistance or more subjective measurements such as fibonacci retracements, pivot points, trendlines, or other forms of reactive areas, the horizontal lines of support and resistance are universal concepts used by the majority of market participants. It, therefore, makes the areas the most widely followed and relevant to monitor. The Ultimate Guide To Identify Areas Of High Interest In Any Market
  • Trendlines: Besides the horizontal lines, trendlines are helpful as a visual representation of the trend. The trendlines are drawn respecting a series of rules that determine the validation of a new cycle being created. Therefore, these trendline drawn in the chart hinge to a certain interpretation of market structures.
  • Correlations: Each forex pair has a series of highly correlated assets to assess valuations. This type of study is called inter-market analysis and it involves scoping out anomalies in the ever-evolving global interconnectivity between equities, bonds, currencies, and commodities. If you would like to understand more about this concept, refer to the tutorial How Divergence In Correlated Assets Can Help You Add An Edge.
  • Fundamentals: It’s important to highlight that the daily market outlook provided in this report is subject to the impact of the fundamental news. Any unexpected news may cause the price to behave erratically in the short term.
  • Projection Targets: The usefulness of the 100% projection resides in the symmetry and harmonic relationships of market cycles. By drawing a 100% projection, you can anticipate the area in the chart where some type of pause and potential reversals in price is likely to occur, due to 1. The side in control of the cycle takes profits 2. Counter-trend positions are added by contrarian players 3. These are price points where limit orders are set by market-makers. You can find out more by reading the tutorial on The Magical 100% Fibonacci Projection
 
Find my latest market thoughts

Liquidity Set To Return After Long Weekend


The Daily Edge is authored by Ivan Delgado, Market Insights Commentator at Global Prime. The purpose of this content is to provide an assessment of the market conditions. The report takes an in-depth look of market dynamics, factoring in fundamentals, technicals, inter-market in order to determine daily biases and assist one’s decisions on a regular basis. Feel free to follow Ivan on Twitter & Youtube.

Quick Take

The market is set to come back to life after the respective holidays in the UK and the US. Currency movements have been quite subdued, with the Sterling and to a lesser extent the Euro, finding minimal extra stimulus on the back of the fragmented election results out of Europe. The risk dynamics remain quite suppressive, an environment that tends to benefit the likes of the Japanese Yen, while flows into the USD remain largely limited as the market comes to terms about the risk of a US economic slowdown on recent poor data.

met-13_190528_020143.jpeg


Narratives In Financial Markets

* The Information is gathered after scanning top publications including the FT, WSJ, Reuters, Bloomberg, ForexLive, Institutional Bank Research reports.
  • Most currencies treaded water due to the dry up of liquidity with both the US and the UK off on public holidays. Normal liquidity set to return today, which should lead to increased ranges.
  • The European Commission is considering to apply disciplinary procedures to Italy should the country breach its debt rules by making tax cuts, a mandate PM Salvini has pledged to respect.
  • The Sterling was the weakest currency on Monday, weighted by the split in the EU votes, which has raised the prospects for conservative leadership candidates to endorse a hard Brexit, while the Labour party is more likely to seek out a cleaner mandate through a 2nd referendum.
  • As Morgan Stanley notes: “Greater EU political fragmentation could mean a more difficult balancing act among the various mainstream groups. But they're set to retain a good majority, despite unconventional parties gaining some seats. The markets are likely to watch the implications for national politics and the process of allocation of top EU jobs.”
  • The selloff in German bunds communicates residual risk-off flows, with the divisive EU election results the culprit. Uncertain consequences for the political landscape, including who will fill the positions as Presidents of the EU Commission, the Eurogroup, and the ECB.
  • The WSJ reports that Iranian Crude buyers have jumped ship, noting that just one month after Trump tightened its ban on Iranian Oil sales, Iran’s direct buyers have all but vanished, according to traders and executives in the Islamic Republic. It seems that China, India, Turkey, South Korea, and Japan, have decided to step away.
  • The economic calendar is light again this Tuesday, with consumer confidence out of the European Union and the United States the only data of some significance for the price to react to.
Recent Economic Indicators & Events Ahead

cal-11_190528_020321.jpeg


Source: Forexfactory

RORO (Risk On, Risk Off Conditions)


E3Nz7AKKBak6DsxKfqS618tFvxdtc-EOr3zhWP8yon-RIOQFSCidU1QosKV9CZ_2WfuSH9eb71lV-JrdX1pkugScDndbsIHCyXriw8X16diSGbRCQAQN4CiWf-rgsKNVel4cBaVN


Risk-averse dynamics have prevailed as we transition away from a slow Monday. The retracement in the S&P 500 after Trump’s attempts to talk up equities on Friday is still very corrective in nature amid a clear bearish context as per momentum and structure metrics. When it comes to the other heavyweight to evaluate risk dynamics, the US 30y bond yield has pushed slightly lower again, and as I reported during yesterday’s report, the latest round of selling pressure on yields comes as “the market discounts a more dire outlook for global growth, with tentative evidence that it is starting to feed through sectors of the US economy after the soft data in manuf & goods orders.”

In the currency front, the high balance area found by the equally-weighted Japanese Yen index is clear communication that the environment is risk unfriendly. As I stated yesterday, there are 2 key takeaway from the elevated Yen levels and the subdued USD valuation since last week. Firstly, we are in a highly uncertain period with deleveraging dynamics dominant as the Yen pricing indicates. Secondly, the major performance disparity between the JPY and the USD indicates that the market is assigning significantly higher chances of a slowdown in the US economy, as reflected by the slide in US yields and the DXY in tandem (USD weakness across the board).

Also, I reiterate not to misread the retracement in the USD/CNH as a sign of RMB strength (higher chances of a trade deal). If you assess the RMB vs G10 FX, flows still communicate no bets on an eventual US-China trade deal.
Overall, with the US-China trade dispute intensifying, Brexit uncertainty peaking, and an EU parliament more fragmented than ever before, the fundamentals are unlikely to underpin risk. Against such backdrop, prevailing risk-off dynamics should continue to be prevalent.

Latest Key Developments In FX (Technicals, Fundamentals, Intermarket)

EUR/USD: Structure Remains Favorable

eu-14.jpeg


GBP/USD: POC Keeps Acting As Bouncing Area

gu-14.jpeg


USD/JPY: Bearish Outlook Stays Intact

uj-16.jpeg


AUD/USD: Bullish Structure Continues Undeterred

au-16.jpeg


Important Footnotes

  • Risk model: The fact that financial markets have become so intertwined and dynamic makes it essential to stay constantly in tune with market conditions and adapt to new environments. This prop model will assist you to gauge the context that you are trading so that you can significantly reduce the downside risks. To understand the principles applied in the assessment of this model, refer to the tutorial How to Unpack Risk Sentiment Profiles
  • Cycles: Markets evolve in cycles followed by a period of distribution and/or accumulation. The weekly cycles are highlighted in red, blue refers to the daily, while the black lines represent the hourly cycles. To understand the principles applied in the assessment of cycles, refer to the tutorial How To Read Market Structures In Forex
  • POC: It refers to the point of control. It represents the areas of most interest by trading volume and should act as walls of bids/offers that may result in price reversals. The volume profile analysis tracks trading activity over a specified time period at specified price levels. The study reveals the constant evolution of the market auction process. If you wish to find out more about the importance of the POC, refer to the tutorial How to Read Volume Profile Structures
  • Tick Volume: Price updates activity provides great insights into the actual buy or sell-side commitment to be engaged in a specific directional movement. Studiesvalidate that price updates (tick volume) are highly correlated to actual traded volume, with the correlation being very high, when looking at hourly data. If you wish to find out more about the importance tick volume, refer to the tutorial on Why Is Tick Volume Important To Monitor?
  • Horizontal Support/Resistance: Unlike levels of dynamic support or resistance or more subjective measurements such as fibonacci retracements, pivot points, trendlines, or other forms of reactive areas, the horizontal lines of support and resistance are universal concepts used by the majority of market participants. It, therefore, makes the areas the most widely followed and relevant to monitor. The Ultimate Guide To Identify Areas Of High Interest In Any Market
  • Trendlines: Besides the horizontal lines, trendlines are helpful as a visual representation of the trend. The trendlines are drawn respecting a series of rules that determine the validation of a new cycle being created. Therefore, these trendline drawn in the chart hinge to a certain interpretation of market structures.
  • Correlations: Each forex pair has a series of highly correlated assets to assess valuations. This type of study is called inter-market analysis and it involves scoping out anomalies in the ever-evolving global interconnectivity between equities, bonds, currencies, and commodities. If you would like to understand more about this concept, refer to the tutorial How Divergence In Correlated Assets Can Help You Add An Edge.
  • Fundamentals: It’s important to highlight that the daily market outlook provided in this report is subject to the impact of the fundamental news. Any unexpected news may cause the price to behave erratically in the short term.
  • Projection Targets: The usefulness of the 100% projection resides in the symmetry and harmonic relationships of market cycles. By drawing a 100% projection, you can anticipate the area in the chart where some type of pause and potential reversals in price is likely to occur, due to 1. The side in control of the cycle takes profits 2. Counter-trend positions are added by contrarian players 3. These are price points where limit orders are set by market-makers. You can find out more by reading the tutorial on The Magical 100% Fibonacci Projection
 
Find my latest market thoughts

Safe Haven Bids Keep The Yen In Demand


Safe-haven bids into the allure of the Japanese Yen and fixed income markets are the name of the game as the markets gradually come to the realization that the global economy is about to enter a period of subpar growth as the US and China drag on the trade strifes.

The Daily Edge is authored by Ivan Delgado, Market Insights Commentator at Global Prime. The purpose of this content is to provide an assessment of the market conditions. The report takes an in-depth look of market dynamics, factoring in fundamentals, technicals, inter-market in order to determine daily biases and assist one’s decisions on a regular basis. Feel free to follow Ivan on Twitter & Youtube.

Quick Take

Safe-haven bids into the allure of the Japanese Yen and fixed income markets are the name of the game as the markets gradually come to the realization that the global economy is about to enter a period of subpar growth as the US and China drag on the trade strifes. The behavior of risk-sensitive assets is finally revealing that the market is buying into the notion of a protracted trade war with no end in sight, and as such, leveraged-seeking strategies are on deleverage mode. The USD received a better bid tone as US consumer confidence held firm, while the Aussie also found significant interest even as Aussie yields in the 10y maturity fall below the official cash rate of 1.5%, which communicates the market is overly confident that the RBA will cut its benchmark rate in June. The Canadian Dollar has been the most unloved currency as the market prepares to adjust the currency valuation based on today's BoC policy meeting. Lastly, the Euro has traded on a softer note as the fragmented EU parliamentary election results feed through and Italy makes headlines once again for the wrong reasons. The Pound is finding a better footing so far as traders await the transition away from PM May at the helm of the UK government starting next week, a period where GBP vol will be subject to which candidate is ahead on the bookies.

met-14_190529_024724.jpeg


Narratives In Financial Markets

* The Information is gathered after scanning top publications including the FT, WSJ, Reuters, Bloomberg, ForexLive, Institutional Bank Research reports.
  • The risk-averse dynamics have taken a decisive turn south, as US equities go through a late day sell-off while US bonds see further buying right throughout the day. A reflection of the negative outlook towards the US economy is the further inversion of the 3m/10y yield curve.
  • The market appears to finally come to terms on pricing in a protracted trade war between the US and China. Talks are set to extend for months, if not quarters. A complete collapse in negotiations no longer a scenario to be ruled out either if recent rhetoric serves as an indication.
  • The rude health in the US labor market is yet again being reflected via the US consumer confidence data, which came significantly higher at 134.1 vs 130.1 exp. It lent some support to the US Dollar, as of late moving more in tune with the latest fundamental cues.
  • The Dallas Fed manufacturing PMI fell to -5.3 vs 5.8 exp. The latest announcement to increase tariffs on Chinese goods imports is the main culprit behind the worsening of conditions. What this reading entails is the build-up of downside risks for next Tuesday’s US manufacturing ISM print.
  • The Canadian government is preparing to present the bill in order to ratify the new NAFTA agreement, a mere formality in Canada but one that may face difficulties to pass the Democrat-controlled House in the US. Stay tuned to headlines as it may impact the CAD.
  • EU Commission President Juncker was quoted, via the BBC, that there is no room for further negotiations in the Brexit withdrawal agreement. Remember, with Theresa May on her way out, the race for the successor of UK Prime Minister is due to start on June 10th.
  • According to a report by Bloomberg, German Chancellor Angela Merkel is planning to stay in power until at least 2021 amid disagreements and lack of conviction in the succession plan.
Recent Economic Indicators & Events Ahead

cal-12_190529_024758.jpeg


Source: Forexfactory

RORO (Risk On, Risk Off Conditions)

E3Nz7AKKBak6DsxKfqS618tFvxdtc-EOr3zhWP8yon-RIOQFSCidU1QosKV9CZ_2WfuSH9eb71lV-JrdX1pkugScDndbsIHCyXriw8X16diSGbRCQAQN4CiWf-rgsKNVel4cBaVN


The deleveraging scene keeps on worsening, with the music we can hear in the trade negotiations far from soothing the nerves from a market that is increasingly in disbelief of a trade deal any time soon. In other words, it looks as though the market is behaving as if the US and China have gone past the point of no return, and as such, Mr. Market is unwinding with asperity risky bets. Instead, flows are heading back into the safety allure of bonds as equities take a hit. The S&P 500, as our global guidance to take the lead in equities, has been hammered again after an impulsive sell-off, while the technical picture in US yields is the darkest it’s been as the US30y loses the 2.7% handle. Note, the market’s exasperation can also be reflected in the further inversion of the 3m/10y yield, a clear warning sign that the market is pricing in a severe slowdown domestically. The resurrection of the DXY, alongside another episode of runaway strength in the Yen index, tops the risk off dynamics. By expanding the view into the wider spectrum of the RORO model, we can clearly observe a grim outlook maintained in Chinese assets as well as the VIX and junk bonds.

ro-6.jpeg


Latest Key Developments In FX (Technicals, Fundamentals, Intermarket)

EUR/USD: Sellers Achieve Break of Hourly Structure

eu1-6.jpeg


GBP/USD: Enters A Range As Selling Vol Pressure Builds Up

gu-15.jpeg


AUD/USD: Consolidation With Trappy Edges Eyed

au-17.jpeg


USD/JPY: Risk-Off Environment Keeps Downside Risks Intact

uj-17.jpeg


Important Footnotes
  • Risk model: The fact that financial markets have become so intertwined and dynamic makes it essential to stay constantly in tune with market conditions and adapt to new environments. This prop model will assist you to gauge the context that you are trading so that you can significantly reduce the downside risks. To understand the principles applied in the assessment of this model, refer to the tutorial How to Unpack Risk Sentiment Profiles
  • Cycles: Markets evolve in cycles followed by a period of distribution and/or accumulation. The weekly cycles are highlighted in red, blue refers to the daily, while the black lines represent the hourly cycles. To understand the principles applied in the assessment of cycles, refer to the tutorial How To Read Market Structures In Forex
  • POC: It refers to the point of control. It represents the areas of most interest by trading volume and should act as walls of bids/offers that may result in price reversals. The volume profile analysis tracks trading activity over a specified time period at specified price levels. The study reveals the constant evolution of the market auction process. If you wish to find out more about the importance of the POC, refer to the tutorial How to Read Volume Profile Structures
  • Tick Volume: Price updates activity provides great insights into the actual buy or sell-side commitment to be engaged into a specific directional movement. Studies validate that price updates (tick volume) are highly correlated to actual traded volume, with the correlation being very high, when looking at hourly data. If you wish to find out more about the importance tick volume, refer to the tutorial on Why Is Tick Volume Important To Monitor?
  • Horizontal Support/Resistance: Unlike levels of dynamic support or resistance or more subjective measurements such as fibonacci retracements, pivot points, trendlines, or other forms of reactive areas, the horizontal lines of support and resistance are universal concepts used by the majority of market participants. It, therefore, makes the areas the most widely followed and relevant to monitor. The Ultimate Guide To Identify Areas Of High Interest In Any Market
  • Trendlines: Besides the horizontal lines, trendlines are helpful as a visual representation of the trend. The trendlines are drawn respecting a series of rules that determine the validation of a new cycle being created. Therefore, these trendline drawn in the chart hinge to a certain interpretation of market structures.
  • Correlations: Each forex pair has a series of highly correlated assets to assess valuations. This type of study is called inter-market analysis and it involves scoping out anomalies in the ever-evolving global interconnectivity between equities, bonds, currencies, and commodities. If you would like to understand more about this concept, refer to the tutorial How Divergence In Correlated Assets Can Help You Add An Edge.
  • Fundamentals: It’s important to highlight that the daily market outlook provided in this report is subject to the impact of the fundamental news. Any unexpected news may cause the price to behave erratically in the short term.
  • Projection Targets: The usefulness of the 100% projection resides in the symmetry and harmonic relationships of market cycles. By drawing a 100% projection, you can anticipate the area in the chart where some type of pause and potential reversals in price is likely to occur, due to 1. The side in control of the cycle takes profits 2. Counter-trend positions are added by contrarian players 3. These are price points where limit orders are set by market-makers. You can find out more by reading the tutorial on The Magical 100% Fibonacci Projection
 
Find my latest market thoughts

USD Demand On The Rise, Risk Off Prevails


The ebbs and flows in the forex arena have resulted in the Japanese Yen taking a step back late in the day, while the US Dollar makes another one forward.

The Daily Edge is authored by Ivan Delgado, Market Insights Commentator at Global Prime. The purpose of this content is to provide an assessment of the market conditions. The report takes an in-depth look of market dynamics, factoring in fundamentals, technicals, inter-market in order to determine daily biases and assist one’s decisions on a regular basis. Feel free to follow Ivan on Twitter & Youtube.

Quick Take

The ebbs and flows in the forex arena have resulted in the Japanese Yen taking a step back late in the day, while the US Dollar makes another one forward. A poor bid to cover in a 7y auction in US bonds managed to mitigate the prevailing risk-off flows, as it implies the bearish momentum in bond yields may be exhausting. Let's not forget, fixed income has been on the driving seat commanding what's ultimately permuted into broader risk-off dynamics as global growth expectations are dramatically readjusted amid the hostility in trade relationships between the US and China. The more risk assets sell, the more convinced the market is of a protracted trade war, that's the bottom line. The Aussie has been holding surprisingly steady even as the 10y Aus bond yield inverts against the official cash rate, implying next week's RBA rate cut is baked in the cake. Surprisingly, the Kiwi has detached from the valuation of the Aussie as the market turns more dovish on the RBNZ after an underwhelming BNZ business outlook report. Shifting gears to North America, I'd characterize the movements in the Canadian Dollar as 'uneventful' as the BOC kept the 'status quo', clearly aiming to sound non-committal as the US-China trade situation definitely justifies to stay cautious until further clarity. Lastly, the European currencies kept trading weak on the back of the EU election results.

met-15_190529_235451.jpeg


Narratives In Financial Markets

* The Information is gathered after scanning top publications including the FT, WSJ, Reuters, Bloomberg, ForexLive, Institutional Bank Research reports.
  • Risk off flows continue unabated as the antagonized state in US-China trade relationships goes from bad to worse. The inaction from either side to abandon hard-line stances is feeding through the markets as the exasperation and realization of a protracted trade war settles in.
  • It’s worth noting that Wednesday’s US treasury auction on $32b of 7-year notes was quite poor in terms of the bid to cover, which essentially translates in potential exhaustion of the prolonged rally in fixed income markets as valuations look quite stretched.
  • The latest evidence that China is ready to strike back to the US trade hostility is a series of reports by reputable Chinese sources that suggest China mulls the possibility of cutting the supply of rare earth minerals to the US, with officials noting “don’t say we didn’t warn you.”
  • The risk-off rally has favored the US Dollar, recovering most of its last week’s sharp losses as the pendulum continues to swing between negatives inputs on recent US fundamentals and positive flows as risk off warrants a bid in its safe-haven appeal.
  • The market keeps pricing in a rate cut by the Federal Reserve, currently standing around 80% for the lowering of interest rates by September this year, with over 40bp of cuts priced in by year-end. These expectations imply the market envisions a slowdown in the US economy, as negative repercussions of prolonged trade strife with China are expected.
  • Even more aggressive has been the pricing of rate cuts seen in Australia. If we take the 10y Australian government bond yield as the guidance, it implies a fully priced (100%) cut in rates next week. The 10y maturity has essentially inverted to the cash rate (1.48% vs 1.5%).
  • The BoC keeps its ‘status quo’ in its policy decision by stating that the current rate of 1.75% is appropriate while projecting a rather benign outlook for growth heading into H2 ‘19 on the basis that economic data does not warrant to hold an equally pessimistic stance as compared to late 2018, early 2019. Nonetheless, the Central Bank recognized that the uncertainty surrounds the US-China tensions is likely to have negative ripple effects if persisting.
  • US Special Counsel Mueller said that his investigation over the Russian muddling in the US election and the ties with the Trump campaign did not exonerate the US President in any capacity. Mueller also announced his official resignation and formally closed the office.
  • The European Commission, according to Radiocor, has notified the Italian government that unless there is a credible justification to the intended adjustments in Italy’s debt to GDP, with the deadline this Friday, disciplinary measures (fine) may soon take effect. The EC vs Italy tense saga may cause further downside pressure in EUR supply flows.
Recent Economic Indicators & Events Ahead

cal-13_190529_235601.jpeg
cal2-4_190529_235601.jpeg


Source: Forexfactory

RORO (Risk On, Risk Off Conditions)

E3Nz7AKKBak6DsxKfqS618tFvxdtc-EOr3zhWP8yon-RIOQFSCidU1QosKV9CZ_2WfuSH9eb71lV-JrdX1pkugScDndbsIHCyXriw8X16diSGbRCQAQN4CiWf-rgsKNVel4cBaVN


The hostile backdrop in trade relationships between the US and China no longer defies logic with markets behaving in congruence with the heightened risks of a global slowdown. The persistent selling in the S&P 500, where waves of impulsive selling are counterbalanced with tepid upside corrections, allows us a clear conclusion, that is, an aggressive re-pricing of the growth outlook, with the US no longer immune as the Fed’s favorite 3m/10y yield curve inversion reflects. Take a look at the chart below, which clearly depicts the sync bearish mode in yield curves across major economies.

yc.jpeg


While the trend should be your friend after some ruthless selling for over 2 weeks in US yields, the poor bid to cover in Wednesday’s 7y US bond auction has led to a relief rally in yields across all maturities, which as I stated above, it may be an indication that the market may be reaching levels of exhaustion. This is important to monitor because a transition into more balanced flows in yields has a direct impact in how currencies the likes of the Japanese Yen or the US Dollar may trade. But make no mistake, the structures in the Yen index, the DXY, which has put up a great fight in the last 3 days, alongside the valuations in Chinese assets, as well as VIX and junk bonds, all communicates the same message. We are in clear ‘true risk off’ environment likely to keep rallies in risk assets limited.

ro-7.jpeg


Latest Key Developments In FX (Technicals, Fundamentals, Intermarket)

EUR/USD: Back-to-Back Bearish Double Distributions
eu-15.jpeg


GBP/USD: POC Keeps Bears In Control, 100% Target Met
GU-16.jpeg


AUD/USD: Breaks Range W/ Value But No Volume
au-18.jpeg


USD/JPY: Structure Shifted to Bullish, Volume Not Supportive
uj-18.jpeg


Important Footnotes
  • Risk model: The fact that financial markets have become so intertwined and dynamic makes it essential to stay constantly in tune with market conditions and adapt to new environments. This prop model will assist you to gauge the context that you are trading so that you can significantly reduce the downside risks. To understand the principles applied in the assessment of this model, refer to the tutorial How to Unpack Risk Sentiment Profiles
  • Cycles: Markets evolve in cycles followed by a period of distribution and/or accumulation. The weekly cycles are highlighted in red, blue refers to the daily, while the black lines represent the hourly cycles. To understand the principles applied in the assessment of cycles, refer to the tutorial How To Read Market Structures In Forex
  • POC: It refers to the point of control. It represents the areas of most interest by trading volume and should act as walls of bids/offers that may result in price reversals. The volume profile analysis tracks trading activity over a specified time period at specified price levels. The study reveals the constant evolution of the market auction process. If you wish to find out more about the importance of the POC, refer to the tutorial How to Read Volume Profile Structures
  • Tick Volume: Price updates activity provides great insights into the actual buy or sell-side commitment to be engaged into a specific directional movement. Studies validate that price updates (tick volume) are highly correlated to actual traded volume, with the correlation being very high, when looking at hourly data. If you wish to find out more about the importance tick volume, refer to the tutorial on Why Is Tick Volume Important To Monitor?
  • Horizontal Support/Resistance: Unlike levels of dynamic support or resistance or more subjective measurements such as fibonacci retracements, pivot points, trendlines, or other forms of reactive areas, the horizontal lines of support and resistance are universal concepts used by the majority of market participants. It, therefore, makes the areas the most widely followed and relevant to monitor. The Ultimate Guide To Identify Areas Of High Interest In Any Market
  • Trendlines: Besides the horizontal lines, trendlines are helpful as a visual representation of the trend. The trendlines are drawn respecting a series of rules that determine the validation of a new cycle being created. Therefore, these trendline drawn in the chart hinge to a certain interpretation of market structures.
  • Correlations: Each forex pair has a series of highly correlated assets to assess valuations. This type of study is called inter-market analysis and it involves scoping out anomalies in the ever-evolving global interconnectivity between equities, bonds, currencies, and commodities. If you would like to understand more about this concept, refer to the tutorial How Divergence In Correlated Assets Can Help You Add An Edge.
  • Fundamentals: It’s important to highlight that the daily market outlook provided in this report is subject to the impact of the fundamental news. Any unexpected news may cause the price to behave erratically in the short term.
  • Projection Targets: The usefulness of the 100% projection resides in the symmetry and harmonic relationships of market cycles. By drawing a 100% projection, you can anticipate the area in the chart where some type of pause and potential reversals in price is likely to occur, due to 1. The side in control of the cycle takes profits 2. Counter-trend positions are added by contrarian players 3. These are price points where limit orders are set by market-makers. You can find out more by reading the tutorial on The Magical 100% Fibonacci Projection
 
Find my latest market thoughts

Fed Laying The Ground For A Cut?


The main take away from the last 24h, even if sadly not translated on a pick up in currency volatility, is the notion that the Fed may be preparing the market for a potential shift in policy. That's the only sensible conclusion if one listens to what Fed's Vice Chair Clarida, the most important voice at the helm of the Fed after Chair Powell, had to say.

The Daily Edge is authored by Ivan Delgado, Market Insights Commentator at Global Prime. The purpose of this content is to provide an assessment of the market conditions. The report takes an in-depth look of market dynamics, factoring in fundamentals, technicals, inter-market in order to determine daily biases and assist one’s decisions on a regular basis. Feel free to follow Ivan on Twitter & Youtube.

Quick Take

The main take away from the last 24h, even if sadly not translated on a pick up in currency volatility, is the notion that the Fed may be preparing the market for a potential shift in policy. That's the only sensible conclusion if one listens to what Fed's Vice Chair Clarida, the most important voice at the helm of the Fed after Chair Powell, had to say. The policymaker opened the door for the Fed turning more accommodative if certain pre-conditions are met, which on its own, is a strong statement of intentions. The fixed income market was again a sea of healthy buy-side volatility (lower yields), translated in the recovery of the Yen from the lowest levels it's traded this week. The USD, surprisingly, was rather unperturbed by the dovish remarks from Clarida, and with month-end FX hedge rebalancing skewed towards moderate to strong USD buying due to the underperformance in US equities as the trade war escalates, the price action in the EUR/USD is already acting as a precursor of the combatant stance by the DXY into Friday. Interestingly, even as Crude Oil keeps selling off, the Canadian Dollar has followed in locksteps the USD as the currency managed to navigate quite successfully the BOC test after the Central Bank sounded quite neutral, which by default should be interpreted as rather positive in a world of dovish Central Banks. Along these lines, the next one set to bite the bullet, especially after the latest Capex reading, is the RBA, an outcome the market has fully priced. The Aussie is still putting in a fight. With regards to the European currencies, the Euro enjoyed firmer pockets of demand, while the Sterling is still on selling mode as Germany mulls a veto on extending the Brexit process beyond October.

met-16_190530_230729.jpeg


Narratives In Financial Markets

* The Information is gathered after scanning top publications including the FT, WSJ, Reuters, Bloomberg, ForexLive, Institutional Bank Research reports.
  • There is no denying that the psyche of the market has transitioned into a glass half empty when it comes to the outlook for growth, both in the US and globally. That’s what the resumption in the US yields downtrend predicates, as well as a market in disbelief about the ability of the Fed to keep its policy neutral (cuts expected).
  • Federal Reserve Vice Chairman Richard Clarida made a statement in line with the market pricing (anticipation) of heightened risks of a more dovish Federal Reserve. The policymaker seems to have opened the door to a rate cut by stating “downside risk could call for more accommodative policy”, outlining the marked retreat in the global growth outlook.
  • The month-end FX hedge rebalancing model from banks such as Barclays (LON:BARC) or Citi favor moderate to strong USD buying due to the significant underperformance in US equities.
  • Germany vows not to flex its muscle by allowing another extension in the Brexit process beyond October this year unless major progress made, according to the Telegraph. Not a time-sensitive piece of information at this stage but something to factor in.
  • News by Bloomberg that China is reportedly putting US soy purchases on hold is yet another piece of evidence that vindicates the unstoppable escalation in trade tensions.
  • Defiant words from China’s commerce ministry once again, noting that China will fight till the end if the US keeps threatening the sovereign pride of China.
  • Vice President Mike Pence sends a bold statement to China, implying that if the US sees no end to the conundrum in trade talks, it could ‘more than double; tariffs if needed. Pence left up in the air whether or not Trump will meet Xi at the G20 summit in Osaka (Japan) in June.
  • A less than expected draw in US crude oil inventories (-282k vs -1,360k) sends the price of Oil further down, which combined with the headwind risks of a decrease in demand as the global economy slows down, keeps sellers firmly in control in line with falling yields.
  • US April pending home sales fell by 1.5% vs +0.5% exp, which has some analysts scratching their heads as the backdrop of a firm job market and low rates is conducive for a pickup. Meanwhile, US Q1 GDP (2nd reading) came a tad improved at +3.1% vs 3% exp, even if business investment continues to be one of the weakening components.
  • The significant revision down in the core PCE deflator in the US by 0.3% from 1.3% to 1% reinforced the conviction to sell yields as it implies higher risks of low inflation.
  • Bank of Canada senior deputy governor Wilkins, threw mixed comments, on one hand stating that solid growth in jobs/wages must be reconciled with weak consumer spending, adding that clouds over trade disputes could clear, which would be an upside risk to Canadian and global economies. On the latter, a big ‘IF’ at this stage.
  • Australia's Capex spending slid by -1.7%Q in Q1 vs expectations of a jump with most sectors softening, which adds to the case for the RBA to cut rates next week. Spending intentions for FY19 and FY20 were barely changed suggesting a slow down in growth. The Economics Team at Morgan Stanley (NYSE:MS) notes that "including this into our tracker for Q1 GDP next week suggests another weak print (0.3%Q)."
  • Today's China manufacturing PMI will set the tone for the risk environment in Asia. China economic data has been on a downtrend in Q2 after an encouraging pickup in Q1. The most recent UBS data shows that "the economy continued to decelerate further in May, as our indicators for industrial production, consumption sales ex-autos, property sales, and auto sales look worse than April."
Recent Economic Indicators & Events Ahead

cal-14_190530_230829.jpeg
cal2-5_190530_230828.jpeg


Source: Forexfactory

RORO (Risk On, Risk Off Conditions)

E3Nz7AKKBak6DsxKfqS618tFvxdtc-EOr3zhWP8yon-RIOQFSCidU1QosKV9CZ_2WfuSH9eb71lV-JrdX1pkugScDndbsIHCyXriw8X16diSGbRCQAQN4CiWf-rgsKNVel4cBaVN


Lingering dark clouds for the global growth outlook is the resounding and unambiguous message sent by the hammering of US yields, further intensified by Fed’s Vice Chair Clarida. By stating “downside risk could call for more accommodative policy”, I personally consider IT to be a rather bold ‘off-the-cuff’ hint that the Fed may indeed start preparing the market for a rate cut down the road. The immediate response by market forces has been to depress even further the US yields as larger pools of capital flock off to fixed income as the option of last resort to get paid amid expectations of lower rates. In the equity market, with the S&P 500 our global guidance to take the pulse in sentiment, a shallow bounce has allowed the 25-HMA, which serves as our micro trend cue, to turn mildly positive.

When it comes to crosscurrents in the currency market, the DXY is largely unchanged, benefited by the bearish trend in the Euro since the fragmented European parliamentary election results, while the Yen keeps the firm bullish structure intact. As every day, we also can look at the Chinese assets’ performance to decipher the mood of investors around the trade standoff between the US and China. Price action still suggests pessimism prevails as the USD/CNH consolidations around 6.93, a level that manages to offset the 10% tariffs via a cheaper Yuan exchange rate, while the Shanghai Composite trade within a range at year lows. Lastly, with a VIX (implied vol in the S&P 500) finding a firm footing at elevated levels around the 17.00 mark, and with junk bonds in the US on a clear downtrend, the risk outlook remains as poor as it’s been this week.

ro-8.jpeg


Latest Key Developments In FX (Technicals, Fundamentals, Intermarket)

EUR/USD: Balanced Flows In Line With Bearish Context

eu-16.jpeg


GBP/USD: Sell Strength If Vol Profile As Indication

gu-17.jpeg


AUD/USD: FakeOut At The Edges As Single Distributions Persist
au-19.jpeg


USD/JPY: Dubious Uptrend As Volume + Value Unsupportive

uj-19.jpeg


Important Footnotes
  • Risk model: The fact that financial markets have become so intertwined and dynamic makes it essential to stay constantly in tune with market conditions and adapt to new environments. This prop model will assist you to gauge the context that you are trading so that you can significantly reduce the downside risks. To understand the principles applied in the assessment of this model, refer to the tutorial How to Unpack Risk Sentiment Profiles
  • Cycles: Markets evolve in cycles followed by a period of distribution and/or accumulation. The weekly cycles are highlighted in red, blue refers to the daily, while the black lines represent the hourly cycles. To understand the principles applied in the assessment of cycles, refer to the tutorial How To Read Market Structures In Forex
  • POC: It refers to the point of control. It represents the areas of most interest by trading volume and should act as walls of bids/offers that may result in price reversals. The volume profile analysis tracks trading activity over a specified time period at specified price levels. The study reveals the constant evolution of the market auction process. If you wish to find out more about the importance of the POC, refer to the tutorial How to Read Volume Profile Structures
  • Tick Volume: Price updates activity provides great insights into the actual buy or sell-side commitment to be engaged into a specific directional movement. Studies validate that price updates (tick volume) are highly correlated to actual traded volume, with the correlation being very high, when looking at hourly data. If you wish to find out more about the importance tick volume, refer to the tutorial on Why Is Tick Volume Important To Monitor?
  • Horizontal Support/Resistance: Unlike levels of dynamic support or resistance or more subjective measurements such as fibonacci retracements, pivot points, trendlines, or other forms of reactive areas, the horizontal lines of support and resistance are universal concepts used by the majority of market participants. It, therefore, makes the areas the most widely followed and relevant to monitor. The Ultimate Guide To Identify Areas Of High Interest In Any Market
  • Trendlines: Besides the horizontal lines, trendlines are helpful as a visual representation of the trend. The trendlines are drawn respecting a series of rules that determine the validation of a new cycle being created. Therefore, these trendline drawn in the chart hinge to a certain interpretation of market structures.
  • Correlations: Each forex pair has a series of highly correlated assets to assess valuations. This type of study is called inter-market analysis and it involves scoping out anomalies in the ever-evolving global interconnectivity between equities, bonds, currencies, and commodities. If you would like to understand more about this concept, refer to the tutorial How Divergence In Correlated Assets Can Help You Add An Edge.
  • Fundamentals: It’s important to highlight that the daily market outlook provided in this report is subject to the impact of the fundamental news. Any unexpected news may cause the price to behave erratically in the short term.
  • Projection Targets: The usefulness of the 100% projection resides in the symmetry and harmonic relationships of market cycles. By drawing a 100% projection, you can anticipate the area in the chart where some type of pause and potential reversals in price is likely to occur, due to 1. The side in control of the cycle takes profits 2. Counter-trend positions are added by contrarian players 3. These are price points where limit orders are set by market-makers. You can find out more by reading the tutorial on The Magical 100% Fibonacci Projection
 
True Risk Off As Trump Flexes Muscle On Mexico
Posted on: 02 Jun, 2019

Mr. Market made one of the most commanding moves in this month-long risk aversion chapter we are so deeply entrenched into by sending the Yen sky high in response by yet again more retaliatory soundbites by US President Trump, this time announcing that Mexico is next up to be taxed on all imports.

The Daily Edge is authored by Ivan Delgado, Market Insights Commentator at Global Prime. The purpose of this content is to provide an assessment of the market conditions. The report takes an in-depth look of market dynamics, factoring in fundamentals, technicals, inter-market in order to determine daily biases and assist one’s decisions on a regular basis. Feel free to follow Ivan on Twitter & Youtube.

Quick Take

Mr. Market made one of the most commanding moves as part of the month-long risk aversion chapter we are so deeply entrenched into by sending the Yen sky high in response by yet again more retaliatory soundbites by US President Trump, this time announcing that Mexico is next up to be taxed on all imports. In a matter of days, with both sides scheduled to meet this Wednesday for talks, we will find out if Trump is bluffing or he really means it, as you never know what to expect. Nonetheless, the latest Mexican developments acted as the nail in the coffin in the terrible performance in risk-sensitive assets such as the S&P 500 or US yields during May, the latter signaling the Fed should start to seriously consider accommodative policies as we head into H2, a scenario Fed Vice Chair Clarida gently hinted on last week. But leaving Mexico aside, the dominant driving factor continues to be the escalating US-China trade tension, with the latter making its posture even more explicit after the publication of a White Paper, essentially telling the US that they are ready to have a long fight if necessary. A game of chicken with no end in sight. After all said and done, the crosscurrents in the currency market saw the USD hit the hardest in the G10 space (aside from MXN and CNH), while the CAD also suffered equally harsh selling pressure on mounting negative inputs (GDP, Oil ...). The Euro showed a combatant stance as did the AUD, with both currencies facing its respective Central Bank policy meetings this week. The AUD will garner most of the attention as the RBA is set to finally end its long-held thoughtful wait by announcing its first rate cut in years while the ECB is set to stay cautiously sidelined on new measures.

12_190602_211749.jpg

Narratives In Financial Markets


* The Information is gathered after scanning top publications including the FT, WSJ, Reuters, Bloomberg, ForexLive, Institutional Bank Research reports.

  • The bond yield market rout carries on as Trump announces escalating tariffs on Mexico due to immigration at the border, leading to a major wave of risk-off flows into the Yen and Franc. Trump said it's time for $100 billion trade deficit with Mexico to end, hence why he’s planning to impose a 5% tariff on all imported goods from Mexico beginning June 10, even threatening to “gradually increase” it until the flow of undocumented immigrants at the border stopped.
  • Mexican President said the chance of no deal on border dispute a remote possibility, noting that Mexican and US officials are scheduled to meet on Wednesday. Nonetheless, Trump keeps playing with fire on the game of tariffs, which may sooner or later backfire by creating real long-lasting trade wars until a transition in the US government occurs.
  • As Bloomberg reports, China’s government says it’s willing to work with the US to end an escalating trade war but blames President Trump’s administration for the collapse in talks and won’t be pressured into concessions, according to a white paper published on Sunday.
  • US VP Pence is scheduled to give a controversial speech about China’s religious freedoms and human rights by mid-June, in commemoration of the 30th anniversary of Tiananmen Square, which could easily fuel further discontent by China’s ruling communist party.
  • The retaliatory tit for tat stance between the US and China after the Huawei ban keeps on going as it’s now the turn of the latter to announce they are planning to set up an 'unreliable entities' list to combat foreign firms that cut supplies and act against China’s best interest. Besides, China has prepared its plan to limit rare earth exports to the US, as needed.
  • The decision by Trump on Mexico, if it doesn’t turn out to be a bluff, is a worrisome message for any other nation, including China, that aims to engage in negotiations in good with the US. In other words, the measures against Mexico may lead China to further distrust the US intentions, therefore making the slim chances of a deal in the G20 even more minuscule.
  • Judging by the dramatic fall in US yields, the Fed is no longer in a position where it can shrug off the prospects of lower rates in H2, making this Tuesday’s speech by Fed’s Chair Powell another opportunity for the market to pick on his thinking. He is likely to sound non-committal even if the Fed’s favorite yield curve (3m-10y) is telling us more stimulus is coming unless there is a surprising U-turn in the trade relationships between the US and China.
  • Several reports suggest that the US Chamber of Commerce is looking at a legal challenge to US tariffs on Mexico. Groups engaged in the discussions are hoping to shed a light by Monday.
  • US April PCE core came at +1.6% y/y vs +1.6% expected. By breaking down the report, there were some glimpses of hope as the consumer showed stronger spending appetite.
  • Canada Q1 GDP came at 0.4% annualized vs 0.7% estimate, which combined with the ongoing massacre of Oil longs, together with the contagion fears of the Mexican tariffs with Canada potentially next on the list, it led to continuous heavy supply flows in the Canadian Dollar.
  • China’s PMI readings saw a terrible outcome at 49.4 vs 50 exp, and as reported by Forexlive, not only was a miss but it came in below all estimates (from the Bloomberg survey). The Caixin Manufacturing PMI on Monday will be another chance to take a pulse of the Chinese economy.

Recent Economic Indicators & Events Ahead
cal2_190602_211826.png

cal_190602_211826.png

Source: Forexfactory

RORO (Risk On, Risk Off Conditions)
E3Nz7AKKBak6DsxKfqS618tFvxdtc-EOr3zhWP8yon-RIOQFSCidU1QosKV9CZ_2WfuSH9eb71lV-JrdX1pkugScDndbsIHCyXriw8X16diSGbRCQAQN4CiWf-rgsKNVel4cBaVN


The one-way street fall in US yields and the DXY comes in response to a market spooked by the latest threat by US President Trump to tax all import goods from Mexico. The bold move by Trump, indirectly, has the market discounting that China will be, at the very least, further disillusioned about the prospects of pursuing a comprehensive trade deal with the US in the first place. Mexico spent over 1 year negotiating the ratification of a modified NAFTA agreement only to receive this reprimand by Trump over border issues, so the Chinese may be asking themselves, why bother? Through the eyes of China, this new chapter against Mexico is mounting evidence of how dicey the environment can be when trying to talk serious business with the Trump administration. The bottom line is that the more signs of trade disputes in existence with no end in sight, with China at the forefront, the more the market is set to selloff to adjust its true valuation. Let’s not forget that a large part of the epic recovery rally in risk through Q1 came on the basis of a high degree of certainty, to the point of being fully priced, that the US and China would ink a deal. Every day, we seem to be moving further apart from that anticipated event, hence why the risk off remains well justified. It doesn’t matter what asset class one looks at, the message is unambiguously clear. The deleveraging phase is well and alive, and the closes in risk assets, from the S&P 500, through the US 30y bond yield, to the Japanese Yen index, all suggest a market with a null appetite to catch a falling knife.

13_190602_211934.jpg


Latest Key Developments In FX (Technicals, Fundamentals, Intermarket)

EUR/USD: Buyers Manage To Regain Control

14_190602_211920.jpg


GBP/USD: Double Distribution Up May Mark Meaningful Bottom


15_190602_212028.jpg


AUD/USD: Playing The Edges Name Of The Game


17.jpg


USD/JPY: Perfect Bearish Storm As DXY, US30Y Move In Tandem


16_190602_212347.jpg


Important Footnotes


  • Risk model: The fact that financial markets have become so intertwined and dynamic makes it essential to stay constantly in tune with market conditions and adapt to new environments. This prop model will assist you to gauge the context that you are trading so that you can significantly reduce the downside risks. To understand the principles applied in the assessment of this model, refer to the tutorial How to Unpack Risk Sentiment Profiles
  • Cycles: Markets evolve in cycles followed by a period of distribution and/or accumulation. To understand the principles applied in the assessment of cycles, refer to the tutorial How To Read Market Structures In Forex
  • POC: It refers to the point of control. It represents the areas of most interest by trading volume and should act as walls of bids/offers that may result in price reversals. The volume profile analysis tracks trading activity over a specified time period at specified price levels. The study reveals the constant evolution of the market auction process. If you wish to find out more about the importance of the POC, refer to the tutorial How to Read Volume Profile Structures
  • Tick Volume: Price updates activity provides great insights into the actual buy or sell-side commitment to be engaged into a specific directional movement. Studies validate that price updates (tick volume) are highly correlated to actual traded volume, with the correlation being very high, when looking at hourly data. If you wish to find out more about the importance tick volume, refer to the tutorial on Why Is Tick Volume Important To Monitor?
  • Horizontal Support/Resistance: Unlike levels of dynamic support or resistance or more subjective measurements such as fibonacci retracements, pivot points, trendlines, or other forms of reactive areas, the horizontal lines of support and resistance are universal concepts used by the majority of market participants. It, therefore, makes the areas the most widely followed and relevant to monitor. The Ultimate Guide To Identify Areas Of High Interest In Any Market
  • Trendlines: Besides the horizontal lines, trendlines are helpful as a visual representation of the trend. The trendlines are drawn respecting a series of rules that determine the validation of a new cycle being created. Therefore, these trendline drawn in the chart hinge to a certain interpretation of market structures.
  • Correlations: Each forex pair has a series of highly correlated assets to assess valuations. This type of study is called inter-market analysis and it involves scoping out anomalies in the ever-evolving global interconnectivity between equities, bonds, currencies, and commodities. If you would like to understand more about this concept, refer to the tutorial How Divergence In Correlated Assets Can Help You Add An Edge.
  • Fundamentals: It’s important to highlight that the daily market outlook provided in this report is subject to the impact of the fundamental news. Any unexpected news may cause the price to behave erratically in the short term.
  • Projection Targets: The usefulness of the 100% projection resides in the symmetry and harmonic relationships of market cycles. By drawing a 100% projection, you can anticipate the area in the chart where some type of pause and potential reversals in price is likely to occur, due to 1. The side in control of the cycle takes profits 2. Counter-trend positions are added by contrarian players 3. These are price points where limit orders are set by market-makers. You can find out more by reading the tutorial on The Magical 100% Fibonacci Projection
 
Find my latest market thoughts

RBA Cuts Rate For The First Time In Nearly 3y

POSTED ON: 04 JUN, 2019

If there was any doubt that we are fully entrenched in a broad-based dovish outlook for Central Banks around the globe as trade disputes intensify and inflation is nowhere to be found, the official commencement of the RBA easing cycle is yet further evidence...


The Daily Edge is authored by Ivan Delgado, Market Insights Commentator at Global Prime. The purpose of this content is to provide an assessment of the market conditions. The report takes an in-depth look of market dynamics, factoring in fundamentals, technicals, inter-market in order to determine daily biases and assist one’s decisions on a regular basis. Feel free to follow Ivan on Twitter & Youtube.

Quick Take

If there was any doubt that we are fully entrenched in a broad-based dovish outlook for Central Banks around the globe as trade disputes intensify and inflation is nowhere to be found, the official commencement of the RBA easing cycle is yet further evidence of such well-telegraphed thesis. Moreover, judging by the violent selloff in the DXY, the market is clearly growing convinced of the premise that the Federal Reserve might be the next Central Bank to bite the bullet. Remember, sellers in risky assets are still exerting complete control in fixed income and equity valuations, which makes the recent pullback in the Japanese Yen an attractive proposition upon one's strategy agreeing. The hammering of the US Dollar has, by default, led to the Euro capitalizing the most, while the performance of the Sterling continues to underwhelm. The Aussie, meanwhile, has managed to navigate the RBA rate cut with a firm stance, as there were no signs of a dovish cut, with the Central Bank hinging its next call on rates to labor conditions.

ice_screenshot_20190604-081018.png

Narratives In Financial Markets

* The Information is gathered after scanning top publications including the FT, WSJ, Reuters, Bloomberg, ForexLive, Institutional Bank Research reports.

  • The Reserve Bank of Australia, as widely expected, lowered its interest rate by 25 bp to 1.25% from 1.50%. The key question in today’s event was whether or not the Central Bank will portray a dovish enough stance to justify the nearly 75bp of cuts priced in the next 12 months. In other words, will the RBA produce a neutral cut that may cause a relief rally in the AUD or a dovish cut, implying a July cut follow up.
  • Judging by the immediate reaction in the AUD post cut, there was no explicit mention of any further rate cuts even if the statement does not imply the easing cycle is over either, far from it, noting that “the Board will continue to monitor developments in the labour market closely and adjust monetary policy to support sustainable growth in the economy and the achievement of the inflation target over time.” One can compare May vs June statements, courtesy of Anthony Barton from MNI News.
  • Australia’s retail sales for April came at -0.1% m/m vs 0.2% expected, which is yet again another marked disappointment and reinforces the notion that the RBA is not done cutting rates as lower consumer spending is directly related to housing’s disposable income (jobs).
  • In the crypto space, while unrelated to the behavior of currency markets, we’ve seen aggressive sell-side flows returning into the BTC market, which has collapsed sub $8k.
  • The market is still trying to figure out if the threats by Trump to increase the tariffs on Mexican imported goods is going to come to fruition or is just a bluff. Based on the headlines via Mexican officials, they seemed undeterred, thinking the chances of tariff hikes are slim. Besides, US press notes that Republicans in Congress are seriously considering to put this decision to a vote in order to block President Trump's planned new tariffs on Mexico.
  • The US administration made a statement saying that China is misrepresenting trade talks in response to China's white paper on trade. These type of headlines do portray the abysmal differences and hostile approach taken by both sides. It represents negative fundamental fuel to keep the risk off profile well and alive.
  • According to the Australian local press, the government is urging Britain to ban Chinese tech giant Huawei from a role in building new ultra-fast mobile networks, arguing the western alliance of intelligence-sharing partners should have a consistent position. The risk of China retaliating economically against Australia is rising.
  • There is no doubt that the market is growing increasingly dovish on the outlook for the Fed monetary policy going forward, as the performance by the DXY depicts. The Fed’s favorite yield curve (3m/10y) has deteriorated dramatically, which communicates the market is clearly anticipating a Fed in a gradual transition into lower interest rates on trade and inflation risks. The next two Fed meetings are on June 19 and July 31. While one may think is highly improbable for the Fed to cut rates in June, the market is assigning a 38% chance of a cut, while the odds of a cut in July stand at just over 50%.
  • Reinforcing the idea that lower rates in the US may be coming, Fed's member Bullard told the press that a rate cut may be warranted soon on trade and inflation risks, adding that the inversion in bond rates now also supports the case for lower interest rates.
  • US May ISM manufacturing index came at 52.1 vs 53.0 expected, the lowest read since Oct 2016. The deterioration in the data comes mainly driven by renewed pessimism as the survey period coincided with the announcement of new tariffs by the Trump administration. This economic release is mounting evidence of the faltering in US growth momentum.
  • In Europe, we get the CPI flash estimate y/y, expected to come at 1.4%, while the core CPI flash estimate y/y is anticipated at 1.0%. After peaking out at the 2% mark, inflationary pressures in the Euro area have been on a steady slide as the growth outlook in Europe stays stagnant.
  • Fed’s Power is due to speak about the Federal Reserve's policy strategy, tools, and communication practices at an event hosted by the Federal Reserve Bank of Chicago; the attention clearly fixated in any potential indication that lower rates in the US are coming.

Recent Economic Indicators & Events Ahead

cal1.png

ice_screenshot_20190604-081330.png


Source: Forexfactory

RORO (Risk On, Risk Off Conditions)

E3Nz7AKKBak6DsxKfqS618tFvxdtc-EOr3zhWP8yon-RIOQFSCidU1QosKV9CZ_2WfuSH9eb71lV-JrdX1pkugScDndbsIHCyXriw8X16diSGbRCQAQN4CiWf-rgsKNVel4cBaVN


The thematic of broad-based USD weakness in the context of an ongoing deleveraging is without the shed of a doubt the dominant profile ruling market dynamics. And even if the Yen index does not reflect a deterioration in financial conditions in the last 24h, judging by the performance of fixed income assets, equities or the VIX clinging onto the 20.00 mark, the risk-averse conditions argue for buying weakness in the currency.

It really is a bloodbath in the DXY and US yields at the moment, as the perception has rapidly permuted from a Fed with room to hold onto its neutral stance to no longer in a position to justify such thesis as the market comes to terms that a protracted trade war with China, alongside low inflation, are the prerequisites to move the needle in lower rates. The US 2-yr yield has come down below 1.9% while the benchmark Fed funds stay at 2.25%-2.5%, a clear declaration of intentions by market forces, no longer ignoring that the backdrop is very unfavorable for the Fed to allow a prolonged period of neutral policy settings. Overall, stay vigilant as the risk-off is well, alive and justified.

22.jpg


Latest Key Developments In FX (Technicals, Fundamentals, Intermarket)

EUR/USD: Overstretched Bullish Run Finds Equilibrium At Hefty Prices

24.jpg


GBP/USD: Bullish Structure Maintained With High Acceptance


25.jpg


USD/JPY: Sell-Side Bias Remains Intact


26.jpg


AUD/USD: Bullish Stepping Formation Despite RBA Rate Cut


ice_screenshot_20190604-081522.png

Important Footnotes
  • Risk model: The fact that financial markets have become so intertwined and dynamic makes it essential to stay constantly in tune with market conditions and adapt to new environments. This prop model will assist you to gauge the context that you are trading so that you can significantly reduce the downside risks. To understand the principles applied in the assessment of this model, refer to the tutorial How to Unpack Risk Sentiment Profiles
  • Cycles: Markets evolve in cycles followed by a period of distribution and/or accumulation. To understand the principles applied in the assessment of cycles, refer to the tutorial How To Read Market Structures In Forex
  • POC: It refers to the point of control. It represents the areas of most interest by trading volume and should act as walls of bids/offers that may result in price reversals. The volume profile analysis tracks trading activity over a specified time period at specified price levels. The study reveals the constant evolution of the market auction process. If you wish to find out more about the importance of the POC, refer to the tutorial How to Read Volume Profile Structures
  • Tick Volume: Price updates activity provides great insights into the actual buy or sell-side commitment to be engaged into a specific directional movement. Studies validate that price updates (tick volume) are highly correlated to actual traded volume, with the correlation being very high, when looking at hourly data. If you wish to find out more about the importance tick volume, refer to the tutorial on Why Is Tick Volume Important To Monitor?
  • Horizontal Support/Resistance: Unlike levels of dynamic support or resistance or more subjective measurements such as fibonacci retracements, pivot points, trendlines, or other forms of reactive areas, the horizontal lines of support and resistance are universal concepts used by the majority of market participants. It, therefore, makes the areas the most widely followed and relevant to monitor. The Ultimate Guide To Identify Areas Of High Interest In Any Market
  • Trendlines: Besides the horizontal lines, trendlines are helpful as a visual representation of the trend. The trendlines are drawn respecting a series of rules that determine the validation of a new cycle being created. Therefore, these trendline drawn in the chart hinge to a certain interpretation of market structures.
  • Correlations: Each forex pair has a series of highly correlated assets to assess valuations. This type of study is called inter-market analysis and it involves scoping out anomalies in the ever-evolving global interconnectivity between equities, bonds, currencies, and commodities. If you would like to understand more about this concept, refer to the tutorial How Divergence In Correlated Assets Can Help You Add An Edge.
  • Fundamentals: It’s important to highlight that the daily market outlook provided in this report is subject to the impact of the fundamental news. Any unexpected news may cause the price to behave erratically in the short term.
  • Projection Targets: The usefulness of the 100% projection resides in the symmetry and harmonic relationships of market cycles. By drawing a 100% projection, you can anticipate the area in the chart where some type of pause and potential reversals in price is likely to occur, due to 1. The side in control of the cycle takes profits 2. Counter-trend positions are added by contrarian players 3. These are price points where limit orders are set by market-makers. You can find out more by reading the tutorial on The Magical 100% Fibonacci Projection
 
Find my latest market thoughts

Vol Set To Pick Up With ECB, US NFP Ahead

POSTED ON: 06 JUN, 2019

The US Dollar regained its mojo as the market took most notice of a very strong US non-manufacturing ISM survey, even if traders had to previously contend with the lowest US ADP employment report in over 9 years.


The Daily Edge is authored by Ivan Delgado, Market Insights Commentator at Global Prime. The purpose of this content is to provide an assessment of the market conditions. The report takes an in-depth look of market dynamics, factoring in fundamentals, technicals, inter-market in order to determine daily biases and assist one’s decisions on a regular basis. Feel free to follow Ivan on Twitter & Youtube.

Quick Take

The US Dollar regained its mojo as the market took most notice of a very strong US non-manufacturing ISM survey, even if traders had to previously contend with the lowest US ADP employment report in over 9 years. This mixed bag of economic indicators has led to confusing signals heading into Friday's US NFP report, which is going to be cardinal to re-assess the chances of the Fed cutting its interest rate in the July to Sept window. Before the US NFP lottery event though, traders will be fixated on two fronts. Firstly, the ECB policy decision, set to release updated forecasts on inflation and GDP. Secondly, the market needs clarification on whether the US will impose tariffs to Mexico as Monday's deadline set by Trump approaches. Overall, the risk environment has been friendly once again, especially in the volatile equity market, supported by the notion of a dovish Fed in coming months, as the 69% pricing of a rate cut by the July 31st FOMC meeting clearly depicts. The Yen seems to be defying this rationale by still finding strong demand, which comes to show that the current risk rally is limping of one leg as one would expect Yen selling as part of the 'risk on' procedures. The Kiwi, meanwhile, was the only currency that managed to challenge the pick up in USD demand, spurred by the neutral tone by the RBNZ assistant governor against dovish expectations. The behavior in the Kiwi comes in stark contrast with the poor performance of the Aussie, as the market remains of the belief that there is more easing ammunition to be utilized by the RBA. Ahead of the ECB, and in anticipation of Draghi striking a more pessimistic message that may reinforce their existing dovish stance, the market has been selling Euros. Sandwiched in between the currency crosscurrents we find the Canadian Dollar and the Pound, unstimulated by the absence of fundamental developments.

10_190606_042242.jpg


Narratives In Financial Markets

* The Information is gathered after scanning top publications including the FT, WSJ, Reuters, Bloomberg, ForexLive, Institutional Bank Research reports.

  • Markets remain buying into the notion that the US and Mexico will reach an agreement to avoid tariffs judging by the behavior of risky assets. Talks on border issues began Wednesday, which means in the next 48h headlines on new developments will likely act as yet another catalyst for a pick up in volatility.
  • While China has been clearly ramping up the domestic propaganda as a way to retaliate against the US, Trump notes every signal is that China wants to make a deal.
  • The European Commission has triggered a disciplinary process against Italy over public debt, noting that Italy is backtracking from structural overhauls, pension reform.
  • A very weak ADP employment report at 27k vs 185k expected (lowest in about 9y) was offset by an upbeat US non-manufacturing ISM survey coming at 56.9 vs 55.6 expected. Looking at the details, the ADP miss was mainly caused by small firms, which should appease the nerves.
  • Oil suffers further losses after the EIA reported the largest build up in oil product inventories in almost 30 years as fears of a global slowdown grow.
  • The shockingly low ADP report has led to some banks to immediately downgrade the estimates for this Friday’s US NFP, even if the sub-component of the non-manufacturing ISM came strong, which suggest a still relentless labor market. A mixed lead heading into Friday's NFP.
  • Ahead of the FOMC meeting on June 18-19, the Fed’s ‘Beige Book’ concluded that regional US economic conditions showed a modest pick-up in growth in April and May.
  • US Treasury Secretary Mnuchin is scheduled to meet with PBOC Governor Yi Gang in Japan in the context of a G-20 meetup from June 7-9. It’s the first time, ever since the US-China trade impasse, that a high-profile US official will try to break the impasse in the trade war with China.
  • Further evidence of a slowdown in China’s economic activity after the May Caixin services PMI came at 52.7 vs 54.5 prior, mainly due to subdued business confidence.
  • Australia’s Q1 GDP came lower than expected at 0.4% q/q vs 0.5%. Household spending was a key contributor to the modest 0.1 percent slide in growth as spending in discretionary goods such as furnishing and household equipment, recreation and culture take a hit.
  • The Kiwi found strong demand after RBNZ assistant gov says Bank needs to adapt to changing conditions to meet its objectives Wed 5 Jun 2019 01:24:45 GMT Author: Eamonn Sheridan | Category: Central Banks Reserve Bank of New Zealand said the Bank's central view is for rates to remain broadly around current levels for the foreseeable future, which took the market by surprise as expectations were for NZ to follow the path of lower rates in Australia.
  • The ECB policy meeting is the next major focus, with the Central Bank set to release updated forecasts on inflation and GDP, with most analysts calling for downgrades. It will also be critical to understanding the ECB position amid the escalation in trade tensions as well as the revelation of new details around the next round of TLTRO and other unorthodox tools to support the EU.

Recent Economic Indicators & Events Ahead

cal1_190606_042310.png

cal2_190606_042310.png

Source: Forexfactory

RORO (Risk On, Risk Off Conditions)
E3Nz7AKKBak6DsxKfqS618tFvxdtc-EOr3zhWP8yon-RIOQFSCidU1QosKV9CZ_2WfuSH9eb71lV-JrdX1pkugScDndbsIHCyXriw8X16diSGbRCQAQN4CiWf-rgsKNVel4cBaVN

The more the market prices in a cut in the Fed’s fund rate, more of an excuse exist to justify a recovery in equity valuations, as clearly reflected by the reversal in the micro and macro flows via the bullish slope of the 25 and 125-HMAs. According to the CME Fedwatch tool, the market is pricing a 69% chance that the Fed will lower its interest rate in its July 31st FOMC meeting. As a secondary culprit behind the renewed buying interest, hopes that the US and Mexico may strike a deal that will avoid the imposition of tariffs by next Monday also contributed to the ongoing momentum in equities, putting the tensions between the US and China on trade temporarily on the backburner, even if such impasse remains the key macro issue to be fixated with casting a major shadow in this risk recovery.

ice_screenshot_20190606-065041.png

The state of play in US equities runs the risk of growing disjointed to other risky assets as the paradigm that seems to be evolving is one where the Fed lowers rates to stimulate growth, which would only occur if the US and China fail to breach the major gap on trade. In this scenario, equities may still stay supported. Remember though, that paradoxically, one of the triggers for the Fed to be pushed into easing action in the July to Sept window, would be a deterioration of financial conditions, hence why it still may take fresh rounds of selling pressure in equities for the Fed to be fully convinced that they must act in order to circuit break the bearish trend in stocks.

On the currency front, it’s interesting to note that the Yen and the DXY both traded firm, especially the latter, despite the rejuvenated risk appetite currently present, implying there is a disparity between how equities and bond traders view current dynamics and the state of affairs, especially in the Yen. Other measures of risk such as the S&P 500 vol index (VIX) or junk bonds do justify the rise in equities, even if by assessing the valuation in Chinese assets, it’s clear that the market’s renewed ‘risk on’ profile is not built upon hopes of the US and China addressing the trade conundrum. Remember, we have a new driver for risk to be supported in the form of expectations for a more accommodative Fed, a factor that is being discounted through higher valuations in equities as large companies’ dividends become more attractive in an environment of lower rates by the Fed.

11_190606_042502.jpg

Latest Developments In FX (Technicals, Fundamentals, Intermarket)


EUR/USD: Bullish Structure Violated, ECB To Inject Vol


12_190606_042517.jpg


GBP/USD: Sellers Take Control Intraday


14_190606_042543.jpg


AUD/USD: Price Finds Equilibrium Below Key Support


16_190606_042606.jpg


USD/JPY: Still Stuck In A Range, Proj Targets Eyed


15_190606_042636.jpg

Important Footnotes
  • Risk model: The fact that financial markets have become so intertwined and dynamic makes it essential to stay constantly in tune with market conditions and adapt to new environments. This prop model will assist you to gauge the context that you are trading so that you can significantly reduce the downside risks. To understand the principles applied in the assessment of this model, refer to the tutorial How to Unpack Risk Sentiment Profiles
  • Cycles: Markets evolve in cycles followed by a period of distribution and/or accumulation. To understand the principles applied in the assessment of cycles, refer to the tutorial How To Read Market Structures In Forex
  • POC: It refers to the point of control. It represents the areas of most interest by trading volume and should act as walls of bids/offers that may result in price reversals. The volume profile analysis tracks trading activity over a specified time period at specified price levels. The study reveals the constant evolution of the market auction process. If you wish to find out more about the importance of the POC, refer to the tutorial How to Read Volume Profile Structures
  • Tick Volume: Price updates activity provides great insights into the actual buy or sell-side commitment to be engaged into a specific directional movement. Studies validate that price updates (tick volume) are highly correlated to actual traded volume, with the correlation being very high, when looking at hourly data. If you wish to find out more about the importance tick volume, refer to the tutorial on Why Is Tick Volume Important To Monitor?
  • Horizontal Support/Resistance: Unlike levels of dynamic support or resistance or more subjective measurements such as fibonacci retracements, pivot points, trendlines, or other forms of reactive areas, the horizontal lines of support and resistance are universal concepts used by the majority of market participants. It, therefore, makes the areas the most widely followed and relevant to monitor. The Ultimate Guide To Identify Areas Of High Interest In Any Market
  • Trendlines: Besides the horizontal lines, trendlines are helpful as a visual representation of the trend. The trendlines are drawn respecting a series of rules that determine the validation of a new cycle being created. Therefore, these trendline drawn in the chart hinge to a certain interpretation of market structures.
  • Correlations: Each forex pair has a series of highly correlated assets to assess valuations. This type of study is called inter-market analysis and it involves scoping out anomalies in the ever-evolving global interconnectivity between equities, bonds, currencies, and commodities. If you would like to understand more about this concept, refer to the tutorial How Divergence In Correlated Assets Can Help You Add An Edge.
  • Fundamentals: It’s important to highlight that the daily market outlook provided in this report is subject to the impact of the fundamental news. Any unexpected news may cause the price to behave erratically in the short term.
  • Projection Targets: The usefulness of the 100% projection resides in the symmetry and harmonic relationships of market cycles. By drawing a 100% projection, you can anticipate the area in the chart where some type of pause and potential reversals in price is likely to occur, due to 1. The side in control of the cycle takes profits 2. Counter-trend positions are added by contrarian players 3. These are price points where limit orders are set by market-makers. You can find out more by reading the tutorial on The Magical 100% Fibonacci Projection
 
Find my latest market thoughts

US, China Avoid Worst Case In Trade War

The uneasy truce, for lack of a better word, between Trump and Xi at the G20 to avoid the worst case scenario of a potential full-blown trade war, has led to the extension of the ‘risk on’ tone with the likes of the commodity currencies the most benefited.
The Daily Edge is authored by Ivan Delgado, Market Insights Commentator at Global Prime. The purpose of this content is to provide an assessment of the market conditions. The report takes an in-depth look of market dynamics, factoring in fundamentals, technicals, inter-market in order to determine daily biases and assist one’s decisions on a regular basis. Feel free to follow Ivan on Twitter & Youtube.

Quick Take

The uneasy truce, for lack of a better word, between Trump and Xi at the G20 summit to avoid a potential full-blown trade war, has led to the extension of the ‘risk on’ tone with the likes of the commodity currencies, as the indices performance chart illustrates, the most benefited. The interbank adjustments in forex quotes (gaps) ahead of the retail open in Asia, do feel overstretched on the preconditions of an event largely priced in since last week, with the addition that the temporary truce, at this stage, is simply an agreement of intentions. Nothing has been achieved yet on all the sensitive issues that remain on the table even if one can argue that the avoidance of further tariffs and rolling back some restrictions on Huawei are acting as a driver. So, one must question how much fuel is left until we see a meaningful reversal? Are we in a buy the rumor sell the fact? For now, there is no reason to be too defensive if looking to exploit momentum trades intraday the likes of AUD/JPY or AUD/CHF as the trend should be your friend. It is, however, when one steps back to take a bigger view off the daily, where the overcooked nature of certain currency movements start to become more obvious, which leads me to think there are no clear cut daily signals of note. That said, I do find fading strength in the USD/JPY to offer solid merit while awaiting the market to show its hand post the G20 in the conglomerate of currency crosses. While the G20 meeting outcome is positive for the AUD/USD, the RBA must decide tomorrow if it cuts the cash rate further, and with trade strifes not really part of the RBA’s justification on its current easing cycle, there is understandably cautioun that the RBA will go for another rate cut following the June one. Pricing for a cut to 1% stands around 65%, only marginally lower than the 70% on Friday. Even if an eventual comprehensive trade deal remains elusive and a far-fetched outcome given the major discrepancies still standing in the way of both superpowers, one consideration to let it sink in too is the fact that the Fed cut expectations are likely to see a sustained trimming in the immediate future (July 31st) while the dovish prospects over the next year should barely budge. This Friday's June payrolls (Jul 5), alongside other key releases this month such as CPI (Jul 11), retail sales (Jul 16) and Q2 GDP (Jul 26) will also be key.

1_190701_021910.jpg


Narratives In Financial Markets


* The Information is gathered after scanning top publications including the FT, WSJ, Reuters, Bloomberg, ForexLive, Institutional Bank Research reports.
  • Following the high-stakes meeting between President Trump and China’s Xi, a temporary truce to avoid the escalation of the trade war is the best outcome one could have hoped for, as both sides find a compromise to resume talks in the months ahead.
  • The time horizon has stretched to the extent that few expect the two major global economies to find a meaningful compromise to put off the fire till year-end at minimum. As Trump tweeted, which confirms this premise unless the tactics change, “the quality of the transaction is far more important to me than speed."
  • The key details that emerged out of the meeting in the G20 include the confirmation that the US will not levy new tariffs on Chinese goods, while softening the punitive rhetoric against Huawei, as Trump will now allow, on a strictly restrictive basis, for the Chinese tech giant to purchase equipment from US companies.
  • In Trump’s words, this "complicated" Huawei issue will go to the backburner until the end of talks. White House economic advisor Kudlow added that Trump wasn’t planning a “general amnesty” on Huawei and that export controls would remain in place.
  • Make no mistake, the truce reached by Xi and Trump, is just the avoidance of further escalation, but ahead lies the tougher tasks. Both sides will have a hard time trying to convince their parties to give much ground. Xi and party leaders have grown their skepticism about Trump’s agenda to undermine China’s economic model, while Trump cannot act or sound as it will cost him popularity and votes on the run-up to the 2020 election.
  • For now, it’s all well-premeditated posturing/pretending with no meat on the bone. Consequently, the mild positive to bid risk is that the worst possible scenario won’t materialize, even if the hiking of tariffs remains, which may clearly undermine firms’ investment and hiring intentions.
  • No reason to be exuberant about the Chinese economy, which without a doubt, has helped to tilt President Xi towards further attempts to steering back the ‘trade war’ boat adrift. In case one wonders if fundamentals are picking up, the weekend data lagged once again. China PMIs for June came at uninspiring levels, with the manufacturing at 49.4 vs 49.5 expected, while the series of the services stood at 54.2 vs 54.2 expected. Next up is the private survey PMIs via Caixin/Markit.
  • As the South China Morning Post headlines: “Despite Donald Trump and Xi Jinping’s G20 handshake, mistrust and disputes persist”, which is what leads me to believe that the soft patch in Chinese manufacturing conditions we are seeing may persist for quite some time.
  • The official G20 communique in Osaka warned that global growth remains precariously subdued and risks were tilted to the downside, with trade and geopolitical tensions on the rise. “We strive to realize a free, fair, nondiscriminatory, transparent, predictable and stable trade and investment environment, and to keep our markets open.”
  • Russia and Saudi Arabia have come to agree on an extension on the OPEC+ oil output curbs for 6 to 9 months. "We will support the extension, both Russia and Saudi Arabia. As far as the length of the extension is concerned, we have yet to decide whether it will be six or nine months. Maybe it will be nine months," Saudi Energy Minister Khalid al-Falih” said.
  • Deputy Governor of the RBNZ Geoff Bascand gave a speech on macroprudential tools this Monday in Asia, noting that scope exists for further easing in LVRs (loan-to-value ratios) if risks decline. Bascand added that “our refreshed strategy on macroprudential policy provides us with greater clarity on how we will use macroprudential tools in the future.”
  • Last Friday’s US May PCE core came a tad higher at +1.6% y/y vs 1.5% expected. As long as the reading is below 2%, which has been the case for most of the last 7 years, the Fed can find no justification to sound more hawkish on the basis of inflationary risks. Similarly, it won’t hurt the case for rate cuts since no deterioration in its favored inflation measure existed.
  • The Canadian data continues to earn my respect as both the April GDP, at +0.3% vs +0.2% expected, and the Canadian Business Outlook Survey topped expectations. The oil and gas sector contributed the most to the blip higher seen. Meanwhile, the encouraging numbers out of businesses forward-looking economic expectations are yet another source to be optimistic about the prospects of a no cut by the BoC. Judging by the CA bond yield spreads, the recent offered tone in the bonds (higher yields) reflects positivism in this front.
  • The US Chicago PMI took a major hit by falling under 50.00, which is the level that defines, in economics 101, expansions from contraction. The reading of 49.7 vs 53.5 expected. If there was any doubt that protectionism and the ramifications of the trade war are feeding through businesses’ outlook, over 80% of the Chicago PMI firms surveyed replied they were negatively impacted due to tariffs raising prices of their goods leading to a pullback in orders.
  • Australia’s Housing indicators, based on the metrics via the weekend auction clearance rates, keep recovering, with levels of stabilization above 60%. Even if volumes are still significantly lower than last year, the prelim clearance rate has seen a marked improvement since last year.
Recent Economic Indicators & Events Ahead

ice_screenshot_20190701-012121.png
ice_screenshot_20190701-012144_190701_022110.png


Source: Forexfactory

RORO (Risk On, Risk Off Conditions)

Risk assets have opened in Asia with a bid tone as the US and China avert the worst case scenario by agreeing to resume trade talks. Now, I’d argue that as the bearish breakout in the JPY index below the daily baseline (13-EMA) or the performance in the Shanghai Composite (bullish), USD/CNH (bearish) can technically attest, the ‘truce’ trade has been, at least partially, if not fully, running its course by being priced in since last week. The gaps undeniably communicate the mood to bid risk is positive, while the lack of any details beyond the vague promises of both parties coming back to the drawing table, in what’s a ‘risk on’ move that had its initiation last week, do make a case for the gaps to be potentially filled before finding out whether or not ‘risk on’ buyers will continue to dominate the ebbs and flows. I wouldn’t be fighting the trend, which means overcommitting capital against the likes of the Aussie, Kiwi or the Loonie in this environment remains a dangerous proposition as the momentum on the China-US news has the pedigree to potentially last for days if not weeks, if history on how Trump can manipulate markets is any indication. The Japanese Yen or the Swiss Franc are two clear candidates to attract increasing selling interest amid this improving background.

24_190701_022147.jpg


A Dive Into FX (Technicals, Fundamentals, Intermarket)


For those calling a positive path in the EUR/USD going forward, I can definitely see the merit behind defending such view even if the price looks awfully restrictive to engage from a risk-reward perspective when analyzing the daily chart. Why am I saying that? Because we are trading significantly above the 13-EMA baseline, which after tonnes of testing, is the newly adopted delimitation that I am using to determine if we are in an uptrend or in a downtrend on the daily chart. Other popular measures include the 5-EMA for shorter-term trend identification or the 21-EMA to adopt a longer horizon view. So, the current status in the EUR/USD is acceptance above 1.1350 in what’s become the narrowest trading range since 2004! That’s quite an eye-catching stat, but not the only one must take note, as the pair has achieved a successful bullish rotation with equilibrium found above its prior swing high. This is a very constructive technical occurrence that had not transpired in the daily chart since Sept of last year. What this bullish structure makes me anticipate is that bulls are definitely the force to be in control in July until proven wrong, which would include as an initial precursor a retake sub the 13-EMA with volume increasing, but even more important, sellers to be staring at the ascending trendline from the rear mirror.

2_190701_022239.jpg


If one is looking for some inspiration in the GBP/USD, I am afraid you won’t find any conclusive technical clues that may tilt the balance in either way out of the daily chart. Yes, the price is mildly above the 13-EMA baseline, but Friday’s bullish candle came on a rather poor volume below the average, not to mention that the area of liquidity around the 1.2750 as marked in red rectangle continues to prove a major nut to crack. That said, by checking the intermarket analysis, and unless any Brexit headlines distort this view, there continues to exist value to be a buyer on weakness.

3_190701_022300.jpg


Moving into the USD/JPY, just as the US-China trade truce appears rather vague in nature at this point, so does the attempts by this pair to break a key liquidity area at 108.50. One, which I will remind the readership, originates after a successful rotation lower, in other words, there is technical value to engage in shorts, especially on a gap higher amid the clear risk of an overcooked move as the US-China trade truce had been factored in since last week. Sell the fact, anyone? What’s more, by anchoring the DXY and US30Y bond yields (main drivers of USD/JPY), both assets trade significantly lower at a time when the pair is testing prior resistance. This means the higher it goes to retest the 108.50 vicinity and above, the greater the discount in price it offers.

4_190701_022329.jpg


What can we learn from the AUD/USD daily chart today? Firstly, the current bullish momentum is the most meritorious seen, based on the impulsivity of the leg, since late January this year. In favor of bullish continuation flows not only we find the fundamental support of the US-China soft breakthrough, but the close of Friday’s candle above the prior swing high is a testament that sellers are not as prolific in their conviction as they used to. If we throw into the mix, the positive flows in equities, the Chinese Yuan and the Aus-US bond yield spread, one can clearly make the case why I am of the opinion that looking for reversal shorts are not a trade that the technical status would suggest. On the flip side, I see two potential negatives. Firstly, the distance to the 13-EMA baseline does warrant caution as price tends to struggle to extend much further until a correction back to the mean. Secondly, as the move creeps higher, volume is stagnant below its average, which is what eventually leads to a movement exhausting and reversing. Overall, this is still a market to play long but at the right levels, which would have been about a week ago not at the current price.

5_190701_022348.jpg


Important Footnotes

  • Risk model: The fact that financial markets have become so intertwined and dynamic makes it essential to stay constantly in tune with market conditions and adapt to new environments. This prop model will assist you to gauge the context that you are trading so that you can significantly reduce the downside risks. To understand the principles applied in the assessment of this model, refer to the tutorial How to Unpack Risk Sentiment Profiles
  • Cycles: Markets evolve in cycles followed by a period of distribution and/or accumulation. To understand the principles applied in the assessment of cycles, refer to the tutorial How To Read Market Structures In Forex
  • POC: It refers to the point of control. It represents the areas of most interest by trading volume and should act as walls of bids/offers that may result in price reversals. The volume profile analysis tracks trading activity over a specified time period at specified price levels. The study reveals the constant evolution of the market auction process. If you wish to find out more about the importance of the POC, refer to the tutorial How to Read Volume Profile Structures
  • Tick Volume: Price updates activity provides great insights into the actual buy or sell-side commitment to be engaged into a specific directional movement. Studies validate that price updates (tick volume) are highly correlated to actual traded volume, with the correlation being very high, when looking at hourly data. If you wish to find out more about the importance tick volume, refer to the tutorial on Why Is Tick Volume Important To Monitor?
  • Horizontal Support/Resistance: Unlike levels of dynamic support or resistance or more subjective measurements such as fibonacci retracements, pivot points, trendlines, or other forms of reactive areas, the horizontal lines of support and resistance are universal concepts used by the majority of market participants. It, therefore, makes the areas the most widely followed and relevant to monitor. The Ultimate Guide To Identify Areas Of High Interest In Any Market
  • Trendlines: Besides the horizontal lines, trendlines are helpful as a visual representation of the trend. The trendlines are drawn respecting a series of rules that determine the validation of a new cycle being created. Therefore, these trendline drawn in the chart hinge to a certain interpretation of market structures.
  • Correlations: Each forex pair has a series of highly correlated assets to assess valuations. This type of study is called inter-market analysis and it involves scoping out anomalies in the ever-evolving global interconnectivity between equities, bonds, currencies, and commodities. If you would like to understand more about this concept, refer to the tutorial How Divergence In Correlated Assets Can Help You Add An Edge.
  • Fundamentals: It’s important to highlight that the daily market outlook provided in this report is subject to the impact of the fundamental news. Any unexpected news may cause the price to behave erratically in the short term.
  • Projection Targets: The usefulness of the 100% projection resides in the symmetry and harmonic relationships of market cycles. By drawing a 100% projection, you can anticipate the area in the chart where some type of pause and potential reversals in price is likely to occur, due to 1. The side in control of the cycle takes profits 2. Counter-trend positions are added by contrarian players 3. These are price points where limit orders are set by market-makers. You can find out more by reading the tutorial on The Magical 100% Fibonacci Projection
 
Find my latest market thoughts

Surge In USD Demand, RBA Slashes Cash Rate

Posted on: 02 Jul, 2019

The surge in US Dollar demand after the temporary truce reached between the US and China at the G20 has been the dominant theme so far. Granted, the market is still holding the firm belief that the Fed will go through an insurance rate cut by the end of July when they meet again (Fed's Clarida gave us a clear hint on Monday) ...

The Daily Edge is authored by Ivan Delgado, Market Insights Commentator at Global Prime. The purpose of this content is to provide an assessment of the market conditions. The report takes an in-depth look of market dynamics, factoring in fundamentals, technicals, inter-market in order to determine daily biases and assist one’s decisions on a regular basis. Feel free to follow Ivan on Twitter & Youtube.

Quick Take

The surge in US Dollar demand after the temporary truce reached between the US and China at the G20 has been the dominant theme so far. Granted, the market is still holding the firm belief that the Fed will go through an insurance rate cut by the end of July when they meet again (Fed's Clarida gave us a clear hint on Monday) even if the S&P 500 at record highs and the softening of US-China tensions argue the risks are building up for a hold. Should this scenario materialize, it would be a major upset for the market though, the Fed funds currently price in a nearly 80% chance for a cut. Throw into the mix that the US June ISM manufacturing index came upbeat on Monday, and should this week's US NFP post a solid number, the case would be gaining massive traction for the Fed to have a rethink over the aggressiveness of its easing cycle.

Amid such context, as the chart below shows, the US Dollar attracted the most demand with aggregated tick volume showing decent commitment by buyers, with the close near the highs by the NY close another key clue that the momentum remains strong as the market adjusts its view on the Fed and the trade war. On the flip side, there is fear that the trade war may now pivot towards the European Union, as the US proposes fresh tariffs, starting with $4bn on EU goods. With the ECB clearly on a dovish mode, the Euro is certainly not anchored by fundamentals, and the latest EU PMIs are only making it look like an even weaker currency, fundamentally speaking.

From a technical standpoint though, the structure in EUR/USD is still rather promising but as long as fundamentals are not congruent, it's hard to envision consistent demand. The EUR index below clearly reflects this idea of a vulnerable Euro, as it accumulates 5 days of losses in a row when crosschecked against an equally-weighted basket of the most-traded currencies. The same dark clouds are hovering over the Sterling, which is the currency most punished as the Brexit process remains on standby until a new Conservative leader is chosen and becomes prime minister. The plan is that the process should be concluded before the summer recess. What happens next on Brexit will depend on who wins.

We then have the circle of the three darlings of the market as of late, referring to the commodity-linked currency complex, with the Canadian Dollar clearly the standout as the BoC appears to be one of the only exceptions in terms of a Central Bank that, through Canada's economic indicators, is finding it hard to justify further rate cuts. This comes in stark contrast with the RBA, which just an hour ago made good on its series of hints that further rate cuts were warranted in Australia by slashing the cash rate by 25bp to 1%. Lastly, the Japanese Yen, while still on a downtrend from a daily perspective as the left chart below shows, saw solid demand after the opening gap, with the premise that best resonates to rationalize the move to have found sufficient buyers being that most of the China trade truce-led positivism had been largely priced in since mid last week.

ice_screenshot_20190702-072450.png


Narratives In Financial Markets


* The Information is gathered after scanning top publications including the FT, WSJ, Reuters, Bloomberg, ForexLive, Institutional Bank Research reports.

  • The RBA decided to cut its cash rate by 25 bps from 1.25% to 1.00%, noting that the rate will help to make inroads into spare capacity and achieve progress towards inflation target. Again, the RBA put emphasis on the jobs market as the key sector the cut needs to support. The Australian Dollar saw the typical seesaw but found buyers as the accompanying monetary policy statement does not make a clear case for more cuts from here on out.
  • The USD has greatly improved its appeal on the back of the US-China trade truce at the G20 alongside the rather off-the-cuff meeting between President Trump and North Korea's Kim, where they agreed to resume denuclearization talks.
  • The selling of Euros on Monday comes as a combination of a pretext that is gaining traction in the trading floors, that is, the Fed won’t be as aggressive easing policy as the US and China go back to the drawing table to find a trade compromise, while concerns are mounting that the US may soon pivot towards Europe as it proposed fresh tariffs, starting with $4bn on EU goods. Dairy, certain metals are set to be proposed to a list of goods to have tariffs levied further.
  • The array of EU PMIs releases does not help the outlook for the Euro either, as Germany’s, Spain’s, Italy’s, Switzerland’s manufacturing sectors remained into contraction territory.
  • US June ISM manufacturing index came at 51.7 vs 51.0 expected. The positive read strengthens the case for the Fed to be less dovish. Understandably, the USD reacted positively. According to the Fed funds watch tool via the CME, the market still expects a 78% chance of a rate cut by the end of July and odds of a 50bp cut still stand at a surprising 20%.
  • Fed vice chair, Richard Clarida, gave a speech in Helsinki, giving no hint that the Fed is going to backtrack from what seems a well-telegraphed insurance rate cut by the end of July, hence the above 78% chance. Fed's Clarida said there's more uncertainty about trade negotiations, global growth prospects, adding that there is room for more accommodative policies.
  • EU leaders' summit was suspended and set to reconvene again on Tuesday. What should command most of traders’ attention is further clues on the "favourite" runners for EU top jobs.
  • According to New Zealand’s Quarterly Survey of Business Opinion (QSBO), business confidence for Q2 came at -34%, which is a rather dramatic level not seen since Q1 of 2009. It implies the risks of further rate cuts by the RBNZ are a real prospect to be accounted for.
  • China’s June Caixin Manufacturing PMI underwhelmed at 49.4 vs. 50.1 expected and 50.2 prior, which is a very poor result, weighted by output and new work declines. The headline read is the second lowest since June 2016 and indicates a clear contraction in the manufacturing sector as domestic demand continues to slow down.

Recent Economic Indicators & Events Ahead
cal1_190702_050643.png

ice_screenshot_20190702-070838.png


Source: Forexfactory

A Dive Into FX Majors (Technicals, Fundamentals, Intermarket)


EUR/USD: Resolution Of Range Makes It To 100% Bearish Proj Target


2_190702_051408.jpg


GBP/USD: Breakout Of Key Support, Unfinished Business To The Downside

1_190702_051502.jpg


AUD/USD: Ascending Channel Pattern Disrupted, RBA Cuts Rate 2nd Month In A Row


4_190702_051608.jpg


USD/JPY: Bulls In Short-Term Control But Sticky Resistance Lies Ahead

3_190702_051802.jpg

Important Footnotes


    • Risk model: The fact that financial markets have become so intertwined and dynamic makes it essential to stay constantly in tune with market conditions and adapt to new environments. This prop model will assist you to gauge the context that you are trading so that you can significantly reduce the downside risks. To understand the principles applied in the assessment of this model, refer to the tutorial How to Unpack Risk Sentiment Profiles
    • Cycles: Markets evolve in cycles followed by a period of distribution and/or accumulation. To understand the principles applied in the assessment of cycles, refer to the tutorial How To Read Market Structures In Forex
    • POC: It refers to the point of control. It represents the areas of most interest by trading volume and should act as walls of bids/offers that may result in price reversals. The volume profile analysis tracks trading activity over a specified time period at specified price levels. The study reveals the constant evolution of the market auction process. If you wish to find out more about the importance of the POC, refer to the tutorial How to Read Volume Profile Structures
    • Tick Volume: Price updates activity provides great insights into the actual buy or sell-side commitment to be engaged into a specific directional movement. Studies validate that price updates (tick volume) are highly correlated to actual traded volume, with the correlation being very high, when looking at hourly data. If you wish to find out more about the importance tick volume, refer to the tutorial on Why Is Tick Volume Important To Monitor?
    • Horizontal Support/Resistance: Unlike levels of dynamic support or resistance or more subjective measurements such as fibonacci retracements, pivot points, trendlines, or other forms of reactive areas, the horizontal lines of support and resistance are universal concepts used by the majority of market participants. It, therefore, makes the areas the most widely followed and relevant to monitor. The Ultimate Guide To Identify Areas Of High Interest In Any Market
    • Trendlines: Besides the horizontal lines, trendlines are helpful as a visual representation of the trend. The trendlines are drawn respecting a series of rules that determine the validation of a new cycle being created. Therefore, these trendline drawn in the chart hinge to a certain interpretation of market structures.
    • Correlations: Each forex pair has a series of highly correlated assets to assess valuations. This type of study is called inter-market analysis and it involves scoping out anomalies in the ever-evolving global interconnectivity between equities, bonds, currencies, and commodities. If you would like to understand more about this concept, refer to the tutorial How Divergence In Correlated Assets Can Help You Add An Edge.
    • Fundamentals: It’s important to highlight that the daily market outlook provided in this report is subject to the impact of the fundamental news. Any unexpected news may cause the price to behave erratically in the short term.
    • Projection Targets: The usefulness of the 100% projection resides in the symmetry and harmonic relationships of market cycles. By drawing a 100% projection, you can anticipate the area in the chart where some type of pause and potential reversals in price is likely to occur, due to 1. The side in control of the cycle takes profits 2. Counter-trend positions are added by contrarian players 3. These are price points where limit orders are set by market-makers. You can find out more by reading the tutorial on The Magical 100% Fibonacci Projection
 
Back
Top