Sive Morten
Special Consultant to the FPA
- Messages
- 18,644
Fundamentals
Today we will not speak on gold, since market was closed on Friday and we mostly have discussed all issues there. So, I've decided to prepare weekly research on gold-related currency - AUD.
In the beginning of the research - comments on US Fed rate from Fanthom consulting:
US Inflation On The Rise
Headline US inflation has been below the Fed’s target since April 2012, and significantly so since the sharp falls in commodities prices. Market based measures of inflation expectations have fallen too. However, both inflation expectations and actual inflation data have turned upwards recently and on most measures inflation is already close to ‘normal’ levels.

Our chart shows how different measures of US inflation compare to their average over the 1998-2007 period. The measure of inflation that the Fed now has for its formal inflation target (headline PCE) averaged 2.0% over this period. In January headline CPI and PCE inflation remained some way below normal levels, but this largely a reflection of declines in energy prices. Measures which exclude the most volatile components of consumer prices are already at, or close to, normal levels. From low levels, market based measures of inflation expectations have also risen in the past few weeks.
Give Them an Inch, and They Will Take a Mile
Last week’s Federal Open Market Committee meeting coincided with both a press conference, and an updated summary of economic projections. It gave participants of the Federal Reserve Board their first opportunity to record, formally, how recent financial market gyrations have shaped their views about the economic outlook.

Having witnessed the equity market sell off that took place through January and into February, and having digested the Minutes of the January FOMC meeting, a downward revision to the level of the fed funds rate seen as appropriate for the end of this year appeared almost inevitable. In that respect, the Committee did not disappoint. Back in December 2015, the median projection was consistent with four 25 basis point increases in the policy rate through this year. By March 2016, only two were penciled in.
Whether it is because investors sensed an even more dovish tone at the accompanying press conference, or whether it is because there is now a growing belief that the FOMC will always under-deliver relative to its published guidance, the short-end of the US dollar curve has flattened still further. By close of business Friday, market pricing was consistent with just a single 25 basis point tightening in each of the next three years. Although the FOMC has given ground, in the eyes of investors it has not gone nearly far enough. Give them an inch, and they will take a mile! The gap between the level of the fed funds rate implied by the ‘dots’ curve at the end of the FOMC’s forecast horizon, and that implied by market pricing, is almost as large as it has ever been.
CFTC data shows mostly bullish dynamic. Despite that price slightly decreased, data shows growth as in net long position as in open interest. Right now as gold market as AUD turn to reasonable retracement.

Technicals
Monthly
Situation on monthly chart has not changed significantly. Although we've discussed this major support long-time ago, in Autumn 2015, market still stands here. In fact, March is the first month when AUD finally turns to upside reaction and shows respect to major support level. Trend has turned bullish.
In March AUD has moved above Yearly Pivot. Next logical long-term destination is YPR1 around 0.81 that also coincides with monthly overbought. As market has completed huge all-time AB=CD pattern, and now has shown retracement back to major 5/8 Fib support - whether market will return back to upside action is a rhetoric question. This is too long perspective. At the same time as market already was at 1.10, why it could not be at 1.16 1.618 Fib extension of all-time AB-CD pattern. Right now is tough time, situation changes rapidly, so we can't exclude any scenario. Besides, I've heard some opinions on perspectives of gold market and analysts do not exclude 2000-2500$ area. As AUD will follow gold, 1.10-1.16 doesn't seem as impossible.
Another pattern that we have here is DRPO "Buy" Look-alike (LAL). I call it LAL because thrust has a pause
in the middle of it. But this DiNapoli pattern also points on the same 0.81 area - 50% Fib level that coincides with YPR1 and overbought.
Right now AUD stands in reaction to YPP. First attempt of breakout has failed, but there some objective reasons to that, as we will see on other time frames.

Weekly
This chart is very informative and full of different patterns - as short-term as long term.
Here trend also is bullish. Those of you guys, who follows our analysis should remember that initially we've thought about butterfly here. Most recent drop was really fast on AUD, but price has not quite reached 1.27 extension and right now it mostly reminds double bottom pattern.
Appearing of W&R right at the second bottom another bullish sign and it is very typical for Double Bottom. This is also good sign for monthly DRPO "Buy" pattern.
On a way up initially market has broken very strong resistance - neckline, Yearly Pivot and all these stuff around weekly overbought. On a way up AUD also has passed through MPR1. This tells on appearing of new bull trend here and points that this is not just retracement up in a bear trend. I even drop out MPP here, since all of them have been broken up already.
Following this logic nearest target should stand around 0.7850 area - important Fib resistance and double bottom target. Usually it equals the depth of double bottom itself, counted up from neckline. Current upside action looks important especially after strong drop in January.
MACD shows triple bullish divergence right at monthly major Fib support.
If we will take a look at broader picture - may be we will get reverse H&S pattern, although head is a bit overextended beyond 1.618 extension. We'll see... But the same 0.7850 is the neckline.
Still major problem right now is how to take long position, since market stands at weekly overbought and it would be better to wait for some retracement down. Our major task is to catch right moment for long entry here. Based on weekly chart it is logical to get re-testing of neckline.

Daily
Daily picture shows two important things. Trend has turned bearish here. On a way up market not just has hit weekly overbought but it also has completed 1.618 AB-CD extension pattern and now stands at reasonable retracement down.
As short-term upside target has been hit - AUD has no reasons for W&R right now and a kind of fake spikes. It means that if somehow AUD will turn up again and move above recent top - it probably will mean real upside continuation to our next target - 0.7850 area.
A the same time, as overbought stands on weekly chart, continuation of retracement looks more probable. Minimum level that market could reach is 0.7450 Fib support and daily oversold as well. But usually weekly overbought pushes market to deeper Fib levels. That's why our favorite one is daily K-support area 0.7316-0.7335 that is also neckline of weekly Double Bottom pattern.
Thus, we carefully should watch for any patterns or Fib extensions on intraday charts that could confirm this area.

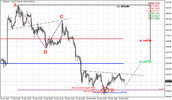
4-hour
Here is, guys, one of possible scenarios, how it could turn. On 4-hour chart we could get H&S pattern that is logical, since weekly overbought assumes deeper retracement. First destination with this H&S is neckline, but it coincides with our 1st daily Fib level of 0.7440, oversold and WPS1. Thus upside bounce definitely should happen and this will lead to appearing of right shoulder.
After right shoulder will be completed - downward AB-CD action will lead us precisely to daily K-area and weekly double bottom neckline:

But, as we've said above - if market will change the shape of this pattern or unexpectedly will continue move up - it will mean that AUD just continues to next 0.7850 target, although currently this continuation is not logical yet.
Hourly
This picture just confirms that market should reach neckline very soon. Aussie already has moved below 1.0 AB-CD target. Hence, next logical destination is 1.618 and it stands precisely at daily Fib support and neckline of our H&S pattern. I like such kind of Agreements. They give us confidence with patterns that we discuss:

At the same time, market could form butterfly or small H&S to trigger upside action - out of neckline to create the shoulder.
Conclusion:
That's being said, if Australian Central Bank will not change it's policy drastically and will not be involved strongly in currency war - Australia could get significant advantages from healthy interest rates, relation to gold mining industry, sufficient economy and one of financial centers of Asia region. Thus currently we have a positive view on AUD.
In short-term we watch when retracement down will be over. Probably it should take 1-2 weeks. Our primary area to watch for is 0.7330 support on daily chart.
The technical portion of Sive's analysis owes a great deal to Joe DiNapoli's methods, and uses a number of Joe's proprietary indicators. Please note that Sive's analysis is his own view of the market and is not endorsed by Joe DiNapoli or any related companies.
Today we will not speak on gold, since market was closed on Friday and we mostly have discussed all issues there. So, I've decided to prepare weekly research on gold-related currency - AUD.
In the beginning of the research - comments on US Fed rate from Fanthom consulting:
US Inflation On The Rise
Headline US inflation has been below the Fed’s target since April 2012, and significantly so since the sharp falls in commodities prices. Market based measures of inflation expectations have fallen too. However, both inflation expectations and actual inflation data have turned upwards recently and on most measures inflation is already close to ‘normal’ levels.
Our chart shows how different measures of US inflation compare to their average over the 1998-2007 period. The measure of inflation that the Fed now has for its formal inflation target (headline PCE) averaged 2.0% over this period. In January headline CPI and PCE inflation remained some way below normal levels, but this largely a reflection of declines in energy prices. Measures which exclude the most volatile components of consumer prices are already at, or close to, normal levels. From low levels, market based measures of inflation expectations have also risen in the past few weeks.
Give Them an Inch, and They Will Take a Mile
Last week’s Federal Open Market Committee meeting coincided with both a press conference, and an updated summary of economic projections. It gave participants of the Federal Reserve Board their first opportunity to record, formally, how recent financial market gyrations have shaped their views about the economic outlook.
Having witnessed the equity market sell off that took place through January and into February, and having digested the Minutes of the January FOMC meeting, a downward revision to the level of the fed funds rate seen as appropriate for the end of this year appeared almost inevitable. In that respect, the Committee did not disappoint. Back in December 2015, the median projection was consistent with four 25 basis point increases in the policy rate through this year. By March 2016, only two were penciled in.
Whether it is because investors sensed an even more dovish tone at the accompanying press conference, or whether it is because there is now a growing belief that the FOMC will always under-deliver relative to its published guidance, the short-end of the US dollar curve has flattened still further. By close of business Friday, market pricing was consistent with just a single 25 basis point tightening in each of the next three years. Although the FOMC has given ground, in the eyes of investors it has not gone nearly far enough. Give them an inch, and they will take a mile! The gap between the level of the fed funds rate implied by the ‘dots’ curve at the end of the FOMC’s forecast horizon, and that implied by market pricing, is almost as large as it has ever been.
CFTC data shows mostly bullish dynamic. Despite that price slightly decreased, data shows growth as in net long position as in open interest. Right now as gold market as AUD turn to reasonable retracement.
Technicals
Monthly
Situation on monthly chart has not changed significantly. Although we've discussed this major support long-time ago, in Autumn 2015, market still stands here. In fact, March is the first month when AUD finally turns to upside reaction and shows respect to major support level. Trend has turned bullish.
In March AUD has moved above Yearly Pivot. Next logical long-term destination is YPR1 around 0.81 that also coincides with monthly overbought. As market has completed huge all-time AB=CD pattern, and now has shown retracement back to major 5/8 Fib support - whether market will return back to upside action is a rhetoric question. This is too long perspective. At the same time as market already was at 1.10, why it could not be at 1.16 1.618 Fib extension of all-time AB-CD pattern. Right now is tough time, situation changes rapidly, so we can't exclude any scenario. Besides, I've heard some opinions on perspectives of gold market and analysts do not exclude 2000-2500$ area. As AUD will follow gold, 1.10-1.16 doesn't seem as impossible.
Another pattern that we have here is DRPO "Buy" Look-alike (LAL). I call it LAL because thrust has a pause
in the middle of it. But this DiNapoli pattern also points on the same 0.81 area - 50% Fib level that coincides with YPR1 and overbought.
Right now AUD stands in reaction to YPP. First attempt of breakout has failed, but there some objective reasons to that, as we will see on other time frames.
Weekly
This chart is very informative and full of different patterns - as short-term as long term.
Here trend also is bullish. Those of you guys, who follows our analysis should remember that initially we've thought about butterfly here. Most recent drop was really fast on AUD, but price has not quite reached 1.27 extension and right now it mostly reminds double bottom pattern.
Appearing of W&R right at the second bottom another bullish sign and it is very typical for Double Bottom. This is also good sign for monthly DRPO "Buy" pattern.
On a way up initially market has broken very strong resistance - neckline, Yearly Pivot and all these stuff around weekly overbought. On a way up AUD also has passed through MPR1. This tells on appearing of new bull trend here and points that this is not just retracement up in a bear trend. I even drop out MPP here, since all of them have been broken up already.
Following this logic nearest target should stand around 0.7850 area - important Fib resistance and double bottom target. Usually it equals the depth of double bottom itself, counted up from neckline. Current upside action looks important especially after strong drop in January.
MACD shows triple bullish divergence right at monthly major Fib support.
If we will take a look at broader picture - may be we will get reverse H&S pattern, although head is a bit overextended beyond 1.618 extension. We'll see... But the same 0.7850 is the neckline.
Still major problem right now is how to take long position, since market stands at weekly overbought and it would be better to wait for some retracement down. Our major task is to catch right moment for long entry here. Based on weekly chart it is logical to get re-testing of neckline.
Daily
Daily picture shows two important things. Trend has turned bearish here. On a way up market not just has hit weekly overbought but it also has completed 1.618 AB-CD extension pattern and now stands at reasonable retracement down.
As short-term upside target has been hit - AUD has no reasons for W&R right now and a kind of fake spikes. It means that if somehow AUD will turn up again and move above recent top - it probably will mean real upside continuation to our next target - 0.7850 area.
A the same time, as overbought stands on weekly chart, continuation of retracement looks more probable. Minimum level that market could reach is 0.7450 Fib support and daily oversold as well. But usually weekly overbought pushes market to deeper Fib levels. That's why our favorite one is daily K-support area 0.7316-0.7335 that is also neckline of weekly Double Bottom pattern.
Thus, we carefully should watch for any patterns or Fib extensions on intraday charts that could confirm this area.
4-hour
Here is, guys, one of possible scenarios, how it could turn. On 4-hour chart we could get H&S pattern that is logical, since weekly overbought assumes deeper retracement. First destination with this H&S is neckline, but it coincides with our 1st daily Fib level of 0.7440, oversold and WPS1. Thus upside bounce definitely should happen and this will lead to appearing of right shoulder.
After right shoulder will be completed - downward AB-CD action will lead us precisely to daily K-area and weekly double bottom neckline:
But, as we've said above - if market will change the shape of this pattern or unexpectedly will continue move up - it will mean that AUD just continues to next 0.7850 target, although currently this continuation is not logical yet.
Hourly
This picture just confirms that market should reach neckline very soon. Aussie already has moved below 1.0 AB-CD target. Hence, next logical destination is 1.618 and it stands precisely at daily Fib support and neckline of our H&S pattern. I like such kind of Agreements. They give us confidence with patterns that we discuss:
At the same time, market could form butterfly or small H&S to trigger upside action - out of neckline to create the shoulder.
Conclusion:
That's being said, if Australian Central Bank will not change it's policy drastically and will not be involved strongly in currency war - Australia could get significant advantages from healthy interest rates, relation to gold mining industry, sufficient economy and one of financial centers of Asia region. Thus currently we have a positive view on AUD.
In short-term we watch when retracement down will be over. Probably it should take 1-2 weeks. Our primary area to watch for is 0.7330 support on daily chart.
The technical portion of Sive's analysis owes a great deal to Joe DiNapoli's methods, and uses a number of Joe's proprietary indicators. Please note that Sive's analysis is his own view of the market and is not endorsed by Joe DiNapoli or any related companies.
")