Sive Morten
Special Consultant to the FPA
- Messages
- 18,659
Good morning,
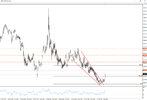
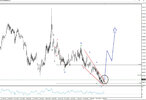
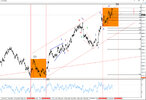
Gold keeps long term bullish trend but seems a bit overbought tactically. We consider downside pullback now, based on intraday H&S pattern and watch for 1955$ area as potential target within 1-2 weeks:
Gold keeps long term bullish trend but seems a bit overbought tactically. We consider downside pullback now, based on intraday H&S pattern and watch for 1955$ area as potential target within 1-2 weeks:


")