Sive Morten
Special Consultant to the FPA
- Messages
- 18,621
Fundamentals
As we've mentioned yesterday, providing FX Report - significant change in short-term sentiment has happened this week. The common view now is turning to idea that inflationary risks were overestimated and, in fact, they now stand lower than it was initially suggested. Current market performance mostly stands due economy recovery but not inflation rising. This explains why stock market is growing together with interest rates. Besides, recent statistics has confirmed again, that global economy is just starting long-term recovery stage. All these moments were supportive to the gold market.
Market overview
The dollar slumped to an almost two-week low versus a basket of rival currencies, while U.S. Treasury yields also fell as investors paused recent selling of government bonds. Weaker Treasury yields translate into a lower opportunity cost for holding bullion, which pays no return. But, data showing that a measure of U.S. services industry activity surged to a record high in March dimmed gold's safe-haven appeal.
U.S. Treasury Secretary Janet Yellen said on Monday that she is working with G20 countries to agree on a global corporate minimum tax rate. U.S. President Joe Biden on Monday defended his proposal to raise corporate taxes to help pay for his infrastructure spending plans, saying he was not worried the hike would harm the economy and that there was no evidence it would drive business abroad. The Federal Reserve should stick to its easy monetary policy to help support growth further, Cleveland Federal Reserve Bank President Loretta Mester said on Monday.
Gold has been lifted temporarily by a steady decline in the dollar index and lower Treasury yields, said Phillip Streible, chief market strategist at Blue Line Futures in Chicago.
"The rally is not necessarily sustainable... $1,750 I believe is a resistance point," Streible said.
"Investors believe that we are not going to see another huge run-up in the yields and that has prompted gold to technically rebound," said Bart Melek, head of commodity strategies at TD Securities.
The S&P 500 hit a record high for the fourth straight session on Tuesday on renewed recovery hopes, while data showed U.S. job openings increased more than expected in February.
Cleveland Fed Bank President Loretta Mester on Monday said the U.S. economic outlook is brightening, though the U.S. central bank should stick to its easy policy to support growth further.
"The better-than-expected economic data from the United States is not allowing gold prices to go above a certain level," said Sunilkumar Katke, head of currencies and commodities at Axis Securities. Once gold touches the $1,750 resistance level, technical longs will be initiated and that might push prices up to $1,780," Katke added.
In the latest round of robust economic data, work opportunities in the United States reached a two-year peak in February, as hiring grew in response to rising domestic demand, increased COVID-19 vaccinations, and additional government pandemic assistance. The International Monetary Fund also raised its outlook for
global economic growth, forecasting worldwide output would rise 6% this year. Gold was also pressured as Asian shares climbed to three-week highs, reducing investors' appetite for bullion.
"If we get continued strength in economic reports I think we are going to see much greater likelihood of interest rates increasing ... yields increasing. That ultimately is going to have negative impact on gold," said Jeffrey Sica, founder of Circle Squared Alternative Investments.
Bullion prices rose to their highest level since March 25 at $1,745.15 on Tuesday, as U.S. Treasury yields eased and the dollar fell to a two-week low against a basket of currencies.
"Softening of the yields points towards a situation where central banks around the globe will remain dovish and that will support gold at least in the medium term," said Stephen Innes, chief global market strategist at financial services firm Axi.
Gold scaled a three-week peak on Thursday after minutes from the Federal Reserve's latest policy meeting reassured investors that interest rates will remain low
for some time, pushing the dollar and U.S. yields lower.
"The Federal Open Market Committee (FOMC) are clearly committed to maintaining a very dovish policy, which has helped put some downward pressure on the dollar and yields and is helping gold," said independent analyst Ross Norman. "It's quite clear that the Fed feels that the unemployment situation is still difficult, and they will resist any temptations to edge rates higher in the interim."
Fed policymakers remain wary about the ongoing risks of the coronavirus pandemic and are eager to reach employment and inflation goals, minutes of the U.S. central bank's latest policy meeting showed on Wednesday. However, despite the Fed's assurance, expectations of a sooner than expected rate hike were making rounds.
"Investors are expecting the Fed will have to hike interest rates as early as January 2022 as it becomes a huge task once inflation starts going out of control," said Michael McCarthy, chief market strategist at CMC Markets.
The European Central Bank policymakers discussed a smaller rise in bond purchases, according to meeting accounts. U.S. Treasury Secretary Janet Yellen on Thursday
encouraged major economies to add substantial new fiscal stimulus to ensure a robust recovery.
Data out of China showed factory-gate prices rose at their fastest annual pace since July 2018 in March, while the producer price index (PPI) rose 4.4%. U.S. PPI data
However, Federal Reserve Chair Jerome Powell on Thursday reiterated that higher inflation numbers that would require the Fed to react with rate hikes were unlikely.
"Gold's retreat from last year's peak is a 'mini-correction' in a longer bull market," said Davis Hall, head of capital markets in Asia at Indosuez wealth management.
A lot of that speculative froth has been withdrawn as bitcoin picked up the baton... (but) as long as real yields remain flat to negative, gold has that underlying long-term support."
Precious metal funds continued to witness outflows due to a fall in gold prices. Gold fell 11% in the first quarter of this year, marking its worst start to the year since 1982.

"While overall, gold market is bullish short-term, with expectations of a break higher through $1,760-65, caution about fresh 10- and 30-year (Treasury) auctions and the CPI report next week are keeping yields supported, keeping gold's advance in check," said Tai Wong, head of base and precious metals derivatives trading at BMO.
Yields are driving most markets at (the) moment, directly impacting USD and stocks and all three matter to gold with varying impact."
U.S. producer prices increased more than expected in March, resulting in the largest annual gain in 9-1/2 years, fitting with expectations for higher inflation as the economy reopens.
COT Report
Recent CFTC data shows that change in sentiment finds the way into statistics of open positions. Just last week we've talked about strong closing of long positions and drop in open interest - this week everything has turned from top to bottom. Net long position jumps:

Source: cftc.gov
Charting by Investing.com
Although open interest has not recovered back, but net speculative position jumps back for 30K contracts and it confirms short-term bullish sentiment on the market:

So, the change of the sentiment has happened not only on gold market, but on Dollar Index and FX market as well. Fed keeps its position like a rock and this provides confidence, inspires investors who suggest that it is not an inflationary pressure yet. The central Fed's view is "interest rates jump should be temporal in this year". And they keep this view no matter what happens. Statistics also shows mixed data from time to time. Recent Dollar Index rally and interest rates jump are confused many investors, because it was widely expected a bit later. Actually, this was and is our view as well - recall our DXY 87.40 target. By our view major reversal should happen after it will be reached.
And now it seems that everything turns to its own, as it should be. Interest rates rally takes a breath, inflation statistics doesn't show yet fast acceleration, while market and consumer sentiment improves. This makes us think that economy stands in a first stage of bullish cycle that calls as "non-inflationary growth". During this stage gold could feel itself well. While next stage is "inflationary growth" and this should be radical shift on many markets. So we could say that this stage is last part of gold's bullish cycle.
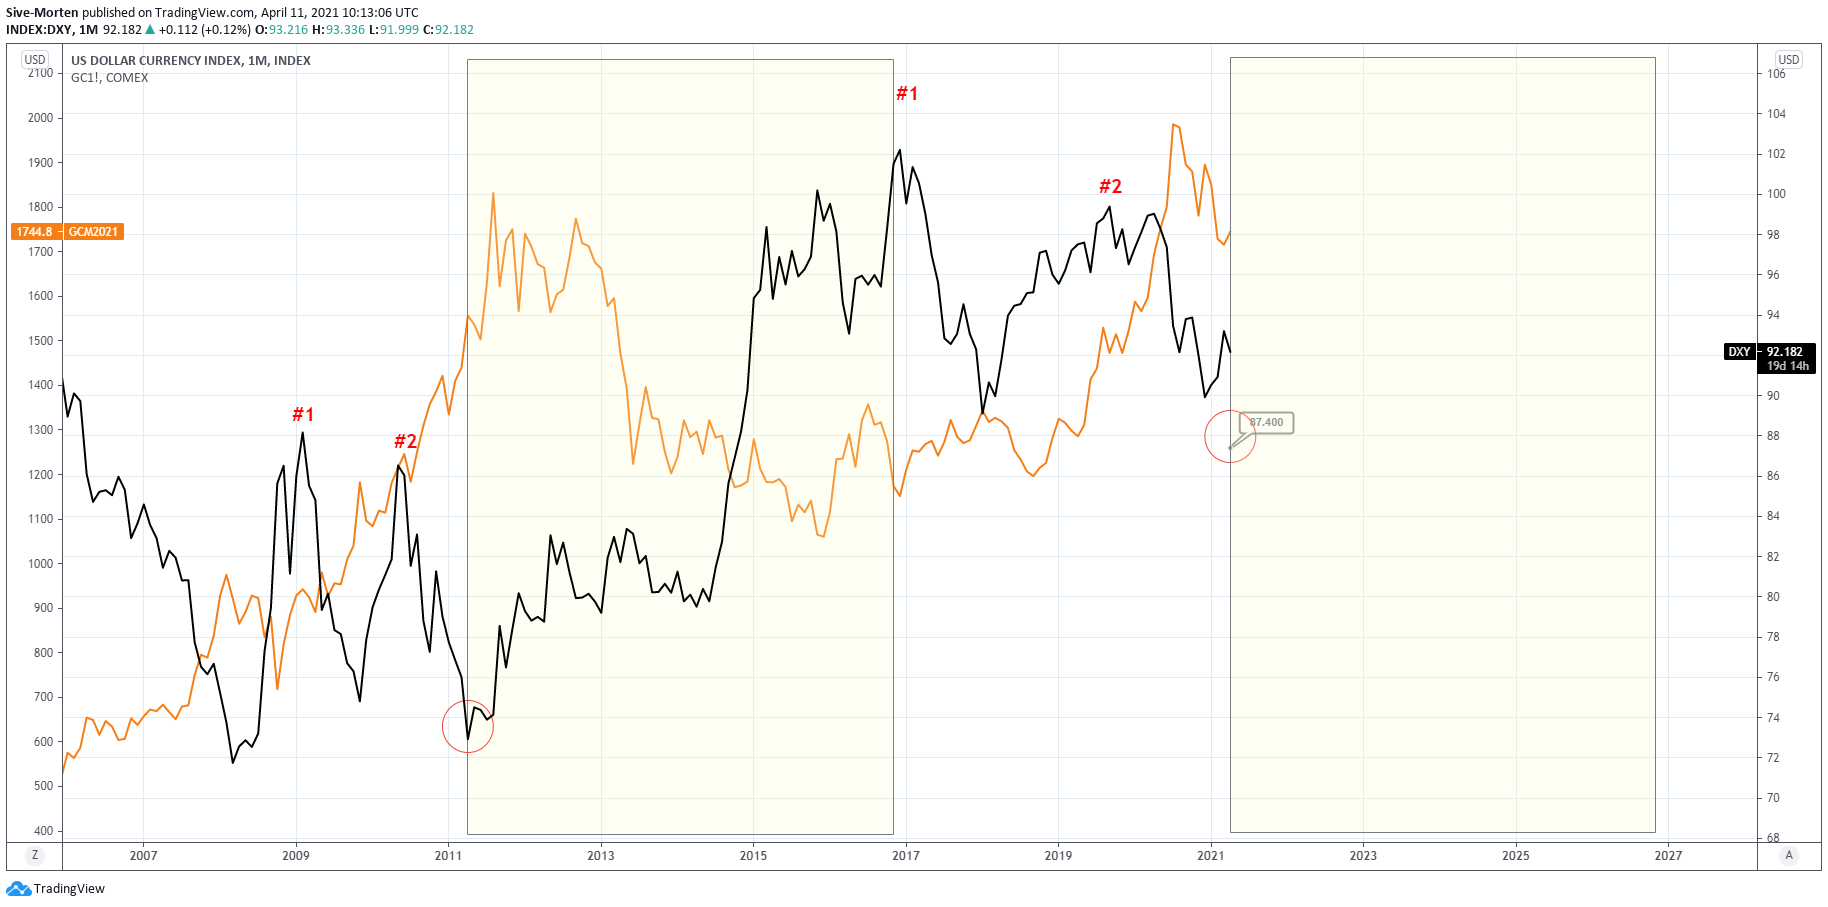
Because despite that analysts point on "too early" interest rates rally, the same analysts talk about 4-6 months perspective things to happen. As it is widely expected right now - Fed should act faster as inflation evidence should come earlier than they suggest. Here is actually what we have on long-term gold chart in relation to dollar index. In 2011 we had the same technical situation - downside AB=CD retracement on Dollar index at the eve of new economy bullish cycle that calls "Dollar Smile". Gold was feeling well through the whole AB-CD retracement, and starts dropping after the major point of upside reversal been in place.
Here we have the same - #1 AB leg stands in place and #2 - CD is coming to 87.40 target. By our view this should become turning point. Hence, gold should turn down as well for few years. Current upward action is mostly retracement or, better to say - last upside effort. So, it could go up, maybe rather far within 2-3 months while "non-inflationary" stage lasts, but hardly we will see the new top.
Technicals
Monthly
In recent two months gold shows very low activity and stands in tight range. April right now is just inside action to March. Context on monthly chart remains bearish due multiple factors - MACD trend stands bearish, price is below YPP and downside action shows acceleration on CD leg. Still, as price shows the first touch of strong support area - we're in tactical bounce environment. As we've said gold keeps ability of propriate reaction on meaningful technical conditions by far, such as strong K-areas on long-term charts. And in general we could pretend on stronger reaction from the level of such scale.
Besides, although 10-year interest rates climb to 1.75% area - this is the first upside action after long-term downside tendency and technically, after first bounce we always get deep retracement because of existed bearish momentum. Thus, particular this deep retracement should become a catalysis of gold stronger upside action.
Almost in the same area, around 1655$ we have an OP target of monthly AB-CD pattern that has not been hit yet. But it is rather tricky situation with this OP. The point is - upside action could last 2-3 months and it is very short time period. Hardly it is possible to hit OP and then to show solid upside bounce together. This is just 2-3 candles on this chart. Thus, maybe OP will be reached after pullback. Alternatively, it might happen by some extraordinary situation when gold dives and returns right back up.

Weekly
Upside reaction on support and oversold area so weak that discourage any long entry. If we would have the same picture on lower time scale, I would say "wait for OP" as reaction doesn't match the scale of support area, it is too weak. One of the reasons could be that reaction on support area has not started yet.
In current situation we have to call for patience and wait for more transparent background. Current price action looks suspicious. Those who do not want to wait - have to care on OP target anyway and place stop order below it. Because reaching of OP doesn't mean the breakout of K-area and failure of the retracement scenario. Very often with major OP's just below the K-areas market could form short-term spike to hit it. And every time when we see this, we have to take it in consideration. For conservative approach it would be better to consider long entry only when OP will be reached.

Daily
Despite that we have some upside action, but I can't shake off bearish thoughts. MACD trend seems stand bullish, but as market spends more time in sideways action - it starts to remind bearish dynamic pressure. Market for the 2nd time tests nearest 3/8 Fib level. Despite that some bullish activity stands here, as gold is forming rectangle shape, it would be better to consider long entry as closer to the lower border as possible. Besides, in this case we could place stop, including lower standing 1650 target.

Intraday
As upside OP has been reached, on Friday we've discussed Agreement resistance and "222" Sell pattern that should trigger downside reaction to 1723 level at least. Now we could see that minimum target mostly is done. But, as situation on gold market stands vulnerable, we do not exclude downside continuation:

For instance, on 1H chart market is forming H&S pattern, with bearish grabbers around the right arm's top:

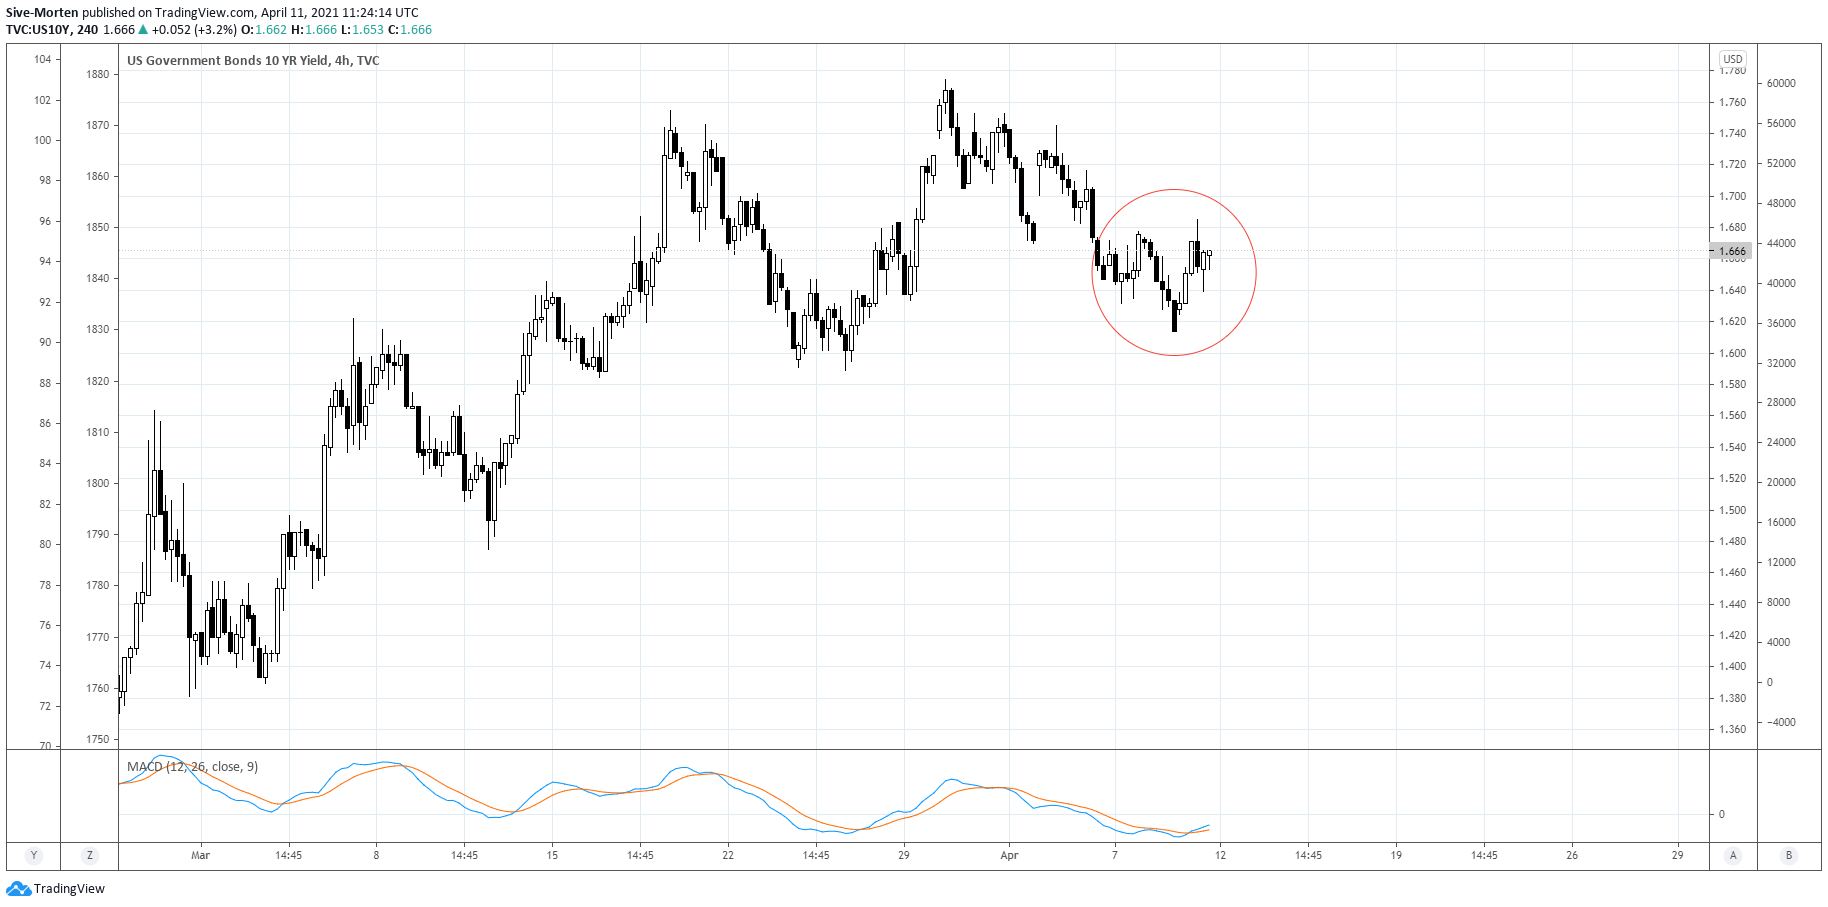
Approximately the same shape we could see on 10- year yields 4H chart, suggesting stronger upside action that should make pressure on gold prices.
Thus, speaking in general - we do not like idea of long entry on daily/weekly chart until 1650 target will be hit. Price performance there looks weak and doesn't match to degree of support level. Usually upside reaction on so strong support levels looks different. Still, we could accept taking long position as closer to the bottom of daily rectangle as possible, when stop order includes scenario of possible drop to 1650$.
For intraday traders - it is possible to rely on H&S pattern with parallel monitoring of 10-year yield. While H&S stands - gold could drop further forming AB-CD shape down. If H&S fails and market returns back to the top - upward action could continue. In this case - it could lead to more serious consequences, as daily rectangle and Fib level will be broken as well and we could start to talk about 1830-1850$ destination point.
As we've mentioned yesterday, providing FX Report - significant change in short-term sentiment has happened this week. The common view now is turning to idea that inflationary risks were overestimated and, in fact, they now stand lower than it was initially suggested. Current market performance mostly stands due economy recovery but not inflation rising. This explains why stock market is growing together with interest rates. Besides, recent statistics has confirmed again, that global economy is just starting long-term recovery stage. All these moments were supportive to the gold market.
Market overview
The dollar slumped to an almost two-week low versus a basket of rival currencies, while U.S. Treasury yields also fell as investors paused recent selling of government bonds. Weaker Treasury yields translate into a lower opportunity cost for holding bullion, which pays no return. But, data showing that a measure of U.S. services industry activity surged to a record high in March dimmed gold's safe-haven appeal.
U.S. Treasury Secretary Janet Yellen said on Monday that she is working with G20 countries to agree on a global corporate minimum tax rate. U.S. President Joe Biden on Monday defended his proposal to raise corporate taxes to help pay for his infrastructure spending plans, saying he was not worried the hike would harm the economy and that there was no evidence it would drive business abroad. The Federal Reserve should stick to its easy monetary policy to help support growth further, Cleveland Federal Reserve Bank President Loretta Mester said on Monday.
Gold has been lifted temporarily by a steady decline in the dollar index and lower Treasury yields, said Phillip Streible, chief market strategist at Blue Line Futures in Chicago.
"The rally is not necessarily sustainable... $1,750 I believe is a resistance point," Streible said.
"Investors believe that we are not going to see another huge run-up in the yields and that has prompted gold to technically rebound," said Bart Melek, head of commodity strategies at TD Securities.
The S&P 500 hit a record high for the fourth straight session on Tuesday on renewed recovery hopes, while data showed U.S. job openings increased more than expected in February.
Cleveland Fed Bank President Loretta Mester on Monday said the U.S. economic outlook is brightening, though the U.S. central bank should stick to its easy policy to support growth further.
"The better-than-expected economic data from the United States is not allowing gold prices to go above a certain level," said Sunilkumar Katke, head of currencies and commodities at Axis Securities. Once gold touches the $1,750 resistance level, technical longs will be initiated and that might push prices up to $1,780," Katke added.
In the latest round of robust economic data, work opportunities in the United States reached a two-year peak in February, as hiring grew in response to rising domestic demand, increased COVID-19 vaccinations, and additional government pandemic assistance. The International Monetary Fund also raised its outlook for
global economic growth, forecasting worldwide output would rise 6% this year. Gold was also pressured as Asian shares climbed to three-week highs, reducing investors' appetite for bullion.
"If we get continued strength in economic reports I think we are going to see much greater likelihood of interest rates increasing ... yields increasing. That ultimately is going to have negative impact on gold," said Jeffrey Sica, founder of Circle Squared Alternative Investments.
Bullion prices rose to their highest level since March 25 at $1,745.15 on Tuesday, as U.S. Treasury yields eased and the dollar fell to a two-week low against a basket of currencies.
"Softening of the yields points towards a situation where central banks around the globe will remain dovish and that will support gold at least in the medium term," said Stephen Innes, chief global market strategist at financial services firm Axi.
Gold scaled a three-week peak on Thursday after minutes from the Federal Reserve's latest policy meeting reassured investors that interest rates will remain low
for some time, pushing the dollar and U.S. yields lower.
"The Federal Open Market Committee (FOMC) are clearly committed to maintaining a very dovish policy, which has helped put some downward pressure on the dollar and yields and is helping gold," said independent analyst Ross Norman. "It's quite clear that the Fed feels that the unemployment situation is still difficult, and they will resist any temptations to edge rates higher in the interim."
Fed policymakers remain wary about the ongoing risks of the coronavirus pandemic and are eager to reach employment and inflation goals, minutes of the U.S. central bank's latest policy meeting showed on Wednesday. However, despite the Fed's assurance, expectations of a sooner than expected rate hike were making rounds.
"Investors are expecting the Fed will have to hike interest rates as early as January 2022 as it becomes a huge task once inflation starts going out of control," said Michael McCarthy, chief market strategist at CMC Markets.
The European Central Bank policymakers discussed a smaller rise in bond purchases, according to meeting accounts. U.S. Treasury Secretary Janet Yellen on Thursday
encouraged major economies to add substantial new fiscal stimulus to ensure a robust recovery.
Data out of China showed factory-gate prices rose at their fastest annual pace since July 2018 in March, while the producer price index (PPI) rose 4.4%. U.S. PPI data
However, Federal Reserve Chair Jerome Powell on Thursday reiterated that higher inflation numbers that would require the Fed to react with rate hikes were unlikely.
"Gold's retreat from last year's peak is a 'mini-correction' in a longer bull market," said Davis Hall, head of capital markets in Asia at Indosuez wealth management.
A lot of that speculative froth has been withdrawn as bitcoin picked up the baton... (but) as long as real yields remain flat to negative, gold has that underlying long-term support."
Precious metal funds continued to witness outflows due to a fall in gold prices. Gold fell 11% in the first quarter of this year, marking its worst start to the year since 1982.
"While overall, gold market is bullish short-term, with expectations of a break higher through $1,760-65, caution about fresh 10- and 30-year (Treasury) auctions and the CPI report next week are keeping yields supported, keeping gold's advance in check," said Tai Wong, head of base and precious metals derivatives trading at BMO.
Yields are driving most markets at (the) moment, directly impacting USD and stocks and all three matter to gold with varying impact."
U.S. producer prices increased more than expected in March, resulting in the largest annual gain in 9-1/2 years, fitting with expectations for higher inflation as the economy reopens.
COT Report
Recent CFTC data shows that change in sentiment finds the way into statistics of open positions. Just last week we've talked about strong closing of long positions and drop in open interest - this week everything has turned from top to bottom. Net long position jumps:
Source: cftc.gov
Charting by Investing.com
Although open interest has not recovered back, but net speculative position jumps back for 30K contracts and it confirms short-term bullish sentiment on the market:
So, the change of the sentiment has happened not only on gold market, but on Dollar Index and FX market as well. Fed keeps its position like a rock and this provides confidence, inspires investors who suggest that it is not an inflationary pressure yet. The central Fed's view is "interest rates jump should be temporal in this year". And they keep this view no matter what happens. Statistics also shows mixed data from time to time. Recent Dollar Index rally and interest rates jump are confused many investors, because it was widely expected a bit later. Actually, this was and is our view as well - recall our DXY 87.40 target. By our view major reversal should happen after it will be reached.
And now it seems that everything turns to its own, as it should be. Interest rates rally takes a breath, inflation statistics doesn't show yet fast acceleration, while market and consumer sentiment improves. This makes us think that economy stands in a first stage of bullish cycle that calls as "non-inflationary growth". During this stage gold could feel itself well. While next stage is "inflationary growth" and this should be radical shift on many markets. So we could say that this stage is last part of gold's bullish cycle.
Because despite that analysts point on "too early" interest rates rally, the same analysts talk about 4-6 months perspective things to happen. As it is widely expected right now - Fed should act faster as inflation evidence should come earlier than they suggest. Here is actually what we have on long-term gold chart in relation to dollar index. In 2011 we had the same technical situation - downside AB=CD retracement on Dollar index at the eve of new economy bullish cycle that calls "Dollar Smile". Gold was feeling well through the whole AB-CD retracement, and starts dropping after the major point of upside reversal been in place.
Here we have the same - #1 AB leg stands in place and #2 - CD is coming to 87.40 target. By our view this should become turning point. Hence, gold should turn down as well for few years. Current upward action is mostly retracement or, better to say - last upside effort. So, it could go up, maybe rather far within 2-3 months while "non-inflationary" stage lasts, but hardly we will see the new top.
Technicals
Monthly
In recent two months gold shows very low activity and stands in tight range. April right now is just inside action to March. Context on monthly chart remains bearish due multiple factors - MACD trend stands bearish, price is below YPP and downside action shows acceleration on CD leg. Still, as price shows the first touch of strong support area - we're in tactical bounce environment. As we've said gold keeps ability of propriate reaction on meaningful technical conditions by far, such as strong K-areas on long-term charts. And in general we could pretend on stronger reaction from the level of such scale.
Besides, although 10-year interest rates climb to 1.75% area - this is the first upside action after long-term downside tendency and technically, after first bounce we always get deep retracement because of existed bearish momentum. Thus, particular this deep retracement should become a catalysis of gold stronger upside action.
Almost in the same area, around 1655$ we have an OP target of monthly AB-CD pattern that has not been hit yet. But it is rather tricky situation with this OP. The point is - upside action could last 2-3 months and it is very short time period. Hardly it is possible to hit OP and then to show solid upside bounce together. This is just 2-3 candles on this chart. Thus, maybe OP will be reached after pullback. Alternatively, it might happen by some extraordinary situation when gold dives and returns right back up.
Weekly
Upside reaction on support and oversold area so weak that discourage any long entry. If we would have the same picture on lower time scale, I would say "wait for OP" as reaction doesn't match the scale of support area, it is too weak. One of the reasons could be that reaction on support area has not started yet.
In current situation we have to call for patience and wait for more transparent background. Current price action looks suspicious. Those who do not want to wait - have to care on OP target anyway and place stop order below it. Because reaching of OP doesn't mean the breakout of K-area and failure of the retracement scenario. Very often with major OP's just below the K-areas market could form short-term spike to hit it. And every time when we see this, we have to take it in consideration. For conservative approach it would be better to consider long entry only when OP will be reached.
Daily
Despite that we have some upside action, but I can't shake off bearish thoughts. MACD trend seems stand bullish, but as market spends more time in sideways action - it starts to remind bearish dynamic pressure. Market for the 2nd time tests nearest 3/8 Fib level. Despite that some bullish activity stands here, as gold is forming rectangle shape, it would be better to consider long entry as closer to the lower border as possible. Besides, in this case we could place stop, including lower standing 1650 target.
Intraday
As upside OP has been reached, on Friday we've discussed Agreement resistance and "222" Sell pattern that should trigger downside reaction to 1723 level at least. Now we could see that minimum target mostly is done. But, as situation on gold market stands vulnerable, we do not exclude downside continuation:
For instance, on 1H chart market is forming H&S pattern, with bearish grabbers around the right arm's top:
Approximately the same shape we could see on 10- year yields 4H chart, suggesting stronger upside action that should make pressure on gold prices.
Thus, speaking in general - we do not like idea of long entry on daily/weekly chart until 1650 target will be hit. Price performance there looks weak and doesn't match to degree of support level. Usually upside reaction on so strong support levels looks different. Still, we could accept taking long position as closer to the bottom of daily rectangle as possible, when stop order includes scenario of possible drop to 1650$.
For intraday traders - it is possible to rely on H&S pattern with parallel monitoring of 10-year yield. While H&S stands - gold could drop further forming AB-CD shape down. If H&S fails and market returns back to the top - upward action could continue. In this case - it could lead to more serious consequences, as daily rectangle and Fib level will be broken as well and we could start to talk about 1830-1850$ destination point.


")