Sive Morten
Special Consultant to the FPA
- Messages
- 18,651
Fundamentals
Last week we haven't got any gold-specific news. It was relatively calm week and price mostly was driven by statistics. Mostly, the drop of Retail Sales and poor Michigan Manufacturing numbers have supported gold. On political arena still, there were few interesting moments. Other cornerstone question for the Gold market is Fed's policy and we've dedicated FX report to this subject yesterday. Recent data brings us interesting conclusions that mostly look supportive for the gold market in long term.
First, is - significant drop in inflation, (especially in China), mostly in PPI and simultaneous big drop of global production and manufacturing tells that we're entering degradation of global economy, if you want - call it as recession. But at the same time, with absolutely different situation compares to previous crisis, even to 2008 - hardly it puts inflation down. Don't be surprised, but California could become an epicenter of recession. Using some indirect indicators, in the first week of April, the number of shipped containers at the Port of Los Angeles fell sharply to an anti-record since March 2020, the time the pandemic began. Bloomberg connects this incl. with mass layoffs at technology companies and the Silicon Valley Bank crisis.
Although things are a little better on the east coast of the States (but still with negative dynamics), and Europe is still on a recovery trend, the recession risks becoming global , especially considering that the center of the world-system was just in California. China, which is the main supplier of goods to the US, has already recorded an 8% decrease in trucks on the roads and a 5% decrease in loading in ports in April. Don't forget that in China we see strong deflationary processes, mentioned yesterday. By our view they indicate slowdown of economy. Additionally, big collapse of semiconductor global demand (more than for 20% in a year) is an evident confirmation of global slowdown.
Concerning California - it seems it is also becoming a center of commercial real estate collapse and defaults. Blackstone bought a Class A office property in 2014 for $129 million: two 13-story buildings in Southern California. Blackstone sold both buildings a few days ago for $89 million - a 36% discount. What the hell is in class B, C and D markets? This is nominal prices, without adjustment on inflation etc. Rent demand, especially with big business centres stands low, huge squares are empty (record ~29.4% have not seen before). But owners have to pay taxes, utility services and keep other constant expenses. And they can't sell it because price has dropped. Most of this buildings are backed in banks as collateral for loans purposes. Big nested doll...
Another example from California - The WeWork and Rhone Group-created venture defaulted on a $240 million loan to build an office tower that includes WeWork's coworking space as an anchor tenant in San Francisco's financial district: "More office landlords are defaulting given higher rates."
And it seems that EU should standby as Fears mount that Europe’s commercial real estate sector could be the next to fall
Other indirect signs point on wealth decrease among rich EU countries. The Netherlands has joined its humble German neighbors in calling for tough debt-reduction targets as the EU overhauls public finance rules.
We're closer to idea that we have temporal decrease, downside swing on a upward inflation spiral. Now we have decrease from 10.5% to 5.6%, next one will be 15% then 8-9% decrease and so on... The same way as bullish trend on a market develops - "two step forward, one step back". Additionally we've investigated a lot of tactical issues that make Fed's life very difficult in nearest 3-4 months. Keep it short, they need big bulk of liquidity that is nowhere to get. The only way is to start again debt monetization. And all this stuff will be on a background of high interest rates. We suggest that market is wrong with expectation of "last 25 points spike" in May. We expect 25 points change in June and maybe even on later meetings as well, especially if inflation will turn up again. This might be big punch on investors' mind in June, leading to drastic shifts in direction of stock and currency markets, when investors' expectations will be missed.
As larger uncertainty is, as better for the gold market. Despite what Fed will do, if we're correct on inflation direction, real rates remain negative and could become even more negative, providing support for the gold market. Besides, it seems that as farer we're going as less confident Fed becomes. At least, people start loosing faith to regulator, and last jump in 1-year inflation expectations proves it.
U.S. March Wage Growth hints that Fed models can Be thrown to trash:

On external stage, global political arena situation is also difficult. D. Trump recently has given good assessment probably, saying - Our economy is collapsing. Inflation is out of control. Russia teamed up with China, it's unthinkable. Saudi Arabia, a great nation, teamed up with China, Russia, Iran, North Korea. Our currency is collapsing and will soon cease to be the world standard, which will be our greatest defeat in 200 years."We are a crumbling nation. We are a nation in decline.
Gold hit a 13-month high about $30 shy of a record peak and the dollar weakened after the data reduced expectations that the Fed will raise rates in May, a major market concern as monetary policy that is too tight can provoke a U.S. recession.
As P. Schiff writes - The Federal Reserve is in a bad situation. It needs to cut rates as soon as possible before the economy comes crashing down around its ears, but even with CPI cooling, it can’t plausibly claim victory in the inflation fight. As Schiff noted in a third tweet, despite all of the rate hikes, money is still too easy.
The ugly truth is the US economy is addicted to easy money. It is addicted to artificially low interest rates and quantitative easing. You can’t take an addict’s drug away without sending him into withdrawal.
It’s easy to get caught up in the weekly data releases, but it’s important to keep your focus on the fundamentals and the bigger economic picture. The fact is, the Fed pumped trillions of dollars into the economy starting after the 2008 financial crisis and then doubling down during the pandemic. The price inflation we’re experiencing today is a symptom of that monetary malfeasance. The Fed can’t fix this problem with some rate hikes and a modest decrease to its balance sheet. It needs to pull trillions of dollars in liquidity out of the economy.
And it can’t.
But the tightening it has already done is enough to pop the bubbles and cause an economic earthquake. We’re already feeling the first tremors.
I like the way how Matterhorn Asset Management company presents current situation in just five charts (by Ronni Stoeferle). Economic and (geo)political developments in recent weeks and months have indeed been exciting. In many areas, it looks as if we are heading for a showdown, for a lasting, formative change. The following five charts present the multi-faceted showdowns that are happening right now before our eyes. We cannot choose that the times are currently so exciting. However, we can choose how to deal with these exciting times so that they do not become a curse for us, but rather an advantage for us and as many people as possible.
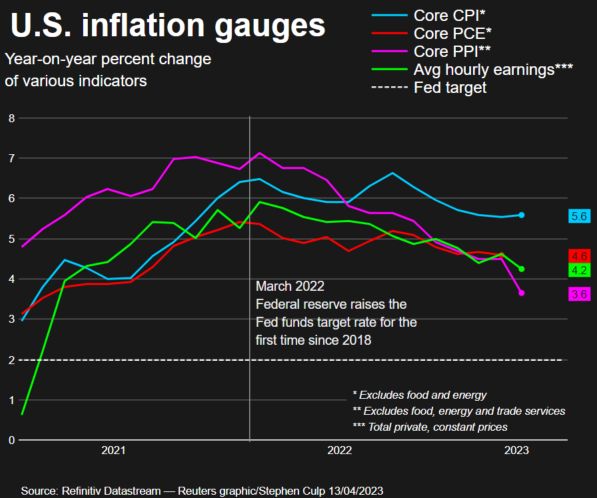
1. Inflation – History (still) rhymes
The parallels between the inflation trend in the 1960s, 1970s and early 1980s and the inflation trend since 2013 is almost frighteningly striking. Only the scaling needs to be slightly reduced by a quarter, loosely based on Mark Twain’s well-known statement: “History doesn’t repeat itself, but it rhymes!”
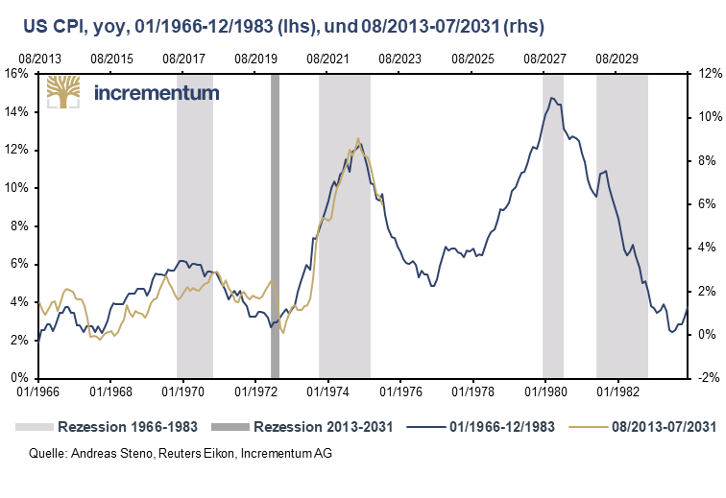
If the parallelism continues in this way, a disinflationary environment can be expected until early summer 2024, after which the second wave of inflation would set in, breaking only in fall 2027. This is very close to our view, that we could be in the beginning of long lasting inflationary cycle, suggesting 5% CPI drop only as a pullback on long-term inflation upward trend. Although we think that the new spiral should start earlier, closer to the autumn of 2023.
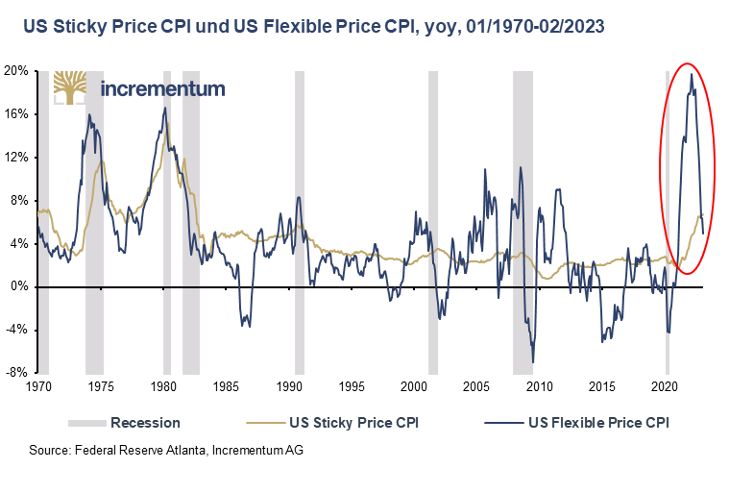
2. Inflation is likely to prove more persistent
Some prices are adjusted quickly to reflect changes in the market situation. These include, for example, gasoline prices, many food prices or car rental prices. Other prices react only with a significant delay, such as garbage charges, the cost of a doctor’s visit, prices in the education sector or rents.
The different price development of these two subgroups is reflected by the Federal Reserve Bank of Atlanta in proprietary indices. After a historical increase to almost 20%, flexible prices are now falling sharply. The sticky prices are behaving quite differently. At just under 7%, they are at a level not seen since the inflation wave of the late 1970s/early 1980s. They are now rising even more strongly than flexible prices and remain at a high level.
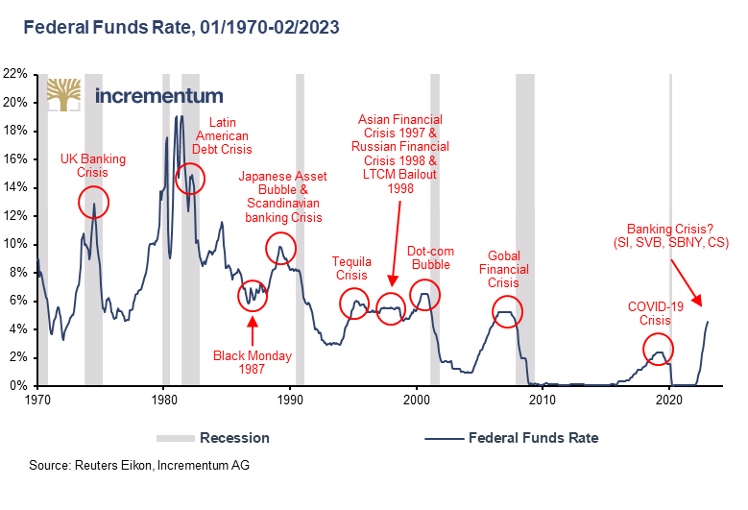
3.Iinterest rate increase cycles
“This time is different” – four words suffice to describe one of the greatest economic illusions. Every generation of investors has yet to succumb to this illusion that a development – in our case interest rate hikes – which in the past have (always) led to one and the same result – in our case severe economic turbulences – -will not happen this time. In everyday life, we would call such behavior stupid.
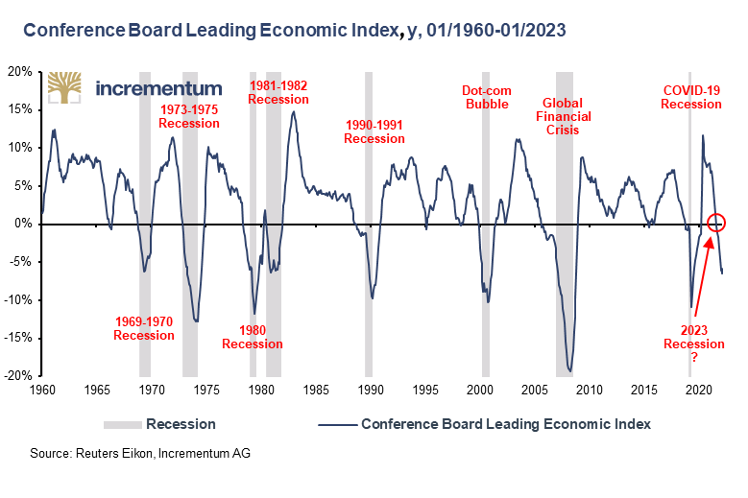
4. A recession seems inevitable
While stock markets give the impression that the worst is already behind us, many leading indicators point to the imminent slide into recession, including the Conference Board Leading Economic Index. This index is composed of 10 economic indicators selected for their ability to predict changes in economic activity. The indicators are selected based on their sensitivity to changes in the economy, their timeliness, and their ability to predict future trends. The 10 components include such diverse economic developments as money supply trends, interest rate spreads, consumer confidence, and initial claims for unemployment insurance. This index has correctly predicted every recession in the past 5 decades as soon as the index slipped significantly into negative territory.
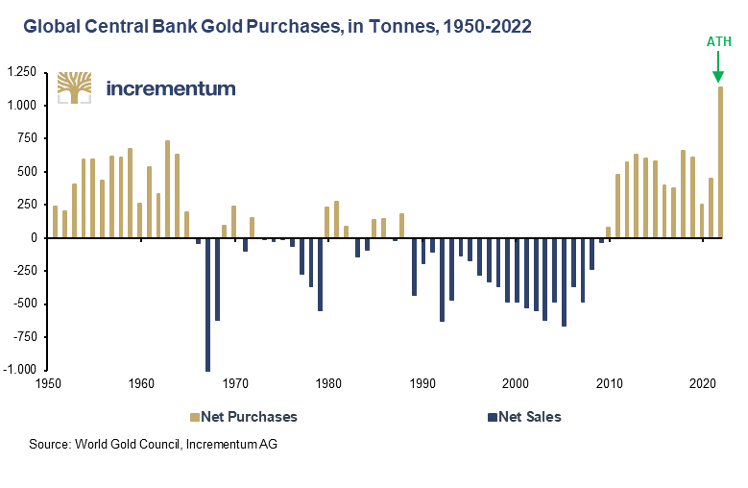
5. Central banks are going for gold
2022 saw record central bank demand for gold. Never since 1950 have central banks increased their gold reserves as much as in 2022, with net purchases totaling 1,136 tons. Three aspects require particular attention. A breakdown of gold purchases by quarter shows that three quarters of gold purchases by central banks in 2022 were made in the second half of the year. Since, as in previous years, it was mainly non-Western central banks that increased their gold holdings, this can be interpreted as a very quick reaction on the part of central banks to the freezing of Russian US dollar and euro currency reserves. Second, China has been making official purchases again since November 2022. And third, about 50% of gold purchases cannot (yet) be attributed to any country. Many are skeptic about Central Banks activity on gold market, but we think that this is one of the most important indicators of global instability.
In this economically and (geo)politically fragile environment with an uncertain outcome, gold has once again proven to be a stable anchor in recent weeks and has made strong gains. Since the interim low at the beginning of November 2022, gold gained 24.0%, since the beginning of the year 10.7%, and since the outbreak of the banking crisis 11.3%. And there is no reason to believe that gold will not continue to excel at this task in the exciting times ahead.
We see many other signs of wealth drop in the world. Just to name a few - “Global crypto venture funding fell to $2.4 billion in Q1 2023 to its lowest level since 2020, down 80% from its all-time high of $12.3 billion in the same period last year,” Bloomberg reports. Another one is - "Investors are avoiding the market's $1.4 trillion riskiest and highest-yielding US corporate debt: "Fears of a looming recession are fueling a growing gap between the highest and lowest-rated companies in the market."
SOME IMPORTANT POLITICAL ISSUES
Call for de-dollarization now is becoming massive and doesn't surprise anybody. This time, Brazil President Lula da Silva has called for using of national currencies in for mutual trading payments.
Meantime, The share of the yuan in trade finance has more than doubled since the launch of the Russian SMO (Special Military Operation) in Ukraine, from less than 2% in February 2022 to 4.5% by Financial Times information. And this is without taking into account the turnover with Russia. The surge, which analysts say reflects both the increased use of the Chinese currency to facilitate trade with Russia, and the rising cost of dollar funding: “The Chinese are using salami slicing tactics to internationalize the yuan. They don't rush."
Truly, the last times are coming and age-old horror stories are climbing into the light of day. They say that Iran did decide to block the Strait of Hormuz (although it is unclear why). But what scares me the most is that BP is returning to offshore drilling in the Gulf of Mexico. Two or three years have passed since everyone finally stopped stuttering at the words Deepwater Horizon.
It seems that this year may become a turning point in terms of the fragmentation of the oil market. That is, it will finally crack and the petrodollar (at least in Eurasia) will no longer exist. Colleagues write that the Saudis have de facto stopped investing in the United States, and the rest of OPEC members are also looking to the left. By the way, this story, like the closing of the Strait of Hormuz, was a terrible bedtime story for Western oil analysts. The very ones, many of whom still believe that oil spontaneously generates and matures in supertankers
If previously, the Arabs invested oil profits in the US budget deficit, and in return received military assistance and guaranteed oil sales. Now everything has changed. Political relations between the US and the Persian Gulf are in crisis. Recently, oil suppliers have suddenly cut production. At the same time, their Central Bank reserves seem to be almost not growing. Money goes to repayment of own debts (appeared due oil's fall to $18 in 2020), loans to needy friends (for example, Egypt or Pakistan in exchange for economic reforms) and investments - Gulf funds create groups to survey China, India and Southeast Asia. Idea: to buy up companies that will use oil to increase sales of black gold in the future. Investments in Europe are unreliable - the national fund of Saudi Arabia has lost 80% of investments in Credit Suisse. Investments also go to luxury projects in the country, to the green agenda, and so on.
An interesting fact: it is extremely difficult to trace the financial transactions of banks in the Persian Gulf, and it is possible that Russian petrodollars are stored there. Enormous money may soon be invested in Asia. In the West, they feared that the funds could gain geopolitical influence - but among the fund managers there are more and more members of the royal families and their investments in Asia will only increase over time, which means their influence.
Warren Buffett says geopolitical tensions were “a consideration” in the decision to sell most of Berkshire Hathaway’s shares in global chip giant TSMC, which is based in Taiwan. The 92-year-old “Oracle of Omaha” shed light on the investment call in a Tuesday interview with Japanese news agency Nikkei. In February, Berkshire Hathaway revealed that it had sold 86% of its shares in TSMC, which were purchased for $4.1 billion just months before. The major reason is a high probability of war conflict to re-join Taiwan to China by force. Definitely he has inside information from high persons in Pentagon, based on intelligence service results.
And finally, few more news on AUKUS block. US gains military access to Philippine bases close to Taiwan and South China Sea. he Philippines on Monday identified the locations of four new military bases the US will gain access to, as part of an expanded defense agreement analysts say is aimed at combating China. The four bases include three on the main island of Luzon, close to Taiwan, and one in Palawan province in the South China Sea (SCS). The US has stepped up efforts to expand its Indo-Pacific security options in recent months, amid mounting concerns over China’s aggressive territorial posturing throughout the region. Recall what we've said about coming AUKUS-China confrontation and attempt to isolate China from world ocean trade ways to hold its economical and trading progress.
Second moment - a new center has appeared in the Republican Party, which will develop and justify the turn of US foreign policy from focusing on Ukraine to confrontation with China and strengthening American influence in the Indo-Pacific region. At the head of this center is a young, promising, but preferring to act from behind the scenes intellectual politician, grandson of the famous American intelligence officer William Colby (CIA director in 1973-1976) Elbridge "Bridge" Colby.
He has all the makings of becoming a figure of the stature and influence of Henry Kissinger under the next Republican president. Don't miss this guy. He could become one of the creators of new political US strategy and AUKUS ideology in near term.
Conclusion:
Well, actually I do not know what else is needed to be comment with more details - you could see everything by yourself. Nearest inflation statistics and especially June Fed meeting could become a turning point in nearest time. Currenty the US economy still has some safety margin but slowly it is coming to an edge and in many spheres. As we've said yesterday - rope around Fed's neck is becoming tighter. Also until summer it will be vital moment of financing. How Fed and Treasury will close big deficit gap with unclear destiny of national debt ceil.
On geopolitical arena US dollar also remains under pressure and loosing its positions. All these events suggest rising volatility. We could get strong downside pullbacks on gold market from time to time due some unexpected turns or data releases, but trend should remain the same - up. Thus, day-by-day trading is a special tune, but long-term physical investing in a way of bullions and coins still looks attractive, despite that we have gold price already around 2K.
Last week we haven't got any gold-specific news. It was relatively calm week and price mostly was driven by statistics. Mostly, the drop of Retail Sales and poor Michigan Manufacturing numbers have supported gold. On political arena still, there were few interesting moments. Other cornerstone question for the Gold market is Fed's policy and we've dedicated FX report to this subject yesterday. Recent data brings us interesting conclusions that mostly look supportive for the gold market in long term.
First, is - significant drop in inflation, (especially in China), mostly in PPI and simultaneous big drop of global production and manufacturing tells that we're entering degradation of global economy, if you want - call it as recession. But at the same time, with absolutely different situation compares to previous crisis, even to 2008 - hardly it puts inflation down. Don't be surprised, but California could become an epicenter of recession. Using some indirect indicators, in the first week of April, the number of shipped containers at the Port of Los Angeles fell sharply to an anti-record since March 2020, the time the pandemic began. Bloomberg connects this incl. with mass layoffs at technology companies and the Silicon Valley Bank crisis.
Although things are a little better on the east coast of the States (but still with negative dynamics), and Europe is still on a recovery trend, the recession risks becoming global , especially considering that the center of the world-system was just in California. China, which is the main supplier of goods to the US, has already recorded an 8% decrease in trucks on the roads and a 5% decrease in loading in ports in April. Don't forget that in China we see strong deflationary processes, mentioned yesterday. By our view they indicate slowdown of economy. Additionally, big collapse of semiconductor global demand (more than for 20% in a year) is an evident confirmation of global slowdown.
Concerning California - it seems it is also becoming a center of commercial real estate collapse and defaults. Blackstone bought a Class A office property in 2014 for $129 million: two 13-story buildings in Southern California. Blackstone sold both buildings a few days ago for $89 million - a 36% discount. What the hell is in class B, C and D markets? This is nominal prices, without adjustment on inflation etc. Rent demand, especially with big business centres stands low, huge squares are empty (record ~29.4% have not seen before). But owners have to pay taxes, utility services and keep other constant expenses. And they can't sell it because price has dropped. Most of this buildings are backed in banks as collateral for loans purposes. Big nested doll...
Another example from California - The WeWork and Rhone Group-created venture defaulted on a $240 million loan to build an office tower that includes WeWork's coworking space as an anchor tenant in San Francisco's financial district: "More office landlords are defaulting given higher rates."
And it seems that EU should standby as Fears mount that Europe’s commercial real estate sector could be the next to fall
Other indirect signs point on wealth decrease among rich EU countries. The Netherlands has joined its humble German neighbors in calling for tough debt-reduction targets as the EU overhauls public finance rules.
"Like Berlin, Amsterdam hints at restrictions on Brussels' freedom of action to negotiate individual debt reduction deals with each member of the bloc."
We're closer to idea that we have temporal decrease, downside swing on a upward inflation spiral. Now we have decrease from 10.5% to 5.6%, next one will be 15% then 8-9% decrease and so on... The same way as bullish trend on a market develops - "two step forward, one step back". Additionally we've investigated a lot of tactical issues that make Fed's life very difficult in nearest 3-4 months. Keep it short, they need big bulk of liquidity that is nowhere to get. The only way is to start again debt monetization. And all this stuff will be on a background of high interest rates. We suggest that market is wrong with expectation of "last 25 points spike" in May. We expect 25 points change in June and maybe even on later meetings as well, especially if inflation will turn up again. This might be big punch on investors' mind in June, leading to drastic shifts in direction of stock and currency markets, when investors' expectations will be missed.
As larger uncertainty is, as better for the gold market. Despite what Fed will do, if we're correct on inflation direction, real rates remain negative and could become even more negative, providing support for the gold market. Besides, it seems that as farer we're going as less confident Fed becomes. At least, people start loosing faith to regulator, and last jump in 1-year inflation expectations proves it.
U.S. March Wage Growth hints that Fed models can Be thrown to trash:
On external stage, global political arena situation is also difficult. D. Trump recently has given good assessment probably, saying - Our economy is collapsing. Inflation is out of control. Russia teamed up with China, it's unthinkable. Saudi Arabia, a great nation, teamed up with China, Russia, Iran, North Korea. Our currency is collapsing and will soon cease to be the world standard, which will be our greatest defeat in 200 years."We are a crumbling nation. We are a nation in decline.
Gold hit a 13-month high about $30 shy of a record peak and the dollar weakened after the data reduced expectations that the Fed will raise rates in May, a major market concern as monetary policy that is too tight can provoke a U.S. recession.
As P. Schiff writes - The Federal Reserve is in a bad situation. It needs to cut rates as soon as possible before the economy comes crashing down around its ears, but even with CPI cooling, it can’t plausibly claim victory in the inflation fight. As Schiff noted in a third tweet, despite all of the rate hikes, money is still too easy.
The bailout may have bought the Fed some time so it can carry on the inflation fight theater for another act or two, but in reality, the scheme was effectively a return to money creation and an end to monetary tightening. Even though the Fed raised rates again in March, the show is effectively over.The Fed Funds rate is still below the official inflation rate and even further below the actual rate. Given that the CPI has likely bottomed, as it heads higher the Fed will need to raise rates just to avoid easing further.”
The ugly truth is the US economy is addicted to easy money. It is addicted to artificially low interest rates and quantitative easing. You can’t take an addict’s drug away without sending him into withdrawal.
It’s easy to get caught up in the weekly data releases, but it’s important to keep your focus on the fundamentals and the bigger economic picture. The fact is, the Fed pumped trillions of dollars into the economy starting after the 2008 financial crisis and then doubling down during the pandemic. The price inflation we’re experiencing today is a symptom of that monetary malfeasance. The Fed can’t fix this problem with some rate hikes and a modest decrease to its balance sheet. It needs to pull trillions of dollars in liquidity out of the economy.
And it can’t.
But the tightening it has already done is enough to pop the bubbles and cause an economic earthquake. We’re already feeling the first tremors.
I like the way how Matterhorn Asset Management company presents current situation in just five charts (by Ronni Stoeferle). Economic and (geo)political developments in recent weeks and months have indeed been exciting. In many areas, it looks as if we are heading for a showdown, for a lasting, formative change. The following five charts present the multi-faceted showdowns that are happening right now before our eyes. We cannot choose that the times are currently so exciting. However, we can choose how to deal with these exciting times so that they do not become a curse for us, but rather an advantage for us and as many people as possible.
1. Inflation – History (still) rhymes
The parallels between the inflation trend in the 1960s, 1970s and early 1980s and the inflation trend since 2013 is almost frighteningly striking. Only the scaling needs to be slightly reduced by a quarter, loosely based on Mark Twain’s well-known statement: “History doesn’t repeat itself, but it rhymes!”
If the parallelism continues in this way, a disinflationary environment can be expected until early summer 2024, after which the second wave of inflation would set in, breaking only in fall 2027. This is very close to our view, that we could be in the beginning of long lasting inflationary cycle, suggesting 5% CPI drop only as a pullback on long-term inflation upward trend. Although we think that the new spiral should start earlier, closer to the autumn of 2023.
2. Inflation is likely to prove more persistent
Some prices are adjusted quickly to reflect changes in the market situation. These include, for example, gasoline prices, many food prices or car rental prices. Other prices react only with a significant delay, such as garbage charges, the cost of a doctor’s visit, prices in the education sector or rents.
The different price development of these two subgroups is reflected by the Federal Reserve Bank of Atlanta in proprietary indices. After a historical increase to almost 20%, flexible prices are now falling sharply. The sticky prices are behaving quite differently. At just under 7%, they are at a level not seen since the inflation wave of the late 1970s/early 1980s. They are now rising even more strongly than flexible prices and remain at a high level.
3.Iinterest rate increase cycles
“This time is different” – four words suffice to describe one of the greatest economic illusions. Every generation of investors has yet to succumb to this illusion that a development – in our case interest rate hikes – which in the past have (always) led to one and the same result – in our case severe economic turbulences – -will not happen this time. In everyday life, we would call such behavior stupid.
4. A recession seems inevitable
While stock markets give the impression that the worst is already behind us, many leading indicators point to the imminent slide into recession, including the Conference Board Leading Economic Index. This index is composed of 10 economic indicators selected for their ability to predict changes in economic activity. The indicators are selected based on their sensitivity to changes in the economy, their timeliness, and their ability to predict future trends. The 10 components include such diverse economic developments as money supply trends, interest rate spreads, consumer confidence, and initial claims for unemployment insurance. This index has correctly predicted every recession in the past 5 decades as soon as the index slipped significantly into negative territory.
5. Central banks are going for gold
2022 saw record central bank demand for gold. Never since 1950 have central banks increased their gold reserves as much as in 2022, with net purchases totaling 1,136 tons. Three aspects require particular attention. A breakdown of gold purchases by quarter shows that three quarters of gold purchases by central banks in 2022 were made in the second half of the year. Since, as in previous years, it was mainly non-Western central banks that increased their gold holdings, this can be interpreted as a very quick reaction on the part of central banks to the freezing of Russian US dollar and euro currency reserves. Second, China has been making official purchases again since November 2022. And third, about 50% of gold purchases cannot (yet) be attributed to any country. Many are skeptic about Central Banks activity on gold market, but we think that this is one of the most important indicators of global instability.
In this economically and (geo)politically fragile environment with an uncertain outcome, gold has once again proven to be a stable anchor in recent weeks and has made strong gains. Since the interim low at the beginning of November 2022, gold gained 24.0%, since the beginning of the year 10.7%, and since the outbreak of the banking crisis 11.3%. And there is no reason to believe that gold will not continue to excel at this task in the exciting times ahead.
We see many other signs of wealth drop in the world. Just to name a few - “Global crypto venture funding fell to $2.4 billion in Q1 2023 to its lowest level since 2020, down 80% from its all-time high of $12.3 billion in the same period last year,” Bloomberg reports. Another one is - "Investors are avoiding the market's $1.4 trillion riskiest and highest-yielding US corporate debt: "Fears of a looming recession are fueling a growing gap between the highest and lowest-rated companies in the market."
SOME IMPORTANT POLITICAL ISSUES
Call for de-dollarization now is becoming massive and doesn't surprise anybody. This time, Brazil President Lula da Silva has called for using of national currencies in for mutual trading payments.
“Why can’t an institution like the BRICS bank have a currency to finance trade relations between Brazil and China, between Brazil and all the other BRICS countries?” he said. “Who decided that the dollar was the (trade) currency after the end of gold parity?
Meantime, The share of the yuan in trade finance has more than doubled since the launch of the Russian SMO (Special Military Operation) in Ukraine, from less than 2% in February 2022 to 4.5% by Financial Times information. And this is without taking into account the turnover with Russia. The surge, which analysts say reflects both the increased use of the Chinese currency to facilitate trade with Russia, and the rising cost of dollar funding: “The Chinese are using salami slicing tactics to internationalize the yuan. They don't rush."
Truly, the last times are coming and age-old horror stories are climbing into the light of day. They say that Iran did decide to block the Strait of Hormuz (although it is unclear why). But what scares me the most is that BP is returning to offshore drilling in the Gulf of Mexico. Two or three years have passed since everyone finally stopped stuttering at the words Deepwater Horizon.
It seems that this year may become a turning point in terms of the fragmentation of the oil market. That is, it will finally crack and the petrodollar (at least in Eurasia) will no longer exist. Colleagues write that the Saudis have de facto stopped investing in the United States, and the rest of OPEC members are also looking to the left. By the way, this story, like the closing of the Strait of Hormuz, was a terrible bedtime story for Western oil analysts. The very ones, many of whom still believe that oil spontaneously generates and matures in supertankers
If previously, the Arabs invested oil profits in the US budget deficit, and in return received military assistance and guaranteed oil sales. Now everything has changed. Political relations between the US and the Persian Gulf are in crisis. Recently, oil suppliers have suddenly cut production. At the same time, their Central Bank reserves seem to be almost not growing. Money goes to repayment of own debts (appeared due oil's fall to $18 in 2020), loans to needy friends (for example, Egypt or Pakistan in exchange for economic reforms) and investments - Gulf funds create groups to survey China, India and Southeast Asia. Idea: to buy up companies that will use oil to increase sales of black gold in the future. Investments in Europe are unreliable - the national fund of Saudi Arabia has lost 80% of investments in Credit Suisse. Investments also go to luxury projects in the country, to the green agenda, and so on.
An interesting fact: it is extremely difficult to trace the financial transactions of banks in the Persian Gulf, and it is possible that Russian petrodollars are stored there. Enormous money may soon be invested in Asia. In the West, they feared that the funds could gain geopolitical influence - but among the fund managers there are more and more members of the royal families and their investments in Asia will only increase over time, which means their influence.
Warren Buffett says geopolitical tensions were “a consideration” in the decision to sell most of Berkshire Hathaway’s shares in global chip giant TSMC, which is based in Taiwan. The 92-year-old “Oracle of Omaha” shed light on the investment call in a Tuesday interview with Japanese news agency Nikkei. In February, Berkshire Hathaway revealed that it had sold 86% of its shares in TSMC, which were purchased for $4.1 billion just months before. The major reason is a high probability of war conflict to re-join Taiwan to China by force. Definitely he has inside information from high persons in Pentagon, based on intelligence service results.
And finally, few more news on AUKUS block. US gains military access to Philippine bases close to Taiwan and South China Sea. he Philippines on Monday identified the locations of four new military bases the US will gain access to, as part of an expanded defense agreement analysts say is aimed at combating China. The four bases include three on the main island of Luzon, close to Taiwan, and one in Palawan province in the South China Sea (SCS). The US has stepped up efforts to expand its Indo-Pacific security options in recent months, amid mounting concerns over China’s aggressive territorial posturing throughout the region. Recall what we've said about coming AUKUS-China confrontation and attempt to isolate China from world ocean trade ways to hold its economical and trading progress.
Second moment - a new center has appeared in the Republican Party, which will develop and justify the turn of US foreign policy from focusing on Ukraine to confrontation with China and strengthening American influence in the Indo-Pacific region. At the head of this center is a young, promising, but preferring to act from behind the scenes intellectual politician, grandson of the famous American intelligence officer William Colby (CIA director in 1973-1976) Elbridge "Bridge" Colby.
He has all the makings of becoming a figure of the stature and influence of Henry Kissinger under the next Republican president. Don't miss this guy. He could become one of the creators of new political US strategy and AUKUS ideology in near term.
Conclusion:
Well, actually I do not know what else is needed to be comment with more details - you could see everything by yourself. Nearest inflation statistics and especially June Fed meeting could become a turning point in nearest time. Currenty the US economy still has some safety margin but slowly it is coming to an edge and in many spheres. As we've said yesterday - rope around Fed's neck is becoming tighter. Also until summer it will be vital moment of financing. How Fed and Treasury will close big deficit gap with unclear destiny of national debt ceil.
On geopolitical arena US dollar also remains under pressure and loosing its positions. All these events suggest rising volatility. We could get strong downside pullbacks on gold market from time to time due some unexpected turns or data releases, but trend should remain the same - up. Thus, day-by-day trading is a special tune, but long-term physical investing in a way of bullions and coins still looks attractive, despite that we have gold price already around 2K.