Sive Morten
Special Consultant to the FPA
- Messages
- 18,648
Fundamentals
This week was rather successful for the gold market and as other markets it is going in habit with the new environment. Yesterday we've taken in-depth view what this environment is. Since markets are driven now by global factors, here it becomes tradition already to use FX research for gold market purposes as well. Current common consensus suggests that inflationary pressure steps out a bit with dropping of US Dollar and interest rates. This provides boost for the gold price. By common opinion - this tendency could last for 2-3 months, approximately through the 2nd quarter. Thus, ING Bank suggests that DXY is coming back to 89 lows:
"We are tempted to say that DXY made an important corrective high at 93.44 at the end of March – and is now heading for a retest of the year’s lows at 89.21,” Turner said."
While Mizuho bank expects that this tendency should last through the IIQ 2021:
“My best guess is the 10-year Treasuries won’t move a great deal from here over the coming quarter and that sets the backdrop for the recent dynamics we’ve seen, with dollar weakness continuing much of this current quarter,” Colin Asher senior economist at Mizuho said.
It means that gold has got the support for medium-term perspective and current upside action has good chances to continue.
Market overview
Gold prices inched higher on Wednesday, extending gains from the previous session after data showing a bigger-than-expected rise in U.S. inflation boosted bullion's
appeal as a hedge against it and weighed on the dollar and Treasury yields.
Consumer prices in the United States soared by the highest in more than 8-1/2 years in March, setting off what most economists expect to be a fleeting spell of higher
inflation. The U.S. dollar fell to three-week lows, making gold cheaper for holders of other currencies, while benchmark 10-year Treasury yields also inched down.
Concerns posed by a suggestion of U.S. health officials to delay the use of Johnson & Johnson's COVID-19 vaccine also supported safe-haven gold.
The U.S. economy could expand by 5% to 6% this year, boosted by increased vaccinations and solid fiscal assistance, but the Federal Reserve will not withdraw its funding just yet, Philadelphia Fed President Patrick Harker said. The European Central Bank should spell out its tolerance for overshooting its inflation target, ECB policymaker Francois Villeroy de Galhau said on Tuesday.
"The second quarter is likely to present the greatest macro headwinds for gold given our expectations for the USD to firm further temporarily," Standard Chartered analyst Suki Cooper said. But thereafter, we expect the USD to revert to its weakening trend, real yields to remain negative and an uptick in inflation expectations to reignite investor interest in gold," Cooper added.
Federal Reserve Chair Jerome Powell said the central bank will reduce its monthly bond purchases before it commits to an interest rate increase, clarifying the order of monetary policy changes that are still months if not years in the future. The Fed reported in its latest "Beige Book" the U.S. economic recovery accelerated to a moderate pace from late February to early April.
The U.S. economy accelerated into the spring on the basis of rising consumer sentiment, according to the Federal Reserve, and Fed Chair Jerome Powell said the country is on track for faster growth and hiring in the coming months. Powell and other Fed officials, however, say the brighter economic forecasts and a brief period of higher inflation will not affect monetary policy and the central bank will keep its support in place until the crisis is over.
The eurozone economy, however, is now relying on the "two crutches" of monetary and fiscal stimulus, which cannot be removed until the economy recovers completely, according to European Central Bank President Christine Lagarde.
U.S. import prices rose more than anticipated in March, boosted by higher fuel rates and tight supply chains.
"A massive amount of inflation is certainly on the horizon and gold is just the best asset to own as we start to see what I would consider some historic levels of inflation," said Jeffrey Sica, founder of Circle Squared Alternative Investments.
"The market is betting that there will be large requirements to fund some higher inflation and a Federal Reserve that's not particularly worried about inflation being a serious issue for now," said Bart Melek, head of commodity strategies at TD Securities.
Global equity funds lured massive inflows in the week ended April 14, on optimism over a strong second quarter earnings, and a decline in U.S. yields due to tempered expectations about a rise in inflation levels. Precious metal funds faced $641 million in outflows, a tenth straight week of outflows, as investors took higher risks, dumping safe haven assets.
Gold prices scaled a seven-week high on Friday and were set for their best weekly gain since mid-December as a pullback in U.S. Treasury yields and the dollar lifted the metal's appeal.
"We're seeing gold going up mostly because yields are going down and the dollar is weakening," ActivTrades Chief Analyst Carlo Alberto De Casa said.
Gold's gains came despite U.S. data showing robust retail sales and a significant drop in weekly jobless claims, as well as record economic growth in China in the first
quarter.
The markets are trusting the Federal Reserve to keep interest rates lower for longer, so even if inflation does jump above 2% for a few weeks or months, central bank tapering is still a bit farther, De Casa said.
Easy monetary policy tends to weigh on government bond yields, increasing the appeal of non-yielding gold.
The drop in 10-year yields below the key 1.60% mark "has allowed spot gold to break above its 50-day simple moving average (SMA) for the first time since early February," FXTM Market Analyst Han Tan said in a note. A decisive breach of its 100-day SMA, which currently resides around the psychologically important $1,800, may just do the trick as a clarion call for gold bulls to rush back in."
China has given domestic and international banks permission to import large amounts of gold into the country, five sources familiar with the matter said, potentially helping to support global gold prices after months of declines. About 150 tonnes of gold worth $8.5 billion at current prices is likely to be shipped following the green light from Beijing, four sources said. Two said the gold would be shipped in April and two said it would arrive over April and May. The bulk of China's gold imports typically comes from Australia, South Africa and Switzerland.
China and India typically account for some two fifths of the world's annual demand for gold.
Their recovery is "critical in setting the floor for gold" and should stop prices from falling further over the coming months, said Suki Cooper, an analyst at Standard Chartered.
"The macro argument for gold has also improved. We are poised for a run towards $1,800," said Edward Moya, senior market analyst at OANDA. We've had many investors abandon some positions because of some extreme technical selling we saw with Treasury yields and that has really provided a strong backdrop here for gold prices to continue to appreciate."
COT Report
Recent CFTC data shows contraction of net long position as speculators have closed some longs. Open interest also has dropped a bit. Although single report is not representative enough to judge about the whole tendency, but, in general, this data stands in favor of retracement type of action on gold.


Source: cftc.gov
Charting by Investing.com
Well, have you signed that comments from Standard Chartered Bank and other smaller investing companies contradict to the ones that were mentioned in the beginning of the research. Once ING and Mizuho suggest downside trend on US Dollar and Interest rates in IIQ - Standard Chartered tells the opposite thing:
"The second quarter is likely to present the greatest macro headwinds for gold given our expectations for the USD to firm further temporarily," Standard Chartered analyst Suki Cooper said. But thereafter, we expect the USD to revert to its weakening trend, real yields to remain negative and an uptick in inflation expectations to reignite investor interest in gold," Cooper added.
To whom we should believe and what position is correct? We suggest that Standard Chartered is a hostage of well-known theory that Gold is excellent protection against inflation. We do not deny this but have to ask - "at what time perspective?". The correct answer is ten years or even centuries. When inflation is visible through the waves of multiple economy cycles. But, gold is significantly less effective within just one cycle. I would say even more - gold is almost useless for protection against inflation and rising interest rates during recovery and growth stage of economy cycle. Here is BlackRock analysts tells the same:
Gold is “failing as an equity hedge,” Koesterich said, noting its positive relationship with risky assets was even stronger when compared with tech stocks. He added: “Gold’s ability to hedge against inflation has been somewhat exaggerated. While it is a reasonable store of value over the very long-term -- think centuries -- it is less reliable across most investment horizons... Gold’s recent correlation with stocks and inflation has been positive to effectively zero.
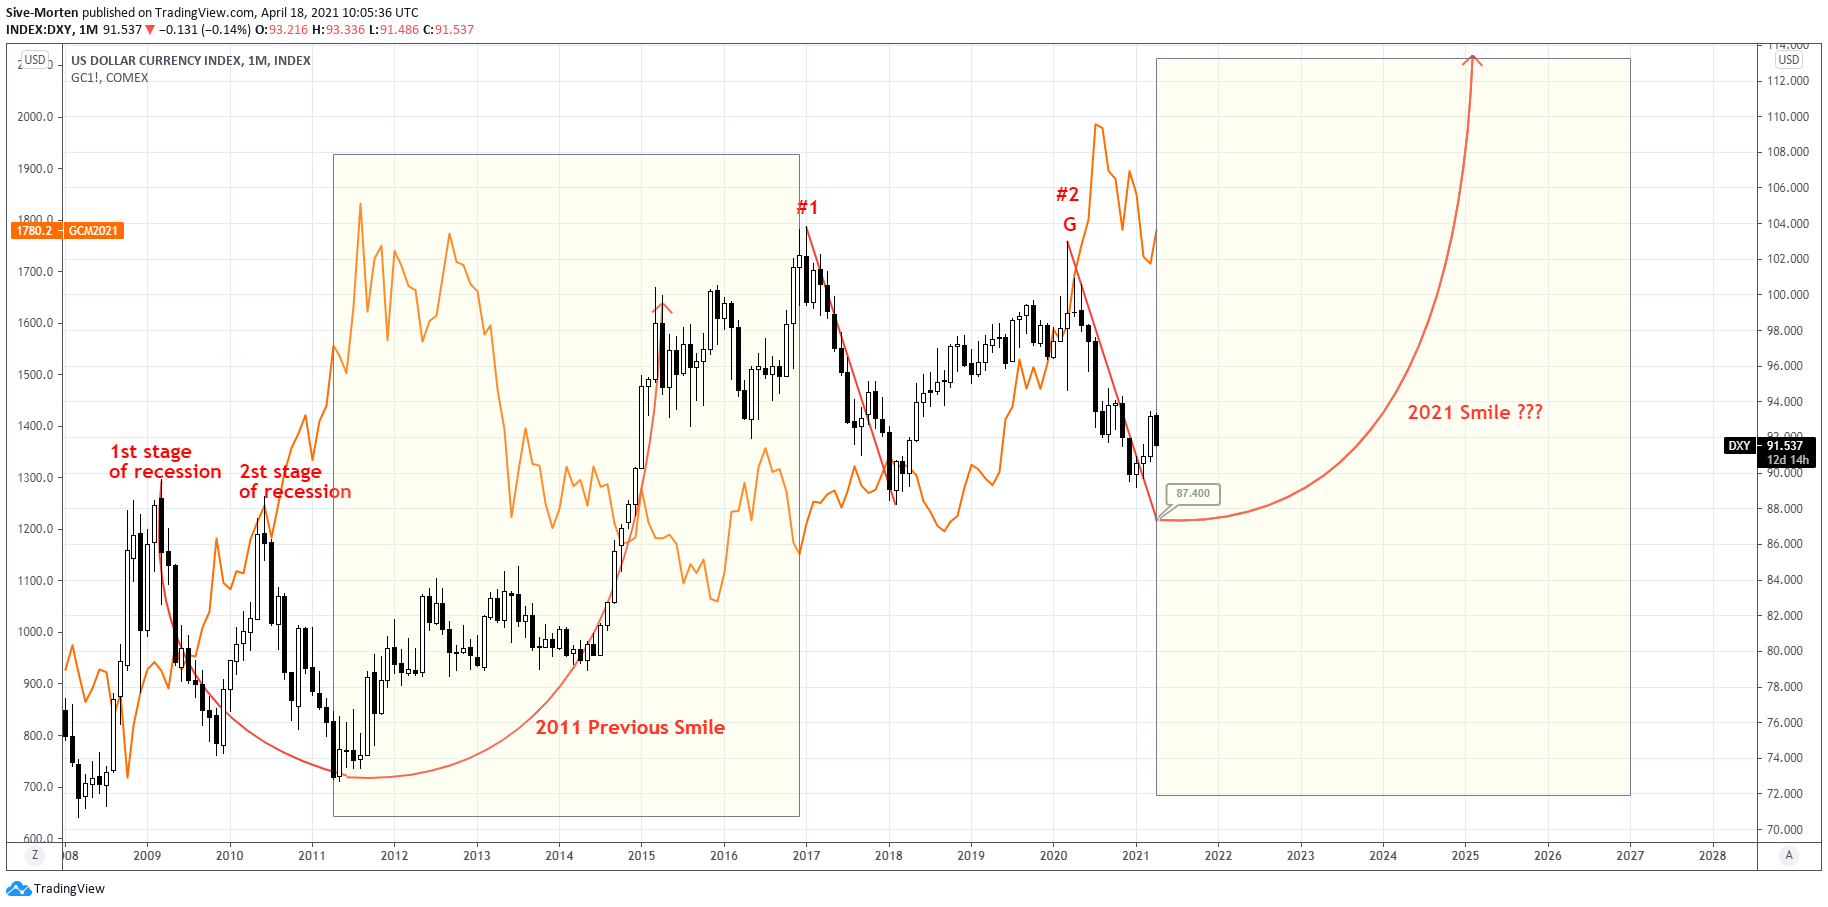
Thus, our own view mostly the same as ING and Mizuho. With reducing of inflationary sentiment, we suggest that IIQ should be positive for gold instead, and negative for US Dollar and Interest rates. While in a longer perspective, closer to the end of 2021 and in 2022 overall situation should change as inflation will be back. This is the reason that current gold rally, although it might become extended enough, we still treat as pullback in starting of new bearish cycle.
We expect the repeating of the previous US economy grow stage of the cycle after 2-leg recession of subprime crisis. Now - 2nd leg of recession is almost done as well and new growth stage of the cycle is ready to begin. Take a look what usually happens with the gold price on growth stage - yes, it is dropping. Thus, we could enjoy the process, while Dollar is coming to new 87.40 lows, and gold even could return back to 2000 $ top, but this probably is swan song...
Technicals
Monthly
April shows nice performance but context on monthly chart remains bearish due multiple factors - MACD trend stands bearish, price is below YPP and downside action shows acceleration on CD leg. Still, as price shows the first touch of strong support area - we're in tactical bounce environment. As we've said gold keeps ability of propriate reaction on meaningful technical conditions by far, such as strong K-areas on long-term charts. And in general we could pretend on stronger reaction from the level of such scale.
Besides, although 10-year interest rates climb to 1.75% area - this is the first upside action after long-term downside tendency and technically, after first bounce we always get deep retracement because of existed bearish momentum. Thus, particular this deep retracement on interest rates should become a catalysis of gold stronger upside action.
Almost in the same area, around 1655$ we have an OP target of monthly AB-CD pattern that has not been hit yet. But it is rather tricky situation with this OP. The point is - upside action could last 2-3 months and it is very short time period. Hardly it is possible to hit OP and then to show solid upside bounce together. This is just 2-3 candles on this chart. Thus, maybe OP will be reached after pullback. Alternatively, it might happen by some extraordinary situation when gold dives and returns right back up. Still the first way looks more probable. In general, OP situation is not unique for the gold, as on EUR we have approximately the same tricky moment - existence of untouched XOP on weekly time frame.

Weekly
MACD has turned bullish here and market is breaking out of tight flag consolidation. Now price stands nearest resistance level of 1784$. We have no overbought barriers by far. Here we could apply only classic way for target estimation based on broken flag - supposedly market could double its height and reach major 1828-1851$ resistance area. This should be major challenge for the gold, as it is also accompanied by overbought area.

Daily
Trend stands bullish here as well, price is not at overbought. 1784 is not just a single level but K-area as well till 1800. Daily time frame provides all important information. Since the price action looks like double bottom pattern - the target that we set on weekly chart mostly relates to it. Still we need to consider another one as it is important for daily time frame. This is XOP around 1805 - slightly above the K-resistance and is accompanied by overbought as well.
Here we also could estimate invalidation point for short-term bullish setup. This is the low of our reversal candle around 1723. Price has to stay above it to keep chances on upward continuation. Downside breakout of R-lows means two negative things - forming of bearish reversal swing and price return back into consolidation. It means failure upward breakout and return back to 1685 lows at least.

Intraday
Gold has completed our 1.618 butterfly as well. Usually, butterfly triggers at least 3/8 pullback and it corresponds to 1760 area. Thus, 1755-1760 is an area to consider long entry. 1743-1746 is very important K-area that is suitable for long entry as well but not only this way. In fact, this K-area is even more important than 1723 lows because of its strength. Downside breakout of K-area probably means the same as breakout of 1723 lows.
Thus, we have two entry points that are not mutually exclusive -1755-1760 and 1743-1746. Second area cares also the feature of invalidation in a row with 1723 lows.

This week was rather successful for the gold market and as other markets it is going in habit with the new environment. Yesterday we've taken in-depth view what this environment is. Since markets are driven now by global factors, here it becomes tradition already to use FX research for gold market purposes as well. Current common consensus suggests that inflationary pressure steps out a bit with dropping of US Dollar and interest rates. This provides boost for the gold price. By common opinion - this tendency could last for 2-3 months, approximately through the 2nd quarter. Thus, ING Bank suggests that DXY is coming back to 89 lows:
"We are tempted to say that DXY made an important corrective high at 93.44 at the end of March – and is now heading for a retest of the year’s lows at 89.21,” Turner said."
While Mizuho bank expects that this tendency should last through the IIQ 2021:
“My best guess is the 10-year Treasuries won’t move a great deal from here over the coming quarter and that sets the backdrop for the recent dynamics we’ve seen, with dollar weakness continuing much of this current quarter,” Colin Asher senior economist at Mizuho said.
It means that gold has got the support for medium-term perspective and current upside action has good chances to continue.
Market overview
Gold prices inched higher on Wednesday, extending gains from the previous session after data showing a bigger-than-expected rise in U.S. inflation boosted bullion's
appeal as a hedge against it and weighed on the dollar and Treasury yields.
Consumer prices in the United States soared by the highest in more than 8-1/2 years in March, setting off what most economists expect to be a fleeting spell of higher
inflation. The U.S. dollar fell to three-week lows, making gold cheaper for holders of other currencies, while benchmark 10-year Treasury yields also inched down.
Concerns posed by a suggestion of U.S. health officials to delay the use of Johnson & Johnson's COVID-19 vaccine also supported safe-haven gold.
The U.S. economy could expand by 5% to 6% this year, boosted by increased vaccinations and solid fiscal assistance, but the Federal Reserve will not withdraw its funding just yet, Philadelphia Fed President Patrick Harker said. The European Central Bank should spell out its tolerance for overshooting its inflation target, ECB policymaker Francois Villeroy de Galhau said on Tuesday.
"The second quarter is likely to present the greatest macro headwinds for gold given our expectations for the USD to firm further temporarily," Standard Chartered analyst Suki Cooper said. But thereafter, we expect the USD to revert to its weakening trend, real yields to remain negative and an uptick in inflation expectations to reignite investor interest in gold," Cooper added.
Federal Reserve Chair Jerome Powell said the central bank will reduce its monthly bond purchases before it commits to an interest rate increase, clarifying the order of monetary policy changes that are still months if not years in the future. The Fed reported in its latest "Beige Book" the U.S. economic recovery accelerated to a moderate pace from late February to early April.
The U.S. economy accelerated into the spring on the basis of rising consumer sentiment, according to the Federal Reserve, and Fed Chair Jerome Powell said the country is on track for faster growth and hiring in the coming months. Powell and other Fed officials, however, say the brighter economic forecasts and a brief period of higher inflation will not affect monetary policy and the central bank will keep its support in place until the crisis is over.
The eurozone economy, however, is now relying on the "two crutches" of monetary and fiscal stimulus, which cannot be removed until the economy recovers completely, according to European Central Bank President Christine Lagarde.
U.S. import prices rose more than anticipated in March, boosted by higher fuel rates and tight supply chains.
"A massive amount of inflation is certainly on the horizon and gold is just the best asset to own as we start to see what I would consider some historic levels of inflation," said Jeffrey Sica, founder of Circle Squared Alternative Investments.
"The market is betting that there will be large requirements to fund some higher inflation and a Federal Reserve that's not particularly worried about inflation being a serious issue for now," said Bart Melek, head of commodity strategies at TD Securities.
Global equity funds lured massive inflows in the week ended April 14, on optimism over a strong second quarter earnings, and a decline in U.S. yields due to tempered expectations about a rise in inflation levels. Precious metal funds faced $641 million in outflows, a tenth straight week of outflows, as investors took higher risks, dumping safe haven assets.
Gold prices scaled a seven-week high on Friday and were set for their best weekly gain since mid-December as a pullback in U.S. Treasury yields and the dollar lifted the metal's appeal.
"We're seeing gold going up mostly because yields are going down and the dollar is weakening," ActivTrades Chief Analyst Carlo Alberto De Casa said.
Gold's gains came despite U.S. data showing robust retail sales and a significant drop in weekly jobless claims, as well as record economic growth in China in the first
quarter.
The markets are trusting the Federal Reserve to keep interest rates lower for longer, so even if inflation does jump above 2% for a few weeks or months, central bank tapering is still a bit farther, De Casa said.
Easy monetary policy tends to weigh on government bond yields, increasing the appeal of non-yielding gold.
The drop in 10-year yields below the key 1.60% mark "has allowed spot gold to break above its 50-day simple moving average (SMA) for the first time since early February," FXTM Market Analyst Han Tan said in a note. A decisive breach of its 100-day SMA, which currently resides around the psychologically important $1,800, may just do the trick as a clarion call for gold bulls to rush back in."
China has given domestic and international banks permission to import large amounts of gold into the country, five sources familiar with the matter said, potentially helping to support global gold prices after months of declines. About 150 tonnes of gold worth $8.5 billion at current prices is likely to be shipped following the green light from Beijing, four sources said. Two said the gold would be shipped in April and two said it would arrive over April and May. The bulk of China's gold imports typically comes from Australia, South Africa and Switzerland.
China and India typically account for some two fifths of the world's annual demand for gold.
Their recovery is "critical in setting the floor for gold" and should stop prices from falling further over the coming months, said Suki Cooper, an analyst at Standard Chartered.
"The macro argument for gold has also improved. We are poised for a run towards $1,800," said Edward Moya, senior market analyst at OANDA. We've had many investors abandon some positions because of some extreme technical selling we saw with Treasury yields and that has really provided a strong backdrop here for gold prices to continue to appreciate."
COT Report
Recent CFTC data shows contraction of net long position as speculators have closed some longs. Open interest also has dropped a bit. Although single report is not representative enough to judge about the whole tendency, but, in general, this data stands in favor of retracement type of action on gold.
Source: cftc.gov
Charting by Investing.com
Well, have you signed that comments from Standard Chartered Bank and other smaller investing companies contradict to the ones that were mentioned in the beginning of the research. Once ING and Mizuho suggest downside trend on US Dollar and Interest rates in IIQ - Standard Chartered tells the opposite thing:
"The second quarter is likely to present the greatest macro headwinds for gold given our expectations for the USD to firm further temporarily," Standard Chartered analyst Suki Cooper said. But thereafter, we expect the USD to revert to its weakening trend, real yields to remain negative and an uptick in inflation expectations to reignite investor interest in gold," Cooper added.
To whom we should believe and what position is correct? We suggest that Standard Chartered is a hostage of well-known theory that Gold is excellent protection against inflation. We do not deny this but have to ask - "at what time perspective?". The correct answer is ten years or even centuries. When inflation is visible through the waves of multiple economy cycles. But, gold is significantly less effective within just one cycle. I would say even more - gold is almost useless for protection against inflation and rising interest rates during recovery and growth stage of economy cycle. Here is BlackRock analysts tells the same:
Gold is “failing as an equity hedge,” Koesterich said, noting its positive relationship with risky assets was even stronger when compared with tech stocks. He added: “Gold’s ability to hedge against inflation has been somewhat exaggerated. While it is a reasonable store of value over the very long-term -- think centuries -- it is less reliable across most investment horizons... Gold’s recent correlation with stocks and inflation has been positive to effectively zero.
Thus, our own view mostly the same as ING and Mizuho. With reducing of inflationary sentiment, we suggest that IIQ should be positive for gold instead, and negative for US Dollar and Interest rates. While in a longer perspective, closer to the end of 2021 and in 2022 overall situation should change as inflation will be back. This is the reason that current gold rally, although it might become extended enough, we still treat as pullback in starting of new bearish cycle.
We expect the repeating of the previous US economy grow stage of the cycle after 2-leg recession of subprime crisis. Now - 2nd leg of recession is almost done as well and new growth stage of the cycle is ready to begin. Take a look what usually happens with the gold price on growth stage - yes, it is dropping. Thus, we could enjoy the process, while Dollar is coming to new 87.40 lows, and gold even could return back to 2000 $ top, but this probably is swan song...
Technicals
Monthly
April shows nice performance but context on monthly chart remains bearish due multiple factors - MACD trend stands bearish, price is below YPP and downside action shows acceleration on CD leg. Still, as price shows the first touch of strong support area - we're in tactical bounce environment. As we've said gold keeps ability of propriate reaction on meaningful technical conditions by far, such as strong K-areas on long-term charts. And in general we could pretend on stronger reaction from the level of such scale.
Besides, although 10-year interest rates climb to 1.75% area - this is the first upside action after long-term downside tendency and technically, after first bounce we always get deep retracement because of existed bearish momentum. Thus, particular this deep retracement on interest rates should become a catalysis of gold stronger upside action.
Almost in the same area, around 1655$ we have an OP target of monthly AB-CD pattern that has not been hit yet. But it is rather tricky situation with this OP. The point is - upside action could last 2-3 months and it is very short time period. Hardly it is possible to hit OP and then to show solid upside bounce together. This is just 2-3 candles on this chart. Thus, maybe OP will be reached after pullback. Alternatively, it might happen by some extraordinary situation when gold dives and returns right back up. Still the first way looks more probable. In general, OP situation is not unique for the gold, as on EUR we have approximately the same tricky moment - existence of untouched XOP on weekly time frame.
Weekly
MACD has turned bullish here and market is breaking out of tight flag consolidation. Now price stands nearest resistance level of 1784$. We have no overbought barriers by far. Here we could apply only classic way for target estimation based on broken flag - supposedly market could double its height and reach major 1828-1851$ resistance area. This should be major challenge for the gold, as it is also accompanied by overbought area.
Daily
Trend stands bullish here as well, price is not at overbought. 1784 is not just a single level but K-area as well till 1800. Daily time frame provides all important information. Since the price action looks like double bottom pattern - the target that we set on weekly chart mostly relates to it. Still we need to consider another one as it is important for daily time frame. This is XOP around 1805 - slightly above the K-resistance and is accompanied by overbought as well.
Here we also could estimate invalidation point for short-term bullish setup. This is the low of our reversal candle around 1723. Price has to stay above it to keep chances on upward continuation. Downside breakout of R-lows means two negative things - forming of bearish reversal swing and price return back into consolidation. It means failure upward breakout and return back to 1685 lows at least.
Intraday
Gold has completed our 1.618 butterfly as well. Usually, butterfly triggers at least 3/8 pullback and it corresponds to 1760 area. Thus, 1755-1760 is an area to consider long entry. 1743-1746 is very important K-area that is suitable for long entry as well but not only this way. In fact, this K-area is even more important than 1723 lows because of its strength. Downside breakout of K-area probably means the same as breakout of 1723 lows.
Thus, we have two entry points that are not mutually exclusive -1755-1760 and 1743-1746. Second area cares also the feature of invalidation in a row with 1723 lows.