Sive Morten
Special Consultant to the FPA
- Messages
- 18,644
Fundamentals
This week market shows strong rally, but some factors start to point on overbought condition, predicting healthy retracement. Trade tensions again stands in the center and as major driving factor for gold market.
Market has shown best week in over three years, as dovish central banks, escalating U.S.-China trade tensions and negative debt yields around the globe kept prices close to $1,500 per ounce.
“Gold is where it is right now because it seems to be the perfect environment for it between central banks cutting interest rates and negative-yielding debt,” OANDA senior market analyst Craig Erlam said.
“Gold has gone up so much and is going to reach a point where people will start questioning whether it is overbought ... and whether correction is on the cards.”
German long-dated bond yields tumbled to record lows in negative territory on Wednesday, while Dutch 30-year and Irish 10-year yields turned negative for the first time on Monday.
The central banks of New Zealand, Thailand and India stunned markets with a series of interest rate cuts, pointing to policymakers’ dwindling ammunition to fight a downturn.
The U.S. Federal Reserve also cut its benchmark interest rate for the first time since 2008 last week.
“The trade spat is driving the market crazy. We don’t rule out technical corrections, but $1,500 is now the new normal unless trade relations take a turn in a right direction,” said Jigar Trivedi, commodities analyst at Mumbai-based Anand Rathi Shares & Stock Brokers.
Bullion has risen 4.4% so far this week - the biggest since April 2016 - and about 17% for the year, gaining more than $100 in the past week.
On the technical front “if we can go past the pivotal $1,520-$1560 region, it would start to a look a lot bullish ... For it to move that far ahead we need to see more convincing sign for something darker on the horizon,” OANDA’s Erlam added.
On the investment side, holdings of SPDR Gold Trust, the world’s largest gold-backed exchange-traded fund, has gained about 1.8% this week and about 7.3% in 2019.
Precious metals funds recorded their fourth-largest inflows ever in the week to Wednesday and investment-grade funds sucked money in, Bank of America Merrill Lynch said on Friday.
Within equities, United States stocks funds suffered $15.2 billion in outflows in the same week, the most since December 2018, while emerging equity funds saw the biggest outflow since August 2015 at $6.2 billion, said BAML citing EPFR data.
The moves follow a tumultuous week in global markets, with China letting its yuan fall past the 7-per-dollar level marking the latest salvo in a trade dispute between Beijing and Washington and fresh fears emerging about a global economic pullback.
The yuan’s slide on Monday contributed to $12.4 billion exiting global equity funds, the 12th largest ever daily outflow from global equity funds, according to the data.
The volatility pushed investors to assets viewed as safe. A total of $2.3 billion poured into precious metal funds. $11 billion has now shifted into gold in the past 10 weeks, the biggest inflow since Brexit in 2016, BAML said.
As high-yield bond funds experienced the biggest outflow since December 2018, investment-grade bond funds notched up their 29th week of inflows, pulling in $6.7 billion.
U.S. President Donald Trump on Friday said he was not ready to make a deal with China and even called a September round of trade talks into question, reviving concerns on financial markets that the bilateral dispute is unlikely to end anytime soon.
“We’re talking with China. We’re not ready to make a deal - but we’ll see what happens,” Trump told reporters at the White House before departing for fundraisers on Long Island, New York.
“China wants to do something, but I’m not ready to do anything yet. Twenty-five years of abuse - I’m not ready so fast, so we’ll see how that works out,” he said.
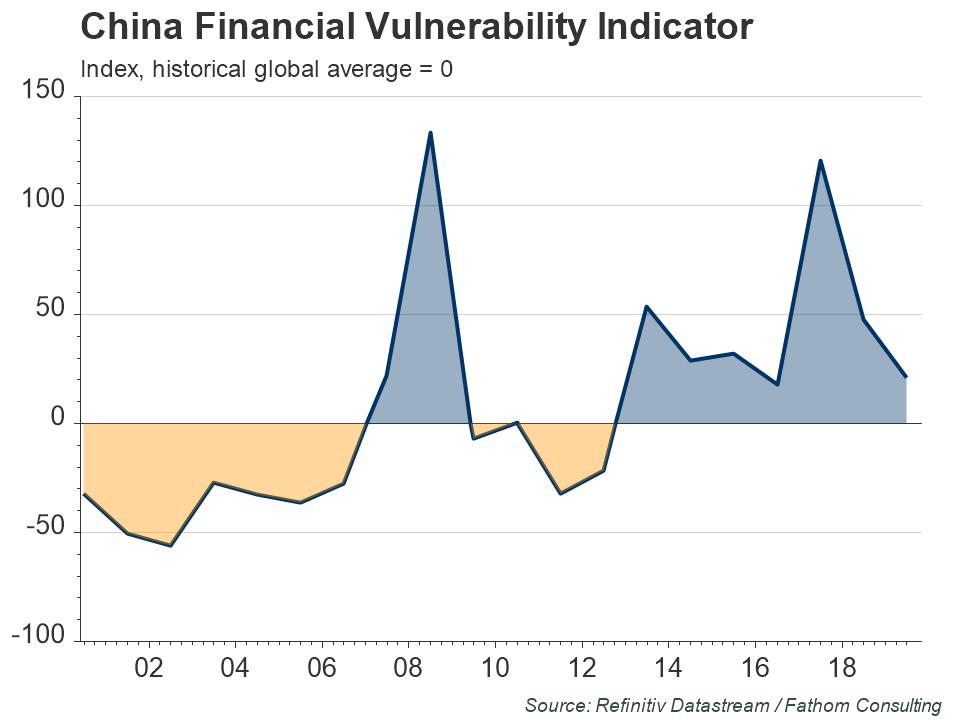
At the same time Fathom informs on corporate debt problems in China and rising unemployment that hidden by official government.
When the global economy slowed, China offset the demand shortfall with a hefty stimulus package. This caused huge amounts of excess capacity in certain sectors, such as real estate where investment surged, creating a mass of housing mothballed into the construction phase or sitting dormant. In order to maintain house prices, the time taken to complete construction increased considerably, delaying the release of properties onto the market. Fathom estimates that there are now 50 million houses either vacant or still under construction in China — more than double the number of homes that exist in the whole of the UK.
As banks continue to provide finance for these unproductive projects, non-performing loans are on the rise. While official statistics put China’s non-performing loan rate at around 7% as a share of GDP, Fathom estimates this to be much higher at 28–38%. Such levels are ultimately unsustainable and unless policymakers deal with the ticking time bomb of non-performing loans, the risk of a banking crisis will remain elevated
Problems are not just limited to the real estate sector; while China’s official urban unemployment rate has remained flat at roughly 4% for over a decade, Fathom’s underemployment indicator — which highlights the number of workers either unemployed or engaged in unproductive activities — has swelled to 14% since 2008.
Prime among these is China’s Belt and Road Initiative, which plans to develop trade and transport infrastructure all over the world. With around half the countries in the world signed up and an estimated $400 billion already invested, there are growing concerns over China’s intentions, especially regarding the outcome if target countries cannot afford loan repayments. Fathom draws on similarities with the rise of the British Empire; the UK became the world’s largest manufacturing economy after the industrial revolution and would invest heavily in other countries in order to extract the resources required for production.
In terms of current trade tensions, Fathom’s view is that this is the beginning of a sustained period of geo-strategic rivalry with the US, with no clear end in sight. Tariffs are seen as a tactic to try and force China to change its behaviour, but Fathom questions labelling this a trade war, paraphrasing Ellis Carver from The Wire in reference to the War on Drugs: “You can’t call this…a war. Wars end”.
Finally, if take a look at recent CFTC report, we will see too heavy long position on Gold that comes to all time high. It means that retracement stands right around the corner. To keep upside bullish trend, you need stable demand, but when everybody have bought already, trend stops. This is the point that we're coming to:

That's being said, it's a safe bet that we have new long-term bullish trend on gold market and the view that we've expressed last year gradually is turning to reality. The problems in Chinese economy that are not widely presented in media tells that tariffs are working and in long-term perspective supports demand for safe haven assets. Also it agrees with our suggestion that tariffs is the tool in US hands, not in China hands and first of all they hit Chinese economy as it less protected in social sphere, more fragile on domestic basis.
Meantime, markets are gripped by a frenzy of golden rush, which resulted in overextended long positions and could become a reason for healthy retracement in near term perspective.
Technical
Monthly
Gold shows great performance on monthly chart, but taking in consideration recent CFTC report, we need to keep an eye on nearest targets that we have here.
As we mentioned last week, next two upside targets - 1530$ of 1.618 butterfly extension and 1655 as XOP target of the same major AB=CD pattern. XOP seems a bit too far, but butterfly extension is the one that we need. Besides, it stands relatively close to major 5/8 Fib resistance level of 1585 and monthly Overbought @1550$ area.
Thus, we put this area - 1530-1585 as tactical ceil at current moment and expect that gold will show healthy retracement out there by fundamental reasons that we've mentioned.

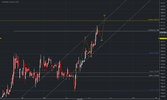
Weekly
On weekly chart market has two other extensions that stand in the same monthly area. This is larger AB-CD and minor ab-cd patterns. Both of them have XOPs in the same area - 1555-1570, which agrees with our monthly range.
Right now market stands at weekly overbought and butterfly target, but, as action to butterfly 1.618 extension point was too fast, I wouldn't say that gold definitely will turn down here, prior reaching of 1540-1585 area. Upside action probably will become slower, but gold should try to reach major targets by momentum. Still, we will keep in mind this point as well, if we will see something different on lower time frames.

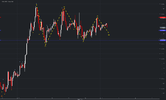
Daily
Here market stands at Overbought as well, but we're more interested in oversold level here. Although on weekly chart minor retracement could be invisible, here, we still could get some reaction on weekly butterfly target.
Daily chart has its own XOP, which has not been hit yet, and suggests minor spike up, a kind of W&R action. This is the first point that we will keep an eye on next week. Second, if retracement indeed will happen, hardly it will be deeper than 1440 area. More probable is 1440-1460 K-area, or even minor pullback to 1470 level.
In current situation it is difficult to plan new bullish trades. Retracement, if even you do not want to trade it, could be useful as it will provide chances for long entry at better conditions.

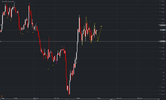
Intraday
On Friday we've mentioned possible DRPO "Sell" pattern on 4H chart and it has been confirmed by the end of the week as we've got 2nd close below 3x3 DMA. Everything seems good, but still two things worry me on this pattern. First is, we haven't seen the "second challenge" on 2nd top of DRPO, no attempt to continue upward action, no bulls' capitulation. Second top here looks more like retracement of 1st top. Besides, DRPO takes the shape of triangle.
Second is uncompleted daily XOP stands slightly above the market. These moments tell that some upside spike to 1522 area still could happen, but not necessary it will cancel idea of DRPO "Sell" pattern. If you plan short trades here - either wait for this spike to daily XOP or place stop orders somewhere above it.

Conclusion
Fundamental and technical analysis shows that gold keeps long-term bullish sentiment. In shorter-term perspective chances on retracement significantly increased. Although we suggest that it has more chances to happen from 1540-1585 area, but we also will keep an eye on current level, as weekly butterfly is done here as well.
The technical portion of Sive's analysis owes a great deal to Joe DiNapoli's methods, and uses a number of Joe's proprietary indicators. Please note that Sive's analysis is his own view of the market and is not endorsed by Joe DiNapoli or any related companies.
This week market shows strong rally, but some factors start to point on overbought condition, predicting healthy retracement. Trade tensions again stands in the center and as major driving factor for gold market.
Market has shown best week in over three years, as dovish central banks, escalating U.S.-China trade tensions and negative debt yields around the globe kept prices close to $1,500 per ounce.
“Gold is where it is right now because it seems to be the perfect environment for it between central banks cutting interest rates and negative-yielding debt,” OANDA senior market analyst Craig Erlam said.
“Gold has gone up so much and is going to reach a point where people will start questioning whether it is overbought ... and whether correction is on the cards.”
German long-dated bond yields tumbled to record lows in negative territory on Wednesday, while Dutch 30-year and Irish 10-year yields turned negative for the first time on Monday.
The central banks of New Zealand, Thailand and India stunned markets with a series of interest rate cuts, pointing to policymakers’ dwindling ammunition to fight a downturn.
The U.S. Federal Reserve also cut its benchmark interest rate for the first time since 2008 last week.
“The trade spat is driving the market crazy. We don’t rule out technical corrections, but $1,500 is now the new normal unless trade relations take a turn in a right direction,” said Jigar Trivedi, commodities analyst at Mumbai-based Anand Rathi Shares & Stock Brokers.
Bullion has risen 4.4% so far this week - the biggest since April 2016 - and about 17% for the year, gaining more than $100 in the past week.
On the technical front “if we can go past the pivotal $1,520-$1560 region, it would start to a look a lot bullish ... For it to move that far ahead we need to see more convincing sign for something darker on the horizon,” OANDA’s Erlam added.
On the investment side, holdings of SPDR Gold Trust, the world’s largest gold-backed exchange-traded fund, has gained about 1.8% this week and about 7.3% in 2019.
Precious metals funds recorded their fourth-largest inflows ever in the week to Wednesday and investment-grade funds sucked money in, Bank of America Merrill Lynch said on Friday.
Within equities, United States stocks funds suffered $15.2 billion in outflows in the same week, the most since December 2018, while emerging equity funds saw the biggest outflow since August 2015 at $6.2 billion, said BAML citing EPFR data.
The moves follow a tumultuous week in global markets, with China letting its yuan fall past the 7-per-dollar level marking the latest salvo in a trade dispute between Beijing and Washington and fresh fears emerging about a global economic pullback.
The yuan’s slide on Monday contributed to $12.4 billion exiting global equity funds, the 12th largest ever daily outflow from global equity funds, according to the data.
The volatility pushed investors to assets viewed as safe. A total of $2.3 billion poured into precious metal funds. $11 billion has now shifted into gold in the past 10 weeks, the biggest inflow since Brexit in 2016, BAML said.
As high-yield bond funds experienced the biggest outflow since December 2018, investment-grade bond funds notched up their 29th week of inflows, pulling in $6.7 billion.
U.S. President Donald Trump on Friday said he was not ready to make a deal with China and even called a September round of trade talks into question, reviving concerns on financial markets that the bilateral dispute is unlikely to end anytime soon.
“We’re talking with China. We’re not ready to make a deal - but we’ll see what happens,” Trump told reporters at the White House before departing for fundraisers on Long Island, New York.
“China wants to do something, but I’m not ready to do anything yet. Twenty-five years of abuse - I’m not ready so fast, so we’ll see how that works out,” he said.
At the same time Fathom informs on corporate debt problems in China and rising unemployment that hidden by official government.
When the global economy slowed, China offset the demand shortfall with a hefty stimulus package. This caused huge amounts of excess capacity in certain sectors, such as real estate where investment surged, creating a mass of housing mothballed into the construction phase or sitting dormant. In order to maintain house prices, the time taken to complete construction increased considerably, delaying the release of properties onto the market. Fathom estimates that there are now 50 million houses either vacant or still under construction in China — more than double the number of homes that exist in the whole of the UK.
As banks continue to provide finance for these unproductive projects, non-performing loans are on the rise. While official statistics put China’s non-performing loan rate at around 7% as a share of GDP, Fathom estimates this to be much higher at 28–38%. Such levels are ultimately unsustainable and unless policymakers deal with the ticking time bomb of non-performing loans, the risk of a banking crisis will remain elevated
Problems are not just limited to the real estate sector; while China’s official urban unemployment rate has remained flat at roughly 4% for over a decade, Fathom’s underemployment indicator — which highlights the number of workers either unemployed or engaged in unproductive activities — has swelled to 14% since 2008.
Prime among these is China’s Belt and Road Initiative, which plans to develop trade and transport infrastructure all over the world. With around half the countries in the world signed up and an estimated $400 billion already invested, there are growing concerns over China’s intentions, especially regarding the outcome if target countries cannot afford loan repayments. Fathom draws on similarities with the rise of the British Empire; the UK became the world’s largest manufacturing economy after the industrial revolution and would invest heavily in other countries in order to extract the resources required for production.
In terms of current trade tensions, Fathom’s view is that this is the beginning of a sustained period of geo-strategic rivalry with the US, with no clear end in sight. Tariffs are seen as a tactic to try and force China to change its behaviour, but Fathom questions labelling this a trade war, paraphrasing Ellis Carver from The Wire in reference to the War on Drugs: “You can’t call this…a war. Wars end”.
Finally, if take a look at recent CFTC report, we will see too heavy long position on Gold that comes to all time high. It means that retracement stands right around the corner. To keep upside bullish trend, you need stable demand, but when everybody have bought already, trend stops. This is the point that we're coming to:
That's being said, it's a safe bet that we have new long-term bullish trend on gold market and the view that we've expressed last year gradually is turning to reality. The problems in Chinese economy that are not widely presented in media tells that tariffs are working and in long-term perspective supports demand for safe haven assets. Also it agrees with our suggestion that tariffs is the tool in US hands, not in China hands and first of all they hit Chinese economy as it less protected in social sphere, more fragile on domestic basis.
Meantime, markets are gripped by a frenzy of golden rush, which resulted in overextended long positions and could become a reason for healthy retracement in near term perspective.
Technical
Monthly
Gold shows great performance on monthly chart, but taking in consideration recent CFTC report, we need to keep an eye on nearest targets that we have here.
As we mentioned last week, next two upside targets - 1530$ of 1.618 butterfly extension and 1655 as XOP target of the same major AB=CD pattern. XOP seems a bit too far, but butterfly extension is the one that we need. Besides, it stands relatively close to major 5/8 Fib resistance level of 1585 and monthly Overbought @1550$ area.
Thus, we put this area - 1530-1585 as tactical ceil at current moment and expect that gold will show healthy retracement out there by fundamental reasons that we've mentioned.
Weekly
On weekly chart market has two other extensions that stand in the same monthly area. This is larger AB-CD and minor ab-cd patterns. Both of them have XOPs in the same area - 1555-1570, which agrees with our monthly range.
Right now market stands at weekly overbought and butterfly target, but, as action to butterfly 1.618 extension point was too fast, I wouldn't say that gold definitely will turn down here, prior reaching of 1540-1585 area. Upside action probably will become slower, but gold should try to reach major targets by momentum. Still, we will keep in mind this point as well, if we will see something different on lower time frames.
Daily
Here market stands at Overbought as well, but we're more interested in oversold level here. Although on weekly chart minor retracement could be invisible, here, we still could get some reaction on weekly butterfly target.
Daily chart has its own XOP, which has not been hit yet, and suggests minor spike up, a kind of W&R action. This is the first point that we will keep an eye on next week. Second, if retracement indeed will happen, hardly it will be deeper than 1440 area. More probable is 1440-1460 K-area, or even minor pullback to 1470 level.
In current situation it is difficult to plan new bullish trades. Retracement, if even you do not want to trade it, could be useful as it will provide chances for long entry at better conditions.
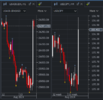
Intraday
On Friday we've mentioned possible DRPO "Sell" pattern on 4H chart and it has been confirmed by the end of the week as we've got 2nd close below 3x3 DMA. Everything seems good, but still two things worry me on this pattern. First is, we haven't seen the "second challenge" on 2nd top of DRPO, no attempt to continue upward action, no bulls' capitulation. Second top here looks more like retracement of 1st top. Besides, DRPO takes the shape of triangle.
Second is uncompleted daily XOP stands slightly above the market. These moments tell that some upside spike to 1522 area still could happen, but not necessary it will cancel idea of DRPO "Sell" pattern. If you plan short trades here - either wait for this spike to daily XOP or place stop orders somewhere above it.
Conclusion
Fundamental and technical analysis shows that gold keeps long-term bullish sentiment. In shorter-term perspective chances on retracement significantly increased. Although we suggest that it has more chances to happen from 1540-1585 area, but we also will keep an eye on current level, as weekly butterfly is done here as well.
The technical portion of Sive's analysis owes a great deal to Joe DiNapoli's methods, and uses a number of Joe's proprietary indicators. Please note that Sive's analysis is his own view of the market and is not endorsed by Joe DiNapoli or any related companies.
")