Sive Morten
Special Consultant to the FPA
- Messages
- 18,637
Fundamentals
This week was relatively calm as Gold most time has spent in consolidation after reaching 1530 major monthly target and former driving factors, such as new China tariffs and coming Fed more dovish policy have eased a bit.
As Reuters reports - Gold fell on Friday as stocks and the dollar firmed, but fears of a slowing global economy and lack of clarity on the U.S.-China trade war kept bullion on track for a third straight weekly gain.
“The dollar index is strengthening quite a bit, equity futures are coming back. ... We’re going back a bit to riskier assets,” said Phillip Streible, senior commodities strategist at RJO Futures, adding that gold could also be seeing some profit taking.
Hopes for more official economic stimulus for the economy and the easing of a bond market rally drove a broad rise in U.S. stocks on Friday, as a bruising week for markets drew to a close.
“On the daily charts gold still looks good, but we’ve have to get above that $1,546 in order to reignite new longs into the market,” Streible said.
Bullion has risen more than $100 since the beginning of the month amid falling global bond yields, heightened trade tensions and a slew of disappointing economic data globally.
Earlier this week, 10-year Treasury yields dropped below the two-year yield for the first time in 12 years. Curve inversion is widely considered a warning that the economy is headed for recession.
“There are lots of demand factors and drivers that are making the incremental gold buyer keep their eyes on the gold market,” said Michael Matousek, head trader at U.S. Global Investors.
“I anticipate gold pulling into about the $1,460 level. ... It’s still not breaking trend and that’d probably be a good level for people to start accumulating.”
U.S. President Donald Trump said on Thursday he believed China wanted to make a trade deal and that the dispute would be fairly short.
Beijing had vowed to counter the latest tariffs on Chinese goods but called on Washington to meet it halfway on a potential deal.
Investors will now focus on the U.S. Federal Reserve’s annual symposium next week for further hints on monetary easing.
On the technical side, spot gold may fall into a range of $1,483-$1,503 per ounce, according to Reuters technical analyst Wang Tao.
In another sign that investors were heading for shelter, precious metal funds saw the 11th week of inflows, bringing in $300 million.
CFTC data shows that net long positions on gold market stands at record highs, which makes difficult immediate upward acceleration. Although absolute 2016 peak of 316K contracts has not been reached, but position near 300K also left small room for solid growth.

Fathom also brings new report and interesting point of view on US-Sino tariffs piking. It mostly confirms our view that China starts to feel problems very soon and tariffs impact is more serious for Chinese economy rather than for US.
At Fathom, we have argued that tensions between the US and China should not be referred to as a trade war, because wars end. Events over the past few weeks, which have seen Donald Trump end a month-long truce by threatening additional tariffs on China’s exports, a subsequent depreciation of the renminbi and a prompt branding of Beijing as a currency manipulator by the US administration only lend weight to that long-held view. Consequently, while the escalation in trade tensions have unnerved financial markets, triggering a reassessment of the prospects for both global growth and a currency war, it is of little surprise to us. In fact, we have continued to argue that a weaker currency is part and parcel of China’s current growth strategy, devaluing in order to cushion the economic slowdown and offset the impact of tariffs.
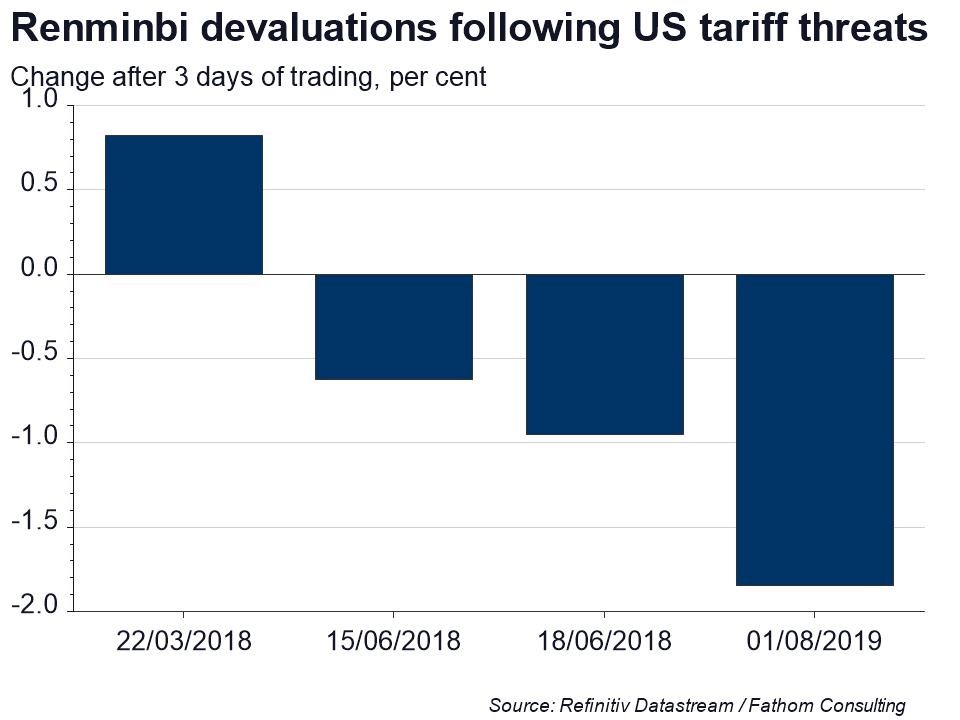
As highlighted in the chart, Beijing has fired warning shots, depreciating the currency whenever Donald Trump has made tariff threats, other than on the very first occasion. Each devaluation has grown progressively larger, with last week’s devaluation —in response to Donald Trump’s threat to impose 10% tariffs on an additional US$300 billion worth of Chinese goods — the largest. Originally set to take effect on 1 September, but since delayed to December, this would increase the total value of tariffed imports to US$550 billion, essentially all US imports from China.
Allowing the renminbi to weaken is not without risks for China, exemplified by the mass capital outflows caused by the devaluation of the renminbi in 2015. It also risks fuelling global imbalances and intensifying criticism of China’s policies. Nonetheless, as shown below, Beijing has now unwound all of the renminbi appreciation which occurred in the year after Donald Trump’s election victory in November 2016, when a deal appeared to be on the cards, and over the past year the currency has, by and large, moved in line with our own expectations.
Based on the offshore rate, the depreciation would be greater still were it not for the 2% trading band, defined by where the PBoC sets the mid-point as opposed to market forces. Indeed, the spread over the onshore rate has widened in recent weeks, as shown in the chart below. In the past, this spread has heralded further declines in the onshore value, which so far remains nowhere near weak enough to offset the US dollar price impact of Donald Trump’s tariffs in full. For that to happen, and assuming the latest tariff threat comes to pass, the USDCNY would need to fall to somewhere in the range of 7.6 to 8.7 — levels not seen since 2007.
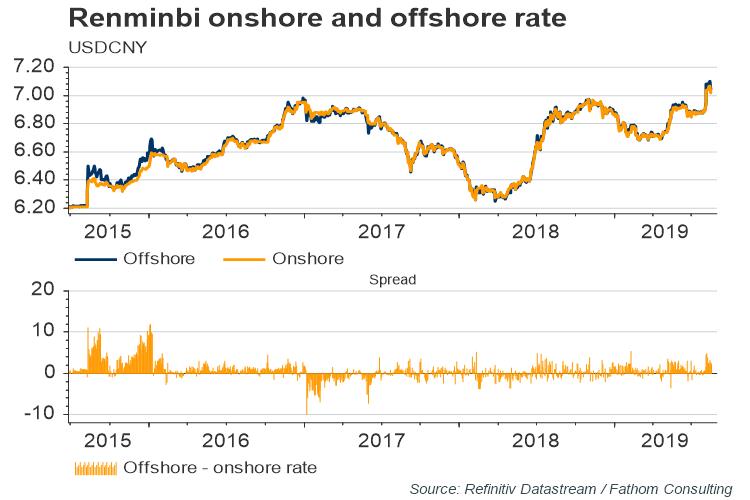
Having now breached the psychologically important threshold of 7.0, a depreciation of that ilk must be more likely. And although it is not our central scenario, if the economy continues to cool as we anticipate, then policymakers’ resolve is bound to be tested. A sharp depreciation would put downward pressure on global prices at a time when central banks are struggling to hit inflation targets. Our own view, as it has been for some time, is that renminbi depreciation has further to go, albeit steadily, as China’s policymakers tread carefully.
Technical
Monthly
Gold shows great performance on monthly chart, but taking in consideration recent CFTC report, we need to keep an eye on nearest targets that we have here.
As we mentioned last week, next two upside targets - 1530$ of 1.618 butterfly extension and 1655 as XOP target of the same major AB=CD pattern. XOP seems a bit too far, but butterfly extension is the one that we need. Besides, it stands relatively close to major 5/8 Fib resistance level of 1585 and monthly Overbought @1550$ area.
Thus, we put this area - 1530-1585 as tactical ceil at current moment and expect that gold will show healthy retracement out there by fundamental reasons that we've mentioned.
Butterfly target has been hit relatively fast. Pattern itself suggests 3/8 retracement as minimal target. Hardly butterfly will fail as it is accompanied by Overbought and major Fib resistance level.

Weekly
On weekly chart market has two other extensions that stand in the same monthly area. This is larger AB-CD and minor ab-cd patterns. Both of them have XOPs in the same area - 1555-1570, which agrees with our monthly range.
As we said last week, weekly butterfly hardly will hold market due too fast acceleration to its target. As a result, last week, indeed, gold has climbed slightly higher. Upside action probably will become slower, but gold could try to reach major targets by momentum. So, we do not totally deny scenarios when gold could reach 1560-1570 weekly targets. The daily and intraday performance should clarify whether gold will proceed higher or not, depending on patterns that we will get there.

Daily
On daily chart market doesn't hurry to show real reversal signs. Upside action slows a bit, but it seems that it is more probable due daily and weekly overbought. Here overall situation is better to treat as "indecision" as gold has formed High Wave pattern. As usual, market should follow in direction of breakout. As we have nothing on daily yet, the only thing that we could do is to watch for short-term intraday trading setups.
At the same time, taking long-term bullish position looks risky due overextended position, uncertainty among driving factors and relatively close standing major targets and resistance on monthly chart:

Intraday
It is surprisingly a bit, but gold indeed keeps the shape of diamond pattern. The lines of the pattern are parallel and price hits precisely these levels. By theory, diamond should be reversal pattern, although this pattern is quite rare. But the one thing exists that makes me doubt on bearish perspective - the sign of bullish dynamic pressure. While we have bearish trend on MACD (and divergence), price forms higher lows, which doesn't exclude upside breakout, whether it will be real or fake, anyway, market could create new top first.
Thus, as we always talk about this tool, when we have situation that relates to breakout direction, we could try to use stop entry orders again. For instance, scalp long trade could be taken by stop "Buy" order slightly below recent top of 1535 area, when diamond will be broken up, but top is not yet. The same story with downside breakout and Stop "sell" order around the lows of 1478. In fact these orders do not exclude each other and could be used "OCO" set.

Conclusion
Fundamental and technical analysis shows that gold keeps long-term bullish sentiment, but due technical overextension is coming to an area where chances on healthy pullback looks very probable.
Still, currently we do not have yet definite signs of reversal and keep watching on 1530-1570 area where this could happen.
The technical portion of Sive's analysis owes a great deal to Joe DiNapoli's methods, and uses a number of Joe's proprietary indicators. Please note that Sive's analysis is his own view of the market and is not endorsed by Joe DiNapoli or any related companies.
This week was relatively calm as Gold most time has spent in consolidation after reaching 1530 major monthly target and former driving factors, such as new China tariffs and coming Fed more dovish policy have eased a bit.
As Reuters reports - Gold fell on Friday as stocks and the dollar firmed, but fears of a slowing global economy and lack of clarity on the U.S.-China trade war kept bullion on track for a third straight weekly gain.
“The dollar index is strengthening quite a bit, equity futures are coming back. ... We’re going back a bit to riskier assets,” said Phillip Streible, senior commodities strategist at RJO Futures, adding that gold could also be seeing some profit taking.
Hopes for more official economic stimulus for the economy and the easing of a bond market rally drove a broad rise in U.S. stocks on Friday, as a bruising week for markets drew to a close.
“On the daily charts gold still looks good, but we’ve have to get above that $1,546 in order to reignite new longs into the market,” Streible said.
Bullion has risen more than $100 since the beginning of the month amid falling global bond yields, heightened trade tensions and a slew of disappointing economic data globally.
Earlier this week, 10-year Treasury yields dropped below the two-year yield for the first time in 12 years. Curve inversion is widely considered a warning that the economy is headed for recession.
“There are lots of demand factors and drivers that are making the incremental gold buyer keep their eyes on the gold market,” said Michael Matousek, head trader at U.S. Global Investors.
“I anticipate gold pulling into about the $1,460 level. ... It’s still not breaking trend and that’d probably be a good level for people to start accumulating.”
U.S. President Donald Trump said on Thursday he believed China wanted to make a trade deal and that the dispute would be fairly short.
Beijing had vowed to counter the latest tariffs on Chinese goods but called on Washington to meet it halfway on a potential deal.
Investors will now focus on the U.S. Federal Reserve’s annual symposium next week for further hints on monetary easing.
On the technical side, spot gold may fall into a range of $1,483-$1,503 per ounce, according to Reuters technical analyst Wang Tao.
In another sign that investors were heading for shelter, precious metal funds saw the 11th week of inflows, bringing in $300 million.
CFTC data shows that net long positions on gold market stands at record highs, which makes difficult immediate upward acceleration. Although absolute 2016 peak of 316K contracts has not been reached, but position near 300K also left small room for solid growth.
Fathom also brings new report and interesting point of view on US-Sino tariffs piking. It mostly confirms our view that China starts to feel problems very soon and tariffs impact is more serious for Chinese economy rather than for US.
At Fathom, we have argued that tensions between the US and China should not be referred to as a trade war, because wars end. Events over the past few weeks, which have seen Donald Trump end a month-long truce by threatening additional tariffs on China’s exports, a subsequent depreciation of the renminbi and a prompt branding of Beijing as a currency manipulator by the US administration only lend weight to that long-held view. Consequently, while the escalation in trade tensions have unnerved financial markets, triggering a reassessment of the prospects for both global growth and a currency war, it is of little surprise to us. In fact, we have continued to argue that a weaker currency is part and parcel of China’s current growth strategy, devaluing in order to cushion the economic slowdown and offset the impact of tariffs.
As highlighted in the chart, Beijing has fired warning shots, depreciating the currency whenever Donald Trump has made tariff threats, other than on the very first occasion. Each devaluation has grown progressively larger, with last week’s devaluation —in response to Donald Trump’s threat to impose 10% tariffs on an additional US$300 billion worth of Chinese goods — the largest. Originally set to take effect on 1 September, but since delayed to December, this would increase the total value of tariffed imports to US$550 billion, essentially all US imports from China.
Allowing the renminbi to weaken is not without risks for China, exemplified by the mass capital outflows caused by the devaluation of the renminbi in 2015. It also risks fuelling global imbalances and intensifying criticism of China’s policies. Nonetheless, as shown below, Beijing has now unwound all of the renminbi appreciation which occurred in the year after Donald Trump’s election victory in November 2016, when a deal appeared to be on the cards, and over the past year the currency has, by and large, moved in line with our own expectations.
Based on the offshore rate, the depreciation would be greater still were it not for the 2% trading band, defined by where the PBoC sets the mid-point as opposed to market forces. Indeed, the spread over the onshore rate has widened in recent weeks, as shown in the chart below. In the past, this spread has heralded further declines in the onshore value, which so far remains nowhere near weak enough to offset the US dollar price impact of Donald Trump’s tariffs in full. For that to happen, and assuming the latest tariff threat comes to pass, the USDCNY would need to fall to somewhere in the range of 7.6 to 8.7 — levels not seen since 2007.
Having now breached the psychologically important threshold of 7.0, a depreciation of that ilk must be more likely. And although it is not our central scenario, if the economy continues to cool as we anticipate, then policymakers’ resolve is bound to be tested. A sharp depreciation would put downward pressure on global prices at a time when central banks are struggling to hit inflation targets. Our own view, as it has been for some time, is that renminbi depreciation has further to go, albeit steadily, as China’s policymakers tread carefully.
Technical
Monthly
Gold shows great performance on monthly chart, but taking in consideration recent CFTC report, we need to keep an eye on nearest targets that we have here.
As we mentioned last week, next two upside targets - 1530$ of 1.618 butterfly extension and 1655 as XOP target of the same major AB=CD pattern. XOP seems a bit too far, but butterfly extension is the one that we need. Besides, it stands relatively close to major 5/8 Fib resistance level of 1585 and monthly Overbought @1550$ area.
Thus, we put this area - 1530-1585 as tactical ceil at current moment and expect that gold will show healthy retracement out there by fundamental reasons that we've mentioned.
Butterfly target has been hit relatively fast. Pattern itself suggests 3/8 retracement as minimal target. Hardly butterfly will fail as it is accompanied by Overbought and major Fib resistance level.
Weekly
On weekly chart market has two other extensions that stand in the same monthly area. This is larger AB-CD and minor ab-cd patterns. Both of them have XOPs in the same area - 1555-1570, which agrees with our monthly range.
As we said last week, weekly butterfly hardly will hold market due too fast acceleration to its target. As a result, last week, indeed, gold has climbed slightly higher. Upside action probably will become slower, but gold could try to reach major targets by momentum. So, we do not totally deny scenarios when gold could reach 1560-1570 weekly targets. The daily and intraday performance should clarify whether gold will proceed higher or not, depending on patterns that we will get there.
Daily
On daily chart market doesn't hurry to show real reversal signs. Upside action slows a bit, but it seems that it is more probable due daily and weekly overbought. Here overall situation is better to treat as "indecision" as gold has formed High Wave pattern. As usual, market should follow in direction of breakout. As we have nothing on daily yet, the only thing that we could do is to watch for short-term intraday trading setups.
At the same time, taking long-term bullish position looks risky due overextended position, uncertainty among driving factors and relatively close standing major targets and resistance on monthly chart:
Intraday
It is surprisingly a bit, but gold indeed keeps the shape of diamond pattern. The lines of the pattern are parallel and price hits precisely these levels. By theory, diamond should be reversal pattern, although this pattern is quite rare. But the one thing exists that makes me doubt on bearish perspective - the sign of bullish dynamic pressure. While we have bearish trend on MACD (and divergence), price forms higher lows, which doesn't exclude upside breakout, whether it will be real or fake, anyway, market could create new top first.
Thus, as we always talk about this tool, when we have situation that relates to breakout direction, we could try to use stop entry orders again. For instance, scalp long trade could be taken by stop "Buy" order slightly below recent top of 1535 area, when diamond will be broken up, but top is not yet. The same story with downside breakout and Stop "sell" order around the lows of 1478. In fact these orders do not exclude each other and could be used "OCO" set.
Conclusion
Fundamental and technical analysis shows that gold keeps long-term bullish sentiment, but due technical overextension is coming to an area where chances on healthy pullback looks very probable.
Still, currently we do not have yet definite signs of reversal and keep watching on 1530-1570 area where this could happen.
The technical portion of Sive's analysis owes a great deal to Joe DiNapoli's methods, and uses a number of Joe's proprietary indicators. Please note that Sive's analysis is his own view of the market and is not endorsed by Joe DiNapoli or any related companies.