Sive Morten
Special Consultant to the FPA
- Messages
- 18,644
Fundamentals
Gold market stands in much better environment compares to EUR, for example. Indeed, Fed has made its view more dovish, stock market turns to collapse and US yields have dropped significantly. A lot of global political problems also support demand for gold market.
Despite minor drop of the market on Friday, it stands at a good sentiment and upside pace. Recent drop mostly was due profit taking before long holidays. Besides, market has hit our major target that we were following within a month or so.
As Reuters reports - Gold fell on profit-taking on Friday, a day after bullion touched a near six-month high and the dollar rebounded, but the metal stayed on track for a weekly gain as the appetite for risk waned.
“There was some profit-taking as the US dollar remains resilient,” said Tai Wong, head of base and precious metals derivatives trading at BMO. “Friday’s data saw softer growth but price indicators like personal spending and per capita expenditure were stronger which could argue, at the margin, against a Fed rate hike pause.”
The U.S. economy slowed slightly more than previously estimated in the third quarter, but U.S. consumer spending increased solidly in November as households bought motor vehicles and spent more on utilities, data by the U.S. Commerce Department showed.
The dollar recovered, attracting safe-haven buying as persistent equity market turbulence and possibilities of a U.S. government shutdown taxed investors’ affinity for risk-taking.
U.S. President Donald Trump conceded there was a good chance the Senate would not approve his demand for $5 billion to fund his border wall project, and reiterated the likelihood of a government shutdown beginning at midnight.
Fears of a shutdown also compounded worries in stock markets, which extended a week-long sell-off, prompting some safe-haven inflows into bullion.
“It’s still a very keen risk-off mentality in the world marketplace heading into the weekend and into the Christmas holiday next week,” Kitco Metals senior analyst Jim Wyckoff wrote in a note.
Holdings of the SPDR Gold Trust GLD, the world’s largest gold-backed exchange-traded fund, slipped 0.3 percent on Thursday, after reaching a four-month high earlier this week.
COT Report
CFTC data also shows positive sentiment on the market. As speculators as hedger have increased their bullish positions. Open interest is increased as well:

So net speculative position stands bullish and continues increasing

Source: CFTC.gov
Charting by Investing.com
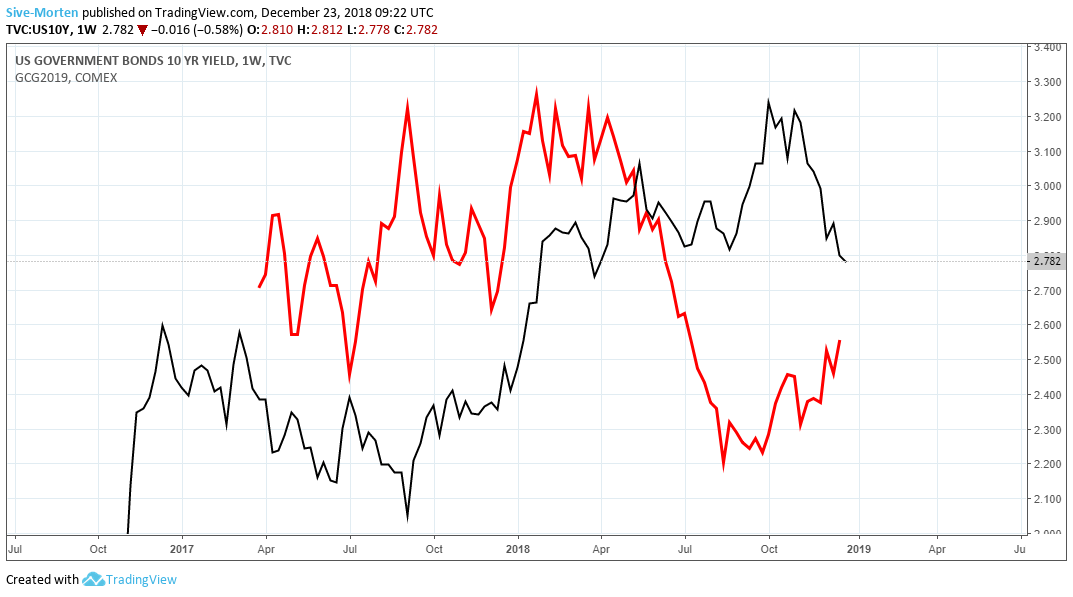
And here is relation between US 10-year yields and gold market. Recent drop below 2.8% level brings support to gold rally:
Technical
Monthly
Recent 4 months gold shows tight trading range. Currently we could recognize shape of flag consolidation, which, as a rule, becomes a continuation pattern. Now gold stands in the center of impact of different short-term and long-term factors. Long-term factors mostly are political and suggest changing of global political situation, breaking of Pax Americana global model. Avoiding too much talking on this subject we would say that so strong global shifts never could happen without big political events. This should provide big support to gold market. Now it is widely suggested that these processes should accelerate closer to 2020 year. For example, here is report by Fathom Consulting and their expectations to see world crisis around 2020.
In shorter-term perspective situation is unstable and subject to change. Just few weeks ago everybody thought that it is one more year of active Fed policy, so rate could be 3+% by the end of Fed cycle. Now situation has changed. Some factors appears, some changes and some are gone to passed. All these stuff put the shadow on gold price behavior. Inflation expectations have dropped significantly as in US as in EU now. If Fed will hold rate hike and stock market will keep head above the water - gold market remains under pressure. More aggressive interest rate policy and stock market collapse should provide support to gold.
As a result, targets on gold market vary. Today we take a look at specific picture, sometimes it is useful to search for harmony on the market. And we could find it, if we look carefully. In fact, recent action on gold market reminds reverse H&S shape but very choppy and extended it time. Important COP target has been hit and upside action has started. In fact we have mirror action to the right and to the left from COP point. Market forms approximately equal lows on both sides. The speed is also similar. Is it possible that reversal is forming? Why not. Now take a look we have trend line that was broken down here. If market will return back above it - this will be important bullish sign. Conversely, a kind of goodbye kiss will tell that price will drop further. Downside targets also different - from nearest weekly 1113 OP till 890$ of extended butterfly that we've mentioned last week.

Weekly
This time frame is our major one for making trading plan. On Friday 1265 target has been hit, but taking in consideration overall background that we have, we suggest that upside action has not bad chances on continuation. And, in general, technical picture will be looking more harmonic, if this action will continue.
In this case we get AB=CD pattern right to major 5/8 Fib resistance that gives as Agreement and re-testing of long-term monthly trend line. This should be decisive moment for gold market. "222" Sell pattern will in place. Downside reversal will lead us to 1113 OP target of large AB-CD pattern, while upside breakout of 1286 area could mean major upside reversal on gold market. This will be very important moment.

Daily
Daily chart shows that market should spend some time around achieved levels. This is strong resistance, daily Overbought, we have completed butterfly as well, so healthy retracement here has good chances to happen. Butterfly suggests that it should be somewhere to 1240 at least. Market has broken K-resistance area, so in fact it has free space till 1286 next level. Thus downside retracement could be smaller compares to previous retracement from OP of 1240 level, when it was right back down to the bottom of the channel.

Intraday
Next week will be short and starts only on Wednesday. Big players could hold operations till the next year, so indeed gold could stand with retracement for awhile.
Right now market forms nothing yet that could help us to estimate final target of retracement - no patterns or extensions. Now we have only minor AB-CD at top that suggests first action to 1251 K-support area and WPP, and potentially to XOP that also creates Agreement with 1245 Fib level. Potentially these levels are for scalp long positions. But for daily picture we need to wait larger pattern on 4H chart that could point on retracement floor. This small extension that we have on 1H chart probably will become a part of it.

Conclusion:
Market keeps positive sentiment which makes possible upside continuation to 1286 level within few weeks.
Since market will be thin till the end of the year, gold could turn to retracement action. 1286 will be vital for long-term perspective of the market as well.
Since market stands at 1265 resistance on coming week (it will be rather short) we mostly will be watching for downside pullback and try to estimate where it could finish.
The technical portion of Sive's analysis owes a great deal to Joe DiNapoli's methods, and uses a number of Joe's proprietary indicators. Please note that Sive's analysis is his own view of the market and is not endorsed by Joe DiNapoli or any related companies.
Gold market stands in much better environment compares to EUR, for example. Indeed, Fed has made its view more dovish, stock market turns to collapse and US yields have dropped significantly. A lot of global political problems also support demand for gold market.
Despite minor drop of the market on Friday, it stands at a good sentiment and upside pace. Recent drop mostly was due profit taking before long holidays. Besides, market has hit our major target that we were following within a month or so.
As Reuters reports - Gold fell on profit-taking on Friday, a day after bullion touched a near six-month high and the dollar rebounded, but the metal stayed on track for a weekly gain as the appetite for risk waned.
“There was some profit-taking as the US dollar remains resilient,” said Tai Wong, head of base and precious metals derivatives trading at BMO. “Friday’s data saw softer growth but price indicators like personal spending and per capita expenditure were stronger which could argue, at the margin, against a Fed rate hike pause.”
The U.S. economy slowed slightly more than previously estimated in the third quarter, but U.S. consumer spending increased solidly in November as households bought motor vehicles and spent more on utilities, data by the U.S. Commerce Department showed.
The dollar recovered, attracting safe-haven buying as persistent equity market turbulence and possibilities of a U.S. government shutdown taxed investors’ affinity for risk-taking.
U.S. President Donald Trump conceded there was a good chance the Senate would not approve his demand for $5 billion to fund his border wall project, and reiterated the likelihood of a government shutdown beginning at midnight.
Fears of a shutdown also compounded worries in stock markets, which extended a week-long sell-off, prompting some safe-haven inflows into bullion.
“It’s still a very keen risk-off mentality in the world marketplace heading into the weekend and into the Christmas holiday next week,” Kitco Metals senior analyst Jim Wyckoff wrote in a note.
Holdings of the SPDR Gold Trust GLD, the world’s largest gold-backed exchange-traded fund, slipped 0.3 percent on Thursday, after reaching a four-month high earlier this week.
COT Report
CFTC data also shows positive sentiment on the market. As speculators as hedger have increased their bullish positions. Open interest is increased as well:
So net speculative position stands bullish and continues increasing
Source: CFTC.gov
Charting by Investing.com
And here is relation between US 10-year yields and gold market. Recent drop below 2.8% level brings support to gold rally:
Technical
Monthly
Recent 4 months gold shows tight trading range. Currently we could recognize shape of flag consolidation, which, as a rule, becomes a continuation pattern. Now gold stands in the center of impact of different short-term and long-term factors. Long-term factors mostly are political and suggest changing of global political situation, breaking of Pax Americana global model. Avoiding too much talking on this subject we would say that so strong global shifts never could happen without big political events. This should provide big support to gold market. Now it is widely suggested that these processes should accelerate closer to 2020 year. For example, here is report by Fathom Consulting and their expectations to see world crisis around 2020.
In shorter-term perspective situation is unstable and subject to change. Just few weeks ago everybody thought that it is one more year of active Fed policy, so rate could be 3+% by the end of Fed cycle. Now situation has changed. Some factors appears, some changes and some are gone to passed. All these stuff put the shadow on gold price behavior. Inflation expectations have dropped significantly as in US as in EU now. If Fed will hold rate hike and stock market will keep head above the water - gold market remains under pressure. More aggressive interest rate policy and stock market collapse should provide support to gold.
As a result, targets on gold market vary. Today we take a look at specific picture, sometimes it is useful to search for harmony on the market. And we could find it, if we look carefully. In fact, recent action on gold market reminds reverse H&S shape but very choppy and extended it time. Important COP target has been hit and upside action has started. In fact we have mirror action to the right and to the left from COP point. Market forms approximately equal lows on both sides. The speed is also similar. Is it possible that reversal is forming? Why not. Now take a look we have trend line that was broken down here. If market will return back above it - this will be important bullish sign. Conversely, a kind of goodbye kiss will tell that price will drop further. Downside targets also different - from nearest weekly 1113 OP till 890$ of extended butterfly that we've mentioned last week.
Weekly
This time frame is our major one for making trading plan. On Friday 1265 target has been hit, but taking in consideration overall background that we have, we suggest that upside action has not bad chances on continuation. And, in general, technical picture will be looking more harmonic, if this action will continue.
In this case we get AB=CD pattern right to major 5/8 Fib resistance that gives as Agreement and re-testing of long-term monthly trend line. This should be decisive moment for gold market. "222" Sell pattern will in place. Downside reversal will lead us to 1113 OP target of large AB-CD pattern, while upside breakout of 1286 area could mean major upside reversal on gold market. This will be very important moment.
Daily
Daily chart shows that market should spend some time around achieved levels. This is strong resistance, daily Overbought, we have completed butterfly as well, so healthy retracement here has good chances to happen. Butterfly suggests that it should be somewhere to 1240 at least. Market has broken K-resistance area, so in fact it has free space till 1286 next level. Thus downside retracement could be smaller compares to previous retracement from OP of 1240 level, when it was right back down to the bottom of the channel.
Intraday
Next week will be short and starts only on Wednesday. Big players could hold operations till the next year, so indeed gold could stand with retracement for awhile.
Right now market forms nothing yet that could help us to estimate final target of retracement - no patterns or extensions. Now we have only minor AB-CD at top that suggests first action to 1251 K-support area and WPP, and potentially to XOP that also creates Agreement with 1245 Fib level. Potentially these levels are for scalp long positions. But for daily picture we need to wait larger pattern on 4H chart that could point on retracement floor. This small extension that we have on 1H chart probably will become a part of it.
Conclusion:
Market keeps positive sentiment which makes possible upside continuation to 1286 level within few weeks.
Since market will be thin till the end of the year, gold could turn to retracement action. 1286 will be vital for long-term perspective of the market as well.
Since market stands at 1265 resistance on coming week (it will be rather short) we mostly will be watching for downside pullback and try to estimate where it could finish.
The technical portion of Sive's analysis owes a great deal to Joe DiNapoli's methods, and uses a number of Joe's proprietary indicators. Please note that Sive's analysis is his own view of the market and is not endorsed by Joe DiNapoli or any related companies.
")