Sive Morten
Special Consultant to the FPA
- Messages
- 18,659
Fundamentals
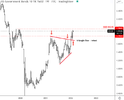
For the gold market it was a choppy week as for all the others, but, at the same time, it was not as decisive as for the EUR currency. After going forward and back again gold ends the week above 1800$ area, despite deep drops through the period. Data that we've got have mixed effects. While bullish turn from ECB should make pressure on the dollar and correspondingly support the gold, rising inflation, real interest rates, and massive appreciation of major currencies due to hawkish central banks steps become a headwind for the gold.
Market overview
Gold prices edged up on Monday even as expectations for interest rate hikes by the U.S. Federal Reserve put non-yielding bullion on track for its worst monthly performance since September. The Fed plans to raise rates in March on the assumption the economy will largely steer clear of fallout from the Omicron coronavirus variant and keep growing at a healthy clip.
An employment report from ADP showed U.S. private payrolls unexpectedly fell in January, pressuring the dollar and Treasury yields. Bolstering bullion's appeal, U.S. President Joe Biden approved sending additional forces to eastern Europe over a Russian threat to invade Ukraine. Although gold is considered a hedge against higher inflation and geopolitical risks, interest rate hikes remain a potential headwind since that translates into a higher opportunity cost of holding non-yielding bullion.
Gold prices steadied on Thursday, as a weaker dollar and risk-off sentiment in the equity markets helped counteract the pressure from a jump in U.S. Treasury yields. Benchmark 10-year note yields jumped to 1.838%, its highest in nearly a week after a hawkish rate hike by the Bank of England boosted investors' expectations towards similar moves by the U.S. central bank. Fed officials have signaled they will start raising interest rates next month to fight high inflation.
Gold prices edged higher in choppy trade on Friday as growing inflation worries helped cushion pressure from a firmer dollar and higher U.S. Treasury yields after a surprisingly upbeat U.S. jobs data. An unexpected jump in U.S. job growth in January fanned fears around inflation and weighed on risk sentiment among investors. Data showed U.S. nonfarm payrolls increased by 467,000 jobs last month.
Gold prices have retreated since scaling a 1-1/12 month high in late January after the Fed signaled an interest rate hike in March.
Not the Fed only - massive Price hikes in the US
From Hershey to Clorox and Kleenex maker Kimberly-Clark, major consumer-products companies have announced plans to boost U.S. prices further or more broadly than previously proposed this year, signaling that the fastest inflation rate in a generation may not ebb soon.Product makers generally hold conversations with U.S. retailers at year-end about price hikes planned for the following year. But company executives disclosed during recent quarterly results that they are taking a more aggressive approach this year to protect margins.
Clorox late on Thursday said it plans to raise prices on 85% of its products by the end of June, up from a previously planned 70%, with some of the company's brands set for multiple rounds of price hikes.
Chocolate maker Hershey said it would raise prices further in the first half of 2022 in the United States on top of price increases that will go into effect in the first quarter ended March 31, 2022. Kimberly-Clark said last week it would undertake more price increases -- following four rounds of price hikes in 2021 -- as pulp, labor, and transportation costs continue to bite.
Pandemic-driven supply-and-demand imbalances have pushed up prices on everything from Big Macs to household staples, which caused the U.S. inflation rate in 2021 to climb at its fastest pace in nearly four decades. The comments from executives on post-earnings calls show that firms are grappling with higher costs on nuts and vegetable oils, surfactants, and plastics as global supply chain glitches linger. Transportation and labor costs are also up.
Cadbury Chocolate and Oreo cookies maker Mondelez International last month disclosed that there could be "multiple pricing waves" this year to keep up with inflation. At Procter & Gamble executives said the company plans to raise prices on some of its personal healthcare products In mid-April.
Energy prices for millions of British households are set to soar from April after the energy regulator said on Thursday that it would raise its cap on the most widely used tariffs by 54% due to record global gas prices. The rise comes amid a cost of living crisis as inflation and food costs rise. Regulator Ofgem said it had no choice but to raise the cap, which covers around 22 million households, following record global gas prices last year.
To ease the impact, the government will now provide state-backed loans to energy providers to spread the higher costs over five years, worth 200 pounds to consumers from October. A 150-pound rebate on local taxes will also apply to around 80% of households in England.
Governments across Europe have spent tens of billions of euros trying to shield consumers from record energy prices, either removing taxes or supporting the neediest, after gas and power costs spiked when economies reopened from COVID-19 lockdowns
Supply bottlenecks and China performance
Meantime, strong U.S. demand for goods from Asia during the pandemic has boosted imports, clogging West Coast ports. Some ocean vessels have left the United States carrying empty containers after making deliveries, rather than waiting to fill ships with American goods for export.
Ships delivering cargo at ports in Los Angeles and Long Beach, California, have also skipped Oakland, a major hub for agricultural exports, to return to Asia more quickly. Oakland's export volume in 2021 declined 8% from the previous year, the port said, hurting shipments of products like nuts, dairy and produce.
In the first nine months of 2021, shipping disruptions cost the U.S. dairy industry about $1.3 billion due to lost business and higher shipping and storage costs, said Jaime Castaneda, executive vice president of the U.S. Dairy Export Council and National Milk Producers Federation. Some importers canceled orders because of delays, forcing U.S. producers to resell their goods at a discount, Castaneda said.
The Chinese authorities have not taken advantage of the economic tailwinds of their strong, early recovery from the pandemic recession to rebalance their economy. China entered the pandemic recession first among the major economies and exited first, growing extremely rapidly in the second half of 2020. The easily achievable growth target for 2021 presented the ideal opportunity to shift the balance of its growth towards the consumer – but the opportunity was not taken, as downside risks to growth arising from rebalancing were judged to be too great. The consequence could be longer-term underperformance.
On the geopolitical side, US-Sino relations have not reverted to their pre-Trump status with the election of Biden. Our view was that there had been a sea-change in the stance of the US towards China ahead of the election of President Trump, on both sides of the political divide. In fact, if anything, the relationship has become more antagonistic.

China’s GDP growth slowed to just 4% on a year-on-year basis in the fourth quarter, affected by weakness in the real estate sector, power outages, and the government’s zero-tolerance response to fresh COVID-19 outbreaks. Purchasing managers’ surveys suggest that this softness in activity continued in January, despite recent policy easing by the authorities. The official NBS Manufacturing PMI fell to just 50.1 from 50.3 previously – only slightly above the 50 level that separates expansion from contraction. Its non-manufacturing counterpart declined to 51.1 from 52.7. The Caixin Manufacturing PMI also fell from 50.9 to 49.1 – its weakest since February 2020. Amid ongoing weakness in activity and with the all-important 20th National Party Congress occurring later this year, Fathom expects further policy easing. Nevertheless, the Chinese economy will face a number of major downside risks in 2022.

Data also shows no significant relief in shipping costs from China to the US and Europe:

The HARPEX (HARPER PETERSEN) Index reflects the worldwide price development on the charter market for container ships, stands at 2 year highs:

Last week we also have considered the NY Fed Global Supply Chains Pressures Index (GSCPI), which shows the level of global problems with goods delivery, using multiple indicators data. Based on the recent Dec 2021 data - it stands near all-time high as well:

Despite the good 2021 Chinese export numbers that we've considered last week, it seems that the US geopolitical strategy to hold China by creating artificial bottlenecks in supply chains is working and bringing some fruits. Simultaneously by making goods more expensive inside the US they reduce the demand for Chinese goods among the population.
A U.S. extension of tariffs on solar products distorts international trade and hinders the development of clean, low-emission energy, China's commerce ministry said on Saturday. President Joe Biden on Friday extended Trump-era tariffs on imported solar-energy equipment for four years, though he eased the terms to exclude bifacial panels that generate power on both sides, which are dominant among big U.S. projects. Donald Trump imposed tariffs on solar imports in 2018, using authority under section 201 of a 1974 trade law. The levies started at 30% and declined to 15%.
With the new China/Russia $117+ Bln agreements pack and Russia/China turning to Latin America and Argentina in particular, the pressure on China should exacerbate. Just a day before that V. Putin also met with Argentina's leader Alberto Fernandez. Argentina has a long-term conflict with Britain over Falklands, so this is not just about the economy but about geopolitics as well.
Finally, the London Metal Exchange (LME) index of base metals surged 38% higher last year as pandemic demand recovery met supply chain disruption. That, however, maybe for the super-charged rally, according to base metals analysts participating in Reuters' January poll. Median forecasts imply a retreat from current price levels over the course of 2022, the pull-back becoming more pronounced next year. Market balances are expected to shift from supply deficit towards surplus in 2023 as production recovers and demand cools, particularly in China.
Chinese factory activity shows signs of stalling, with both official and the Caixin purchasing managers indices slipping in January, the latter dropping to a 23-month low. The negative implications for metals consumption is the area of greatest concern for analysts and explain why many have turned more conservative in their price outlook. Capital Economics for example argues that "with Chinese demand unlikely to bounce back meaningfully this year, we continue to expect sharp falls in industrial metals prices by year-end". Chinese policymakers may open the stimulus taps to steady the economic boat, but the Evergrande saga is a warning that problems in the construction sector - a key driver of metals demand - may be as much structural as cyclical.

COT Report
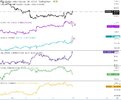
Short-term data shows the deteriorating sentiment on the market. This week we see a collapse in the net long position of the gold and closing of more than 10% of total open interest. The bulk of closing stands for speculators while hedgers also have closed positions against potential gold rising. Still data has been released before inflationary NFP report and SPDR fund shows minor drop in storages by far:


In long term, looking back to 2020, the commodity macro-group of the six Lipper classifications saw steady weekly inflows at the start of the pandemic. Throughout 2020 M2 money supply grew astronomically, and investors rushed into these funds that primarily invest in commodity-linked derivatives or physicals. In 2020, $36.8 billion flooded into these funds.
Last year, however, was not so friendly for the macro-group as the six Lipper classifications witnessed a total of $9.0 billion in outflows. Lipper Commodities Precious Metals Funds saw the largest total outflows under the macro-group throughout the calendar year (-$11.4 billion). The tides may be turning, so far year to date the macro-group has attracted $3.7 billion and has only logged one weekly net outflow.

As a bottom line:
The short-term perspective doesn't look too inspiring for the gold market. Although further anticipation of hawkish policy from the ECB and BoE should keep some pressure on the USD, recent massive out of the asset and rising of the real interest rates suppose that ride could be bumpy and we could get wobbling market with wide swings. The important question is the chance for a 50 b.p. rate change in March. Currently, it is priced at 40-50%. With two more data releases ahead of the March meeting, investors closely will be watching for inflation data and basic economic statistics. This probably becomes the dominant factor for the nearest 2 months. Currently, we suggest that 0.5% rate change has not big chance to happen and Fed tries to compensate moderate hike pace with QT adoption. But if inflation accelerates more in Feb and March, the situation could change.
Long term picture looks moderately positive to the Gold. We think that the last bulls' word is not said yet. Whatever happens in the geopolitical sphere it always supports the gold price. And whoever starts taking the lead, Russia or US/NATO - it will be a loud and painful process for the economy, but the golden time for the precious metals. The question is only about the scale and the way of contradiction. Massive price hike for the population across the Globe changes the mentality of the people and it might be a chain reaction with demanding higher wage due to inflation rumors. Fed could lag behind the inflation pace that many economists already talk about. Besides, nobody knows currently how strong the recovery is. There are some fears that Fed tightening policy could start hurting economic recovery earlier than it is widely expected. So we have a moderately optimistic view of the gold market in the perspective of 2-5 years. Still, the moment for investing stands ahead, and gold could drop under the impact of short-term bearish factors first, before major recovery starts.
For the gold market it was a choppy week as for all the others, but, at the same time, it was not as decisive as for the EUR currency. After going forward and back again gold ends the week above 1800$ area, despite deep drops through the period. Data that we've got have mixed effects. While bullish turn from ECB should make pressure on the dollar and correspondingly support the gold, rising inflation, real interest rates, and massive appreciation of major currencies due to hawkish central banks steps become a headwind for the gold.
Market overview
Gold prices edged up on Monday even as expectations for interest rate hikes by the U.S. Federal Reserve put non-yielding bullion on track for its worst monthly performance since September. The Fed plans to raise rates in March on the assumption the economy will largely steer clear of fallout from the Omicron coronavirus variant and keep growing at a healthy clip.
The dollar has risen against other currencies based on expectations of Fed rate hikes, while other central banks haven't really started to move yet, which has created a problem for gold, said Bob Haberkorn, senior market strategist at RJO Futures. The reality of five Fed rate hikes possibly this year has spooked the gold market a little bit, and gold is competing with bonds since it doesn't earn interest, Haberkorn added.
An employment report from ADP showed U.S. private payrolls unexpectedly fell in January, pressuring the dollar and Treasury yields. Bolstering bullion's appeal, U.S. President Joe Biden approved sending additional forces to eastern Europe over a Russian threat to invade Ukraine. Although gold is considered a hedge against higher inflation and geopolitical risks, interest rate hikes remain a potential headwind since that translates into a higher opportunity cost of holding non-yielding bullion.
Gold is still hovering above $1,800 and a lot of that has to do with Treasury yields having been "exhausted" and with the dollar still near today's lows after the private payrolls data, said Edward Moya, senior market analyst at brokerage OANDA. If gold can continue to stabilize above $1,800, some more investors will probably start to come back in, Moya added.
"Continued short covering and perceived bargain buying" are helping gold and silver prices, Jim Wyckoff, a senior analyst at Kitco Metals, said in a note. "A slumping U.S. dollar index and crude oil prices hitting seven-year highs this week are bullish outside market forces for the metals markets," Wyckoff added.
Gold prices steadied on Thursday, as a weaker dollar and risk-off sentiment in the equity markets helped counteract the pressure from a jump in U.S. Treasury yields. Benchmark 10-year note yields jumped to 1.838%, its highest in nearly a week after a hawkish rate hike by the Bank of England boosted investors' expectations towards similar moves by the U.S. central bank. Fed officials have signaled they will start raising interest rates next month to fight high inflation.
"Gold is once again being hit by the fact that central banks are gradually coming around to the idea that tightening is going to be warranted to get inflation under control," said Craig Erlam, senior market analyst at OANDA. "It's clear the central bank is the latest to accept it underestimated the inflation problem and markets are now pricing in multiple hikes."
Gold prices edged higher in choppy trade on Friday as growing inflation worries helped cushion pressure from a firmer dollar and higher U.S. Treasury yields after a surprisingly upbeat U.S. jobs data. An unexpected jump in U.S. job growth in January fanned fears around inflation and weighed on risk sentiment among investors. Data showed U.S. nonfarm payrolls increased by 467,000 jobs last month.
"We continue to see inflationary pressures build in the economy. As a result, the expectation is the Federal Reserve will take measures to fight it," said David Meger, director of metals trading at High Ridge Futures. However, this creates the push-pull we're seeing in the gold market supported by those inflationary pressures."
Gold prices have retreated since scaling a 1-1/12 month high in late January after the Fed signaled an interest rate hike in March.
On the technical front, "the $1,800 level is key for gold and if gold can continue to hover around it, that would be very positive for bullion bulls," Edward Moya, senior market analyst at brokerage OANDA, wrote in a note.
Not the Fed only - massive Price hikes in the US
From Hershey to Clorox and Kleenex maker Kimberly-Clark, major consumer-products companies have announced plans to boost U.S. prices further or more broadly than previously proposed this year, signaling that the fastest inflation rate in a generation may not ebb soon.Product makers generally hold conversations with U.S. retailers at year-end about price hikes planned for the following year. But company executives disclosed during recent quarterly results that they are taking a more aggressive approach this year to protect margins.
Clorox late on Thursday said it plans to raise prices on 85% of its products by the end of June, up from a previously planned 70%, with some of the company's brands set for multiple rounds of price hikes.
CFO Kevin Jacobsen said its executives are "having conversations with retailers" about additional price increases that would go into effect during the next two quarters, beyond those previously disclosed in October. We stand prepared to take more pricing (action) if necessary," Jacobsen said. "We want to see how inflation will play out this fiscal year," which ends June 30, 2022.
Chocolate maker Hershey said it would raise prices further in the first half of 2022 in the United States on top of price increases that will go into effect in the first quarter ended March 31, 2022. Kimberly-Clark said last week it would undertake more price increases -- following four rounds of price hikes in 2021 -- as pulp, labor, and transportation costs continue to bite.
Pandemic-driven supply-and-demand imbalances have pushed up prices on everything from Big Macs to household staples, which caused the U.S. inflation rate in 2021 to climb at its fastest pace in nearly four decades. The comments from executives on post-earnings calls show that firms are grappling with higher costs on nuts and vegetable oils, surfactants, and plastics as global supply chain glitches linger. Transportation and labor costs are also up.
At Clorox, Jacobsen described an "extreme level of cost inflation." The bleach maker cut its full-year earnings forecast and said it expects its full-year gross margin to shrink by about 750 basis points (7,5%). I do think it's going to take several years for us to rebuild margin (to pre-pandemic levels)," Jacobsen said on a call with analysts.
Cadbury Chocolate and Oreo cookies maker Mondelez International last month disclosed that there could be "multiple pricing waves" this year to keep up with inflation. At Procter & Gamble executives said the company plans to raise prices on some of its personal healthcare products In mid-April.
Energy prices for millions of British households are set to soar from April after the energy regulator said on Thursday that it would raise its cap on the most widely used tariffs by 54% due to record global gas prices. The rise comes amid a cost of living crisis as inflation and food costs rise. Regulator Ofgem said it had no choice but to raise the cap, which covers around 22 million households, following record global gas prices last year.
To ease the impact, the government will now provide state-backed loans to energy providers to spread the higher costs over five years, worth 200 pounds to consumers from October. A 150-pound rebate on local taxes will also apply to around 80% of households in England.
Governments across Europe have spent tens of billions of euros trying to shield consumers from record energy prices, either removing taxes or supporting the neediest, after gas and power costs spiked when economies reopened from COVID-19 lockdowns
Supply bottlenecks and China performance
Meantime, strong U.S. demand for goods from Asia during the pandemic has boosted imports, clogging West Coast ports. Some ocean vessels have left the United States carrying empty containers after making deliveries, rather than waiting to fill ships with American goods for export.
Ships delivering cargo at ports in Los Angeles and Long Beach, California, have also skipped Oakland, a major hub for agricultural exports, to return to Asia more quickly. Oakland's export volume in 2021 declined 8% from the previous year, the port said, hurting shipments of products like nuts, dairy and produce.
In the first nine months of 2021, shipping disruptions cost the U.S. dairy industry about $1.3 billion due to lost business and higher shipping and storage costs, said Jaime Castaneda, executive vice president of the U.S. Dairy Export Council and National Milk Producers Federation. Some importers canceled orders because of delays, forcing U.S. producers to resell their goods at a discount, Castaneda said.
Such delays contributed to a 57% surge in the company's supply-chain costs last year, Durkin said. Costs are expected to jump another 50% in 2022, with a third of the increase related to exports, he said.
The Chinese authorities have not taken advantage of the economic tailwinds of their strong, early recovery from the pandemic recession to rebalance their economy. China entered the pandemic recession first among the major economies and exited first, growing extremely rapidly in the second half of 2020. The easily achievable growth target for 2021 presented the ideal opportunity to shift the balance of its growth towards the consumer – but the opportunity was not taken, as downside risks to growth arising from rebalancing were judged to be too great. The consequence could be longer-term underperformance.
On the geopolitical side, US-Sino relations have not reverted to their pre-Trump status with the election of Biden. Our view was that there had been a sea-change in the stance of the US towards China ahead of the election of President Trump, on both sides of the political divide. In fact, if anything, the relationship has become more antagonistic.
China’s GDP growth slowed to just 4% on a year-on-year basis in the fourth quarter, affected by weakness in the real estate sector, power outages, and the government’s zero-tolerance response to fresh COVID-19 outbreaks. Purchasing managers’ surveys suggest that this softness in activity continued in January, despite recent policy easing by the authorities. The official NBS Manufacturing PMI fell to just 50.1 from 50.3 previously – only slightly above the 50 level that separates expansion from contraction. Its non-manufacturing counterpart declined to 51.1 from 52.7. The Caixin Manufacturing PMI also fell from 50.9 to 49.1 – its weakest since February 2020. Amid ongoing weakness in activity and with the all-important 20th National Party Congress occurring later this year, Fathom expects further policy easing. Nevertheless, the Chinese economy will face a number of major downside risks in 2022.
Data also shows no significant relief in shipping costs from China to the US and Europe:
The HARPEX (HARPER PETERSEN) Index reflects the worldwide price development on the charter market for container ships, stands at 2 year highs:
Last week we also have considered the NY Fed Global Supply Chains Pressures Index (GSCPI), which shows the level of global problems with goods delivery, using multiple indicators data. Based on the recent Dec 2021 data - it stands near all-time high as well:
Despite the good 2021 Chinese export numbers that we've considered last week, it seems that the US geopolitical strategy to hold China by creating artificial bottlenecks in supply chains is working and bringing some fruits. Simultaneously by making goods more expensive inside the US they reduce the demand for Chinese goods among the population.
A U.S. extension of tariffs on solar products distorts international trade and hinders the development of clean, low-emission energy, China's commerce ministry said on Saturday. President Joe Biden on Friday extended Trump-era tariffs on imported solar-energy equipment for four years, though he eased the terms to exclude bifacial panels that generate power on both sides, which are dominant among big U.S. projects. Donald Trump imposed tariffs on solar imports in 2018, using authority under section 201 of a 1974 trade law. The levies started at 30% and declined to 15%.
With the new China/Russia $117+ Bln agreements pack and Russia/China turning to Latin America and Argentina in particular, the pressure on China should exacerbate. Just a day before that V. Putin also met with Argentina's leader Alberto Fernandez. Argentina has a long-term conflict with Britain over Falklands, so this is not just about the economy but about geopolitics as well.
White House press secretary Jen Psaki warns that a "destabilizing conflict in Europe would impact China's interests all over the world," after the leaders of Russia and China meet in Beijing. (Feb. 4)
Finally, the London Metal Exchange (LME) index of base metals surged 38% higher last year as pandemic demand recovery met supply chain disruption. That, however, maybe for the super-charged rally, according to base metals analysts participating in Reuters' January poll. Median forecasts imply a retreat from current price levels over the course of 2022, the pull-back becoming more pronounced next year. Market balances are expected to shift from supply deficit towards surplus in 2023 as production recovers and demand cools, particularly in China.
Chinese factory activity shows signs of stalling, with both official and the Caixin purchasing managers indices slipping in January, the latter dropping to a 23-month low. The negative implications for metals consumption is the area of greatest concern for analysts and explain why many have turned more conservative in their price outlook. Capital Economics for example argues that "with Chinese demand unlikely to bounce back meaningfully this year, we continue to expect sharp falls in industrial metals prices by year-end". Chinese policymakers may open the stimulus taps to steady the economic boat, but the Evergrande saga is a warning that problems in the construction sector - a key driver of metals demand - may be as much structural as cyclical.
COT Report
Short-term data shows the deteriorating sentiment on the market. This week we see a collapse in the net long position of the gold and closing of more than 10% of total open interest. The bulk of closing stands for speculators while hedgers also have closed positions against potential gold rising. Still data has been released before inflationary NFP report and SPDR fund shows minor drop in storages by far:
In long term, looking back to 2020, the commodity macro-group of the six Lipper classifications saw steady weekly inflows at the start of the pandemic. Throughout 2020 M2 money supply grew astronomically, and investors rushed into these funds that primarily invest in commodity-linked derivatives or physicals. In 2020, $36.8 billion flooded into these funds.
Last year, however, was not so friendly for the macro-group as the six Lipper classifications witnessed a total of $9.0 billion in outflows. Lipper Commodities Precious Metals Funds saw the largest total outflows under the macro-group throughout the calendar year (-$11.4 billion). The tides may be turning, so far year to date the macro-group has attracted $3.7 billion and has only logged one weekly net outflow.
As a bottom line:
The short-term perspective doesn't look too inspiring for the gold market. Although further anticipation of hawkish policy from the ECB and BoE should keep some pressure on the USD, recent massive out of the asset and rising of the real interest rates suppose that ride could be bumpy and we could get wobbling market with wide swings. The important question is the chance for a 50 b.p. rate change in March. Currently, it is priced at 40-50%. With two more data releases ahead of the March meeting, investors closely will be watching for inflation data and basic economic statistics. This probably becomes the dominant factor for the nearest 2 months. Currently, we suggest that 0.5% rate change has not big chance to happen and Fed tries to compensate moderate hike pace with QT adoption. But if inflation accelerates more in Feb and March, the situation could change.
Long term picture looks moderately positive to the Gold. We think that the last bulls' word is not said yet. Whatever happens in the geopolitical sphere it always supports the gold price. And whoever starts taking the lead, Russia or US/NATO - it will be a loud and painful process for the economy, but the golden time for the precious metals. The question is only about the scale and the way of contradiction. Massive price hike for the population across the Globe changes the mentality of the people and it might be a chain reaction with demanding higher wage due to inflation rumors. Fed could lag behind the inflation pace that many economists already talk about. Besides, nobody knows currently how strong the recovery is. There are some fears that Fed tightening policy could start hurting economic recovery earlier than it is widely expected. So we have a moderately optimistic view of the gold market in the perspective of 2-5 years. Still, the moment for investing stands ahead, and gold could drop under the impact of short-term bearish factors first, before major recovery starts.