Sive Morten
Special Consultant to the FPA
- Messages
- 18,648
Fundamentals
This week gold has become the hostage of interest rate dynamic. In recent time, this relation stands very tight, so we even take a look at it in daily updates. In fact, our intraday setups and anticipation of downside breakout of recent lows is done. But when this nightmare to gold could be over or at least to stop for awhile. We suggest it might happen ones yields hit 1.40-1.42% area. On the gold market it should coincide with reaching weekly OP target.
Market overview
Gold prices edged higher on Friday, recovering from a more than seven-month low hit earlier as the U.S. dollar eased, but rising Treasury yields kept bullion on course for its biggest weekly drop since early January. The safe-haven metal was down about 2.4% so far this week, its biggest weekly drop since the week of Jan. 8.
"The drop in the U.S. dollar has likely driven gold higher," said Bart Melek, head of commodity strategies at TD Securities, adding the move could also be technical in nature. (However), the problem (for gold) continues to be the yields, and we continue to see rates across the curve move higher," Melek added.
Benchmark U.S. Treasury yields rose to a near one-year high earlier. Gold should still benefit from continued loose monetary policy and low real interest rates this year, analysts said. Commerzbank analysts said in a note that gold's behavior resembled that of a tsunami, with prices receding in the first phase before coming back all the more violently.
"As long as yields move higher, the market is simply going to struggle to find a footing," said Saxo Bank analyst Ole Hansen, adding that if the metal fails to hold the $1,765 level, a further downward move could be likely.
That's it - only interest rates in focus, no other comments on gold market that we're in habit to read every week. The logical question is whether this effect temporal and situation stabilize soon, or this is indeed major long-term turning point?
Interest rates
In the past week, investors’ concerns about the volatility created by retail investors have dissipated as markets moved into a risk-on stance. Oil prices, which have positive exposure to the macro cycle and inflation and negative exposure to liquidity, led the way, rising 6.3% in the week. Brent crude is now at its highest level since February last year, at the beginning of the pandemic. Meanwhile the price of gold, which tends to have positive exposure to liquidity and inflation and negative exposure to the economic cycle, fell during in the week. These two movements, alongside the rise in equities, suggest that the key driver of markets last week was positive investor sentiment about the economic recovery.

Interest rates are changing not only in US but across the Globe. Long-term real yields that were down below the bottom just few weeks ago has turned positive.
Higher U.S. Treasury yields have so far done little more than jolt equity markets off record highs. That will change if “real” yields -- adjusted for inflation -- take off. It was last year’s real yield plunge which sent cash flooding into stocks; while expensive, they looked like a good deal compared with real yields of minus 1%.
But big-time government spending plans and prospects of economic reopening have lifted real 30-year Treasury yields to eight-month highs, just 11 basis points shy of 0%. Ten-year real yields are at five-week peaks.
There’s little consensus on when yields will become a problem for equities. But some assets are already seeing an impact -- gold for instance struggles to compete with income-bearing investments when yields rise and is down 6% this year.

Speaking on equities - it is the rule of thumb when interest yields are coming to after tax index dividend yield - stock reversal stands right around the corner. Now we have interest rates around 1.35% while after tax dividend yield around 2.4-2.80%, so, stocks probably could stay on the surface a bit longer but we hear first notes of worry:
A strong start for world equities in 2021 after the fastest bear-to-bull market switch last year has prompted market mavens to flag worries about pricey assets, with BofA calling it the “mother-of-all asset bubbles”.
The U.S. Federal Reserve for instance has been purchasing bonds at a record pace, doubling its balance sheet to nearly $8 trillion in less than a year. During the same period, the five biggest tech stocks have seen their market value double. As financial assets worth $1.1 billion are gobbled up by global central banks every hour, there is irrational exuberance on Wall Street, according to BofA.
Goldman Sachs’ Chief Executive David Solomon and strategists at some major investment banks have since January been warning about stock market volatility, particularly in the immediate future.
Most traditional market-top signals have been flashing amber - just as they did before the bursting of the dotcom bubble two decades ago. But what’s different this time is that interest rates look firmly stapled to the floor for years to come. Ten-year yields on bonds of G7 countries are hovering near record lows, lending credence to “bubble” naysayers and captured in the hefty ‘equity risk premium’ (ERP) relative to historical averages.
“You’re practically ‘forced’ to move into riskier assets,” said Jeroen Blokland, a portfolio manager at Robeco, adding that outside the United States, things look even less bubbly. The benchmark U.S. S&P 500 is now the most expensive developed market index based on the price-to-earnings ratio, trading at levels last seen during the dotcom bubble of the late 1990s. Though Blokland sees rising odds that markets globally end up in a bubble, he said the upcoming cash injections and fiscal spending could further support asset prices.
Sitting at 22-times 12-month forward earnings, the S&P 500 is trading well above its long-term average of just 16x. Other major indexes are also trading above long-term averages, but are still far from S&P’s extreme levels.

The frenzy is also visible in options markets. The CBOE put-to-call ratio has been pinned at near 20-year lows for eight months now, at levels last seen just before the dotcom bubble burst in 2000. Put options confer the right to sell at a pre-agreed price and calls allow holders to buy.

Another indicator is the extent of central bank liquidity support in the system. M2, a measure of money supply that takes into account cash and deposits, jumped sharply last year spawning bubbles in many corners of the markets from bitcoin to high-flying tech stocks.

Why we're talking a lot about equities and its overvaluation? Just to show that ongoing processes are not an occasion. This is global shift that involves all financial markets and gold is not an exception.
The U.S. stock market has so far digested a surge in Treasury yields, but some investors are worried that a continued ascent could prove more problematic. The yield on the benchmark 10-year Treasury note, which rises when bond prices fall, climbed to a one year high of 1.36% this week, fueled by expectations that progress in the countrywide vaccination program and further fiscal stimulus would further spur economic growth.
So far, stocks have responded with little more than a wobble. But some investors worry that a continued rise in yields on Treasuries -- which are backed by the U.S. government -- could dim the allure of comparatively riskier investments such as equities and weigh on the S&P 500 that has risen about 75% since last March.
“When ... government bond yields rise, all asset prices should reprice lower -- that’s the theory,” said Eric Freedman, chief investment officer at U.S. Bank Wealth Management, adding that he does not believe yields have yet risen far enough to provide an competitive alternative to stocks.
Analysts at Nomura, meanwhile, said earlier this week that a move above 1.5% on the 10-year could spark an 8% drop in stocks.
At 22.2 times its forward price-to-earnings ratio, the S&P 500’s valuation is well above its long-term average of 15.3, according to Refinitiv Datastream, though several investors said stocks still look relatively inexpensive compared to bonds.
Plenty of investors are sanguine about the move, noting that yields appear to be rising due to expectations of an improving economy. J. Bryant Evans, a portfolio manager at Cozad Asset Management, recently added bank and mortgage company stocks to a high dividend portfolio this week to take advantage of the improving economic outlook and rising rate environment.
More broadly, he was targeting a 3% yield on the 10-year for when bonds might start competing more aggressively with stocks.
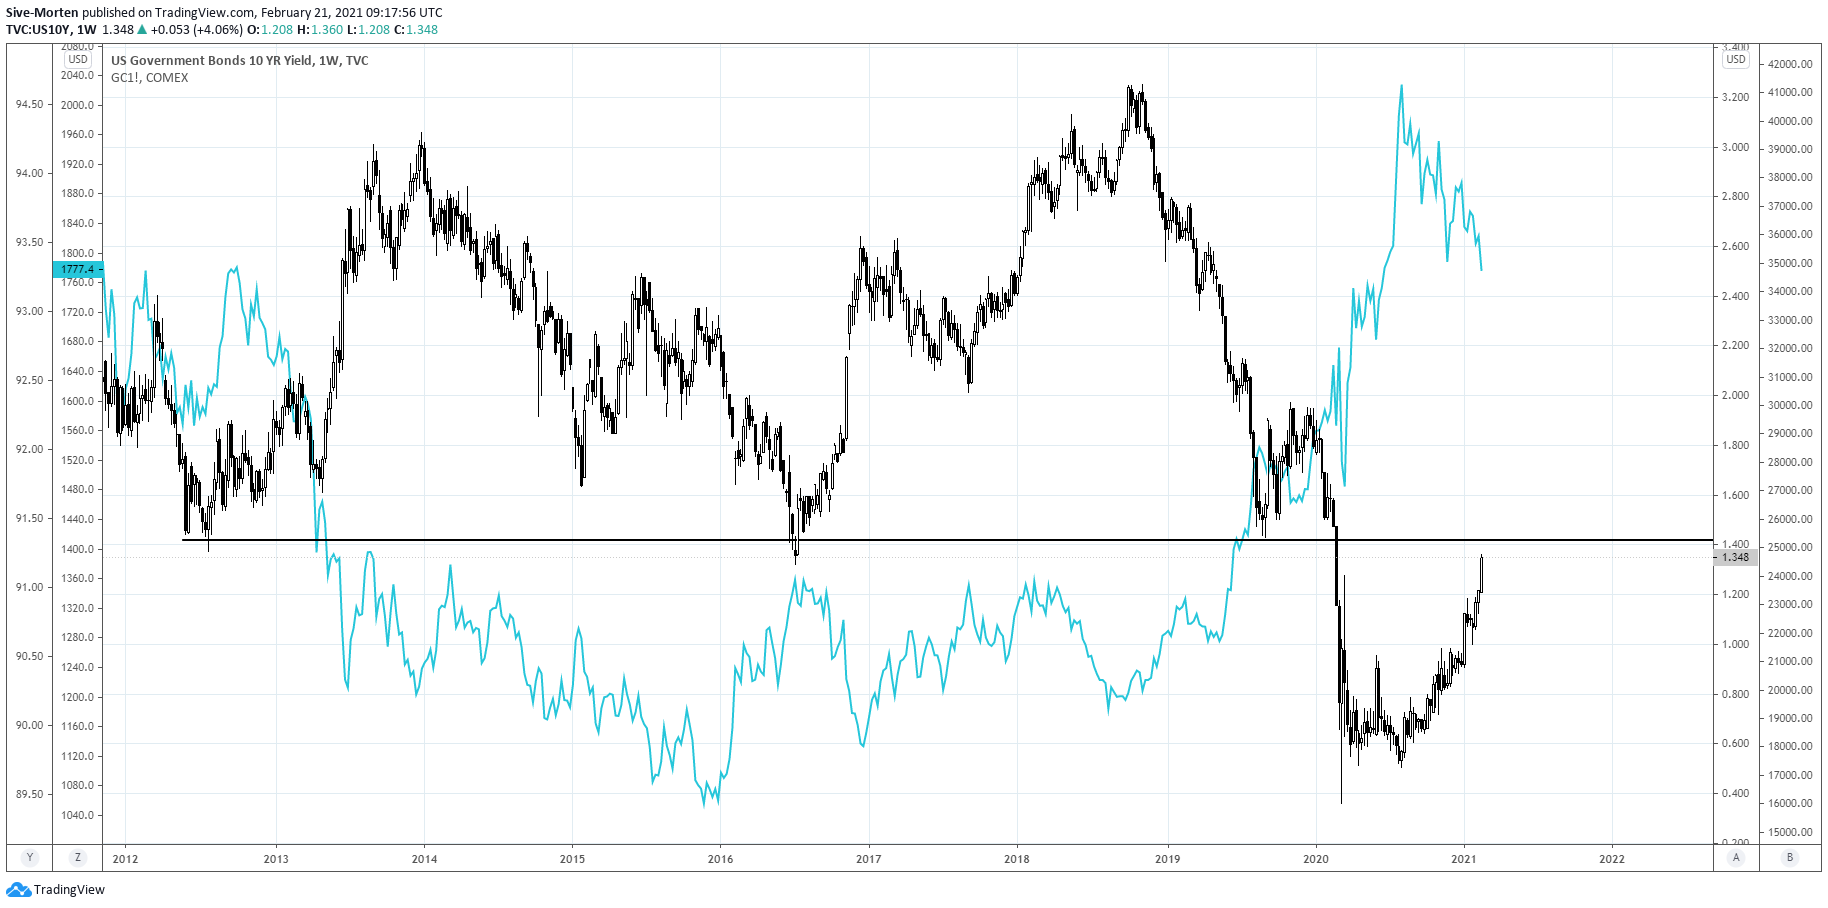
Here is actually what we have on 10-year yields and how it relates to gold price:
COT Report
CFTC data also shows changings in the same direction. This week investors have closed large long positions, hedgers follow the same way. As a result, net long position has dropped again:

It means that this is not just some temporal pullback, it seems that we're dealing with the real shift as changes are massive and come across the all markets. Although dollar should drop a bit more to our 87.3 target and interest yields probably will show downside reaction from 1.4-1.42% area, thus gold should get short-term support to bounce - in a longer-term, it seems that market is doomed as inflation processes that have started and economy recovery can't be stopped by anything except higher interest rates. But while Fed is waiting for 2-2.5% inflation target, economy heats up more and interest rates start to press on gold harder. In short-term, while interest rates are coming to 1.4% we expect reaching of our weekly OP around 1740$ and K-area of 1685-1700$, then chances on technical pullback are good, but this supposedly becomes just a retracement before acceleration of downside trend.
Technicals
Monthly
On monthly chart the major moment now is coming failure of bullish grabber pattern, as price already has breached the lows and it will be enough just to closed under them to cancel the bullish pattern. Gold already stands below Yearly Pivot as it was not able to stay above it, despite that it was really crucial area for the market and daily performance.
Nearest monthly destination point is 1685-1690 K-support. It might be reached if our suggestion of 1.4-1.42% interest rates target is correct. This level should be good enough for short-term long trade as it also coincides with monthly oversold. Combination looks solid and reliable.

Weekly
Trend here also stands bearish, although price is not too fast. On a way down we have closer support area where market should show reaction as well, since this is weekly Agreement support of AB-CD target and Fib level. Besides, it also accompanied with oversold, weekly this time. As we have a lot of strong support areas in relatively tight range and interest rates are coming to resistance - volatility should grow significantly in nearest few weeks.

Daily
Here we're keep watching for reaction on COP target, but as price is not at some strong support area we do not count on something special. Let's consider only levels that stand below daily overbought as they theoretically could be reached within a week. Although 1880-1883 levels looks more solid, it stands too high and more probable that we should see $1836 upside reaction or even lower as overall background is not based on some strong support area:

Intraday
Last week we've discussed 3-Drive "Buy" pattern around large COP target, which is also accompanied by bullish divergence. Mostly it is ready to work. Its theoretical target stands above the top between 2nd and 3rd drives around 1860, but as we've said - it would be nice is upside bounce hit 1836 K-level, reaction might be even smaller:

On 1H chart we've agreed to keep an eye on bullish reversal pattern. Supposedly we've expected another, minor 3-Drive, but now it is becoming obvious that we're getting reverse H&S pattern. The tricky moment that XOP still has not been hit but it is useless to hide stop below it because in this case H&S fails. This is the risk factor. Maybe it makes sense to place stop right under potential right arm of H&S pattern...
Take a look that pattern suggests two targets. First is the same 1804 in a case of AB-CD action, while XOP stands at 1822$. In a case of failure, if gold can't show any upside reaction at all - we switch to one time frame higher and follow to next downside target.

This week gold has become the hostage of interest rate dynamic. In recent time, this relation stands very tight, so we even take a look at it in daily updates. In fact, our intraday setups and anticipation of downside breakout of recent lows is done. But when this nightmare to gold could be over or at least to stop for awhile. We suggest it might happen ones yields hit 1.40-1.42% area. On the gold market it should coincide with reaching weekly OP target.
Market overview
Gold prices edged higher on Friday, recovering from a more than seven-month low hit earlier as the U.S. dollar eased, but rising Treasury yields kept bullion on course for its biggest weekly drop since early January. The safe-haven metal was down about 2.4% so far this week, its biggest weekly drop since the week of Jan. 8.
"The drop in the U.S. dollar has likely driven gold higher," said Bart Melek, head of commodity strategies at TD Securities, adding the move could also be technical in nature. (However), the problem (for gold) continues to be the yields, and we continue to see rates across the curve move higher," Melek added.
Benchmark U.S. Treasury yields rose to a near one-year high earlier. Gold should still benefit from continued loose monetary policy and low real interest rates this year, analysts said. Commerzbank analysts said in a note that gold's behavior resembled that of a tsunami, with prices receding in the first phase before coming back all the more violently.
"As long as yields move higher, the market is simply going to struggle to find a footing," said Saxo Bank analyst Ole Hansen, adding that if the metal fails to hold the $1,765 level, a further downward move could be likely.
That's it - only interest rates in focus, no other comments on gold market that we're in habit to read every week. The logical question is whether this effect temporal and situation stabilize soon, or this is indeed major long-term turning point?
Interest rates
In the past week, investors’ concerns about the volatility created by retail investors have dissipated as markets moved into a risk-on stance. Oil prices, which have positive exposure to the macro cycle and inflation and negative exposure to liquidity, led the way, rising 6.3% in the week. Brent crude is now at its highest level since February last year, at the beginning of the pandemic. Meanwhile the price of gold, which tends to have positive exposure to liquidity and inflation and negative exposure to the economic cycle, fell during in the week. These two movements, alongside the rise in equities, suggest that the key driver of markets last week was positive investor sentiment about the economic recovery.
Interest rates are changing not only in US but across the Globe. Long-term real yields that were down below the bottom just few weeks ago has turned positive.
Higher U.S. Treasury yields have so far done little more than jolt equity markets off record highs. That will change if “real” yields -- adjusted for inflation -- take off. It was last year’s real yield plunge which sent cash flooding into stocks; while expensive, they looked like a good deal compared with real yields of minus 1%.
But big-time government spending plans and prospects of economic reopening have lifted real 30-year Treasury yields to eight-month highs, just 11 basis points shy of 0%. Ten-year real yields are at five-week peaks.
There’s little consensus on when yields will become a problem for equities. But some assets are already seeing an impact -- gold for instance struggles to compete with income-bearing investments when yields rise and is down 6% this year.
Speaking on equities - it is the rule of thumb when interest yields are coming to after tax index dividend yield - stock reversal stands right around the corner. Now we have interest rates around 1.35% while after tax dividend yield around 2.4-2.80%, so, stocks probably could stay on the surface a bit longer but we hear first notes of worry:
A strong start for world equities in 2021 after the fastest bear-to-bull market switch last year has prompted market mavens to flag worries about pricey assets, with BofA calling it the “mother-of-all asset bubbles”.
The U.S. Federal Reserve for instance has been purchasing bonds at a record pace, doubling its balance sheet to nearly $8 trillion in less than a year. During the same period, the five biggest tech stocks have seen their market value double. As financial assets worth $1.1 billion are gobbled up by global central banks every hour, there is irrational exuberance on Wall Street, according to BofA.
Goldman Sachs’ Chief Executive David Solomon and strategists at some major investment banks have since January been warning about stock market volatility, particularly in the immediate future.
Most traditional market-top signals have been flashing amber - just as they did before the bursting of the dotcom bubble two decades ago. But what’s different this time is that interest rates look firmly stapled to the floor for years to come. Ten-year yields on bonds of G7 countries are hovering near record lows, lending credence to “bubble” naysayers and captured in the hefty ‘equity risk premium’ (ERP) relative to historical averages.
“You’re practically ‘forced’ to move into riskier assets,” said Jeroen Blokland, a portfolio manager at Robeco, adding that outside the United States, things look even less bubbly. The benchmark U.S. S&P 500 is now the most expensive developed market index based on the price-to-earnings ratio, trading at levels last seen during the dotcom bubble of the late 1990s. Though Blokland sees rising odds that markets globally end up in a bubble, he said the upcoming cash injections and fiscal spending could further support asset prices.
Sitting at 22-times 12-month forward earnings, the S&P 500 is trading well above its long-term average of just 16x. Other major indexes are also trading above long-term averages, but are still far from S&P’s extreme levels.
The frenzy is also visible in options markets. The CBOE put-to-call ratio has been pinned at near 20-year lows for eight months now, at levels last seen just before the dotcom bubble burst in 2000. Put options confer the right to sell at a pre-agreed price and calls allow holders to buy.
Another indicator is the extent of central bank liquidity support in the system. M2, a measure of money supply that takes into account cash and deposits, jumped sharply last year spawning bubbles in many corners of the markets from bitcoin to high-flying tech stocks.
Why we're talking a lot about equities and its overvaluation? Just to show that ongoing processes are not an occasion. This is global shift that involves all financial markets and gold is not an exception.
The U.S. stock market has so far digested a surge in Treasury yields, but some investors are worried that a continued ascent could prove more problematic. The yield on the benchmark 10-year Treasury note, which rises when bond prices fall, climbed to a one year high of 1.36% this week, fueled by expectations that progress in the countrywide vaccination program and further fiscal stimulus would further spur economic growth.
So far, stocks have responded with little more than a wobble. But some investors worry that a continued rise in yields on Treasuries -- which are backed by the U.S. government -- could dim the allure of comparatively riskier investments such as equities and weigh on the S&P 500 that has risen about 75% since last March.
“When ... government bond yields rise, all asset prices should reprice lower -- that’s the theory,” said Eric Freedman, chief investment officer at U.S. Bank Wealth Management, adding that he does not believe yields have yet risen far enough to provide an competitive alternative to stocks.
Analysts at Nomura, meanwhile, said earlier this week that a move above 1.5% on the 10-year could spark an 8% drop in stocks.
At 22.2 times its forward price-to-earnings ratio, the S&P 500’s valuation is well above its long-term average of 15.3, according to Refinitiv Datastream, though several investors said stocks still look relatively inexpensive compared to bonds.
Plenty of investors are sanguine about the move, noting that yields appear to be rising due to expectations of an improving economy. J. Bryant Evans, a portfolio manager at Cozad Asset Management, recently added bank and mortgage company stocks to a high dividend portfolio this week to take advantage of the improving economic outlook and rising rate environment.
More broadly, he was targeting a 3% yield on the 10-year for when bonds might start competing more aggressively with stocks.
Here is actually what we have on 10-year yields and how it relates to gold price:
COT Report
CFTC data also shows changings in the same direction. This week investors have closed large long positions, hedgers follow the same way. As a result, net long position has dropped again:
It means that this is not just some temporal pullback, it seems that we're dealing with the real shift as changes are massive and come across the all markets. Although dollar should drop a bit more to our 87.3 target and interest yields probably will show downside reaction from 1.4-1.42% area, thus gold should get short-term support to bounce - in a longer-term, it seems that market is doomed as inflation processes that have started and economy recovery can't be stopped by anything except higher interest rates. But while Fed is waiting for 2-2.5% inflation target, economy heats up more and interest rates start to press on gold harder. In short-term, while interest rates are coming to 1.4% we expect reaching of our weekly OP around 1740$ and K-area of 1685-1700$, then chances on technical pullback are good, but this supposedly becomes just a retracement before acceleration of downside trend.
Technicals
Monthly
On monthly chart the major moment now is coming failure of bullish grabber pattern, as price already has breached the lows and it will be enough just to closed under them to cancel the bullish pattern. Gold already stands below Yearly Pivot as it was not able to stay above it, despite that it was really crucial area for the market and daily performance.
Nearest monthly destination point is 1685-1690 K-support. It might be reached if our suggestion of 1.4-1.42% interest rates target is correct. This level should be good enough for short-term long trade as it also coincides with monthly oversold. Combination looks solid and reliable.
Weekly
Trend here also stands bearish, although price is not too fast. On a way down we have closer support area where market should show reaction as well, since this is weekly Agreement support of AB-CD target and Fib level. Besides, it also accompanied with oversold, weekly this time. As we have a lot of strong support areas in relatively tight range and interest rates are coming to resistance - volatility should grow significantly in nearest few weeks.
Daily
Here we're keep watching for reaction on COP target, but as price is not at some strong support area we do not count on something special. Let's consider only levels that stand below daily overbought as they theoretically could be reached within a week. Although 1880-1883 levels looks more solid, it stands too high and more probable that we should see $1836 upside reaction or even lower as overall background is not based on some strong support area:
Intraday
Last week we've discussed 3-Drive "Buy" pattern around large COP target, which is also accompanied by bullish divergence. Mostly it is ready to work. Its theoretical target stands above the top between 2nd and 3rd drives around 1860, but as we've said - it would be nice is upside bounce hit 1836 K-level, reaction might be even smaller:
On 1H chart we've agreed to keep an eye on bullish reversal pattern. Supposedly we've expected another, minor 3-Drive, but now it is becoming obvious that we're getting reverse H&S pattern. The tricky moment that XOP still has not been hit but it is useless to hide stop below it because in this case H&S fails. This is the risk factor. Maybe it makes sense to place stop right under potential right arm of H&S pattern...
Take a look that pattern suggests two targets. First is the same 1804 in a case of AB-CD action, while XOP stands at 1822$. In a case of failure, if gold can't show any upside reaction at all - we switch to one time frame higher and follow to next downside target.