Sive Morten
Special Consultant to the FPA
- Messages
- 18,648
Fundamentals
Gold this week also was figuring in headlines that relates to interest rates performance. Last time we've taken the in-depth view on this subject. Real interest rates is major driving factor for gold and now they are coming to the first stage. Investors are becoming more and more concern about recent interest rate jump. The major question whether it was just temporal, emotional spike or this is stating of a new trend.
At first glance, it mostly seems that action was occasional - US economy should be depressed for 3-5 months at least, Fed stands flat and only stimulus packs support the performance on the markets. But, as we've discussed yesterday - there is a second camp exists as well. Economists of this camp suggests faster rising of interest rates pressure due to economy recovery, rising spending and consumption because of big stimulus and vaccination. So these two different opinions we discuss in relation to FX market, but it keeps its importance for gold market as well. Just to remind you - when real interest rates starts to grow, gold turns south.
“It’s quite clear that the money markets are factoring a very sizeable fiscal stimulus spend from the Democrats, some bounce in inflation,” said Ross Norman, an independent analyst. So gold initially traded lower on those triggers - dollar and Treasury yields (rising) - now it’s trading a little higher on anticipation of some inflation to come.”
“The macro picture is still positive for gold,” said Nicholas Frappell, global general manager at ABC Bullion , adding that gold was still vulnerable in the short term to dollar sentiment and yields.
The higher bond yields have challenged that status recently as they increase the opportunity cost of holding non-interest-yielding bullion. U.S. consumer prices increased solidly in December and inflation could temporarily accelerate this year as the government provides more money to stimulate the economy. U.S. economic activity increased modestly in recent weeks and a growing number of the Federal Reserve's districts saw a drop in employment as a surge in coronavirus cases led to more shutdowns of businesses, the U.S. central bank said on Wednesday.
Gold prices inched lower on Thursday as U.S. Treasury yields rebounded on bets of a sizeable stimulus from incoming U.S. President Joe Biden, although concerns about rising inflation limited bullion's losses.
"Fiscal stimulus will help boost economic recovery, leading to rising real interest rates as well as bring up Federal Reserve's tapering hopes; on the flip side, it'll also increase the inflation outlook," said DailyFX strategist Margaret Yang. So, gold will be struggling around these price levels as the stimulus will have both positive and negative impacts on it, she added.
"Gold prices can continue to lift, but we also acknowledge the bear case scenario, where coronavirus vaccines roll out quickly and successfully lead to the pandemic coming under control through the year," said Lachlan Shaw, National Australia Bank's head of commodity research. That can prompt the Fed to start contemplating the policy reversal a bit sooner, he added.
Comments by U.S. Federal Reserve Chair Jerome Powell cemented hopes around a lower interest rate environment, while prospects of more U.S. stimulus further lifted bullion's appeal as an inflation hedge. Powell said an interest rate hike is coming "no time soon" and pushed back against suggestions that the central bank might
start tapering its bond purchases any time soon.
The number of Americans filing first-time applications for unemployment benefits surged last week.
"Powell pretty much confirmed the bank's dovish stance. ... You're going to see that the Fed is going to remain ultra-accommodative and that's why gold prices are rising," said Edward Moya, senior market analyst at OANDA. This significant jump is reminding everyone that the labor market situation is still dire, and it's going to warrant more stimulus," Moya said, adding that concerns over the coronavirus pandemic remained supportive for gold.
"Gold's upside looks constrained amid rising yield and buoyant risky assets. However, a weaker U.S. dollar, stimulus expectations and depressed real interest rates should remain supportive," ANZ analysts said in a note.
Benchmark 10-year Treasury yields eased after touching a 10-month high earlier in the week.
"Short-term headwinds aside ... if inflation expectations start to increase meaningfully and fast, gold will again become attractive. We expect gold prices to break above $2,000 again," said Harshal Barot, a senior research consultant for South Asia at Metals Focus.
"Bouts of dollar strength and the uptick in U.S. yields have triggered short-term corrections," said Standard Chartered Analyst Suki Cooper. "The gold market is caught between longer-term buying on the back of rising inflation expectations given stimulus measures, but selling as the dollar has bounced and concern over QE
tapering materialised."
"The Biden administration should support a much more expansive spending agenda than before," said Tai Wong, head of base and precious metals derivatives trading at BMO. But it seems like the stubborn short-term resilience of the dollar and concern for even higher yields is triggering steady liquidation in gold."
On the technical front, gold has solid support around $1,775, and a dip to that level could trigger buying again, said Michael Matousek, head trader at U.S. Global Investors.
Analysts at Goldman Sachs Group raised their U.S. growth forecast for the second time this month on expectations that President-elect Joe Biden’s fiscal stimulus plan will hasten the economy’s recovery from the COVID-19 pandemic. “Larger boosts to disposable income and government spending imply stronger growth later in the year,” the bank’s analysts wrote.
The bank expects economic growth of 6.6% in 2021, compared with a previous forecast of 6.4%, according to a report published on Saturday. It also raised forecasts for how much stimulus the new administration will be able to push through in the near-term, to $1.1 trillion from $750 billion.
If we take a look now at recent COT report, then overall situation doesn't look like "temporal". This week gold positions have crushed.
COT Report
Exchange traded funds (ETFs) storing gold for investors shrank for a second month in December, but nevertheless grew more than ever before in 2020 thanks to massive stockpiling earlier in the coronavirus outbreak. Holdings of the world's largest gold-backed exchange-traded fund SPDR Gold Trust fell 0.9% to 1,171.21
tonnes on Wednesday.
CFTC data shows that almost 15% of gold positions have been closed. With total open interest around 755K, this week investors have closed 110K contracts - 1/7 part of all trading volume. At the same time you could see that speculators and hedgers have closed bets on upward action massively. This makes us think that recent jump in interest rates and more attention to this topic is not occasional and short-term.

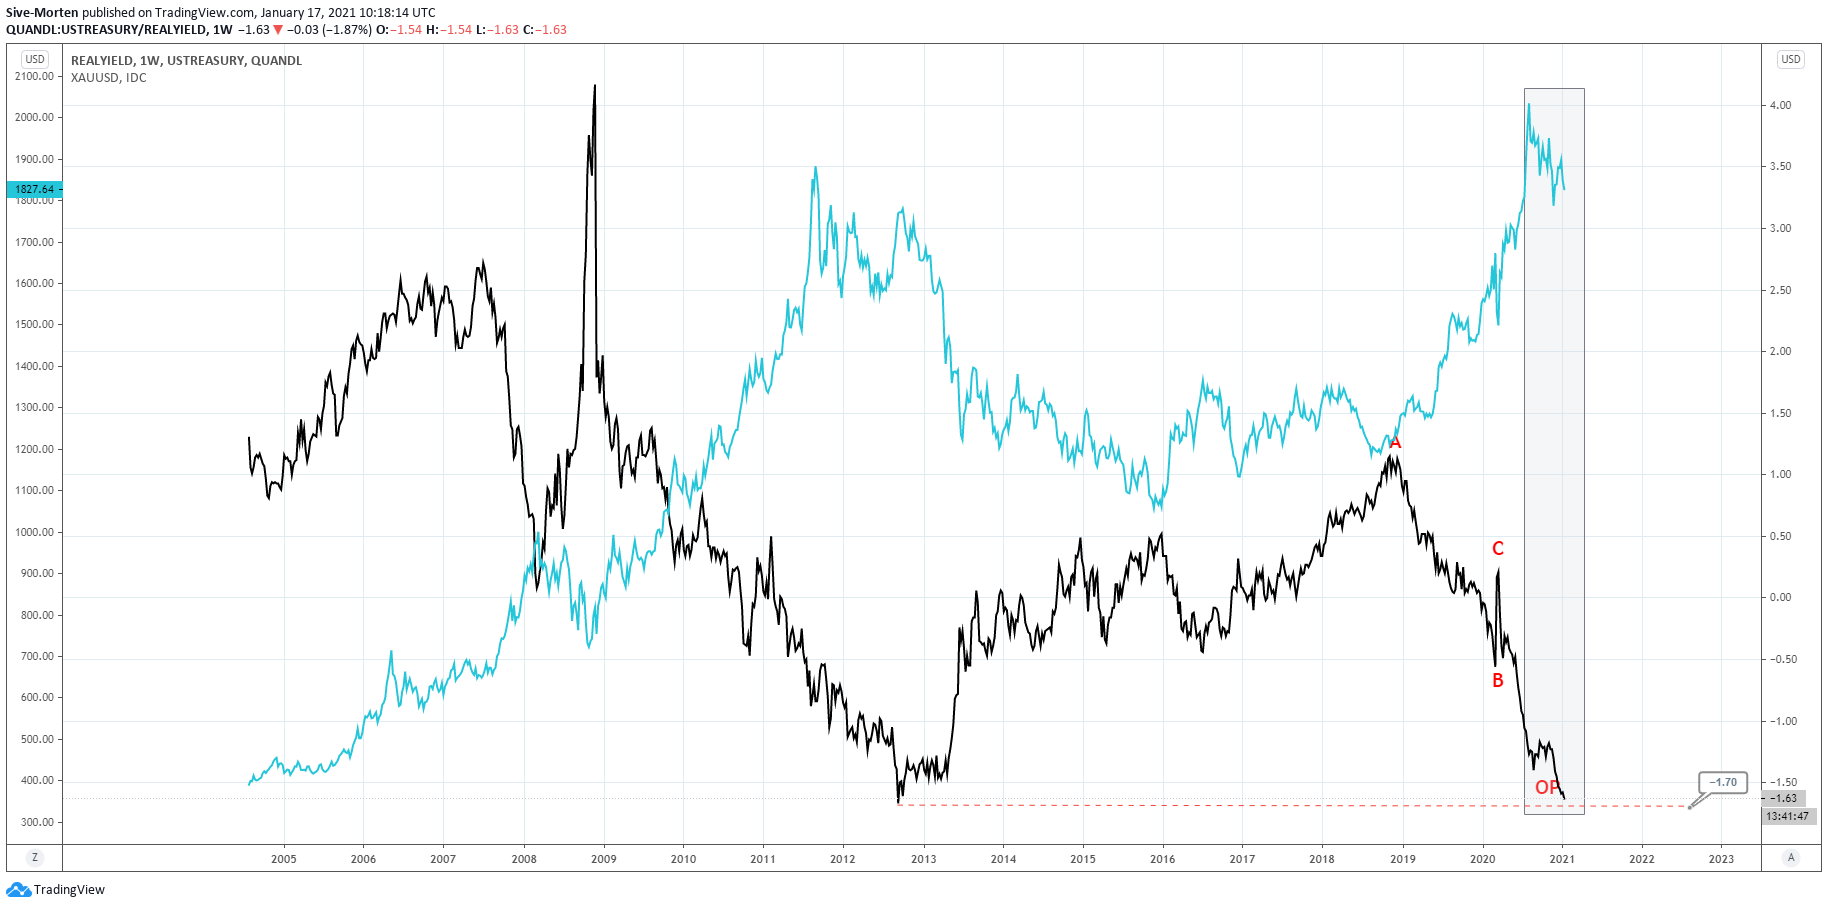
Now the interest rate chart should also become a regular one. Here we could see clear relation between gold price and real interest rates. There are two moments that we have to consider. First is - real rates are coming to absolute lows of "-1.7%" that was set in 2008 crisis. Second - in recent few weeks interest rates go down together with gold market. It means that one of these markets should change direction soon, and something tells me that this should be gold...
So, things gradually are getting complicated and major thing to do right now is to check the hypothesis, as we've said yesterday in our conclusion. Indeed, currently we have rising of inflationary expectations that are expressed by jumping of interest rates. So, our task is to consider how realistic this expectations, why nominal rates are growing. For healthy interest rate growth we need to get inflationary pressure in economy. It usually appears, when economy pace is hot, it demands more and more money to grow, to finance additional capacity, output, rising production. Population consumption stands high as well as Retail sales, unemployment is low. In general this is the background for inflationary pressure. Do we have something from this factors pack? I guess, no. Besides, with massive money printing - it can't be deficit of liquidity to finance growing economy needs, which means that there will no excess demand for money from real economy sector. Consequently, US economy currently can't produce inflationary pressure.
Hence, we need to speak not on healthy productive inflationary pressure that is a part of economy cycle but on some other, fiscal inflation, money oversupply. When money so cheap and readily available that they start loosing its value. Producers do not want to sell their goods for the same amount of money. People gets money free. Just imagine, what human being tells you in 80's if you said that he/she will get $2000+ monthly for free. Nothing needs to do. Just get and spend. And if you produce something, that costs 2000$, let's say, guitar, you surprisingly understand that your item costs nothing, as people just get it monthly for free. Would you like to spend efforts on production and sell them for the same $2K. Probably not. Probably you would like to include compensation for you real job and time spent into the price... And prices start to grow. In modern world with high degree of technical progress, food and goods are easy, cheap to produce, but still they are limited. When markets come through the whole chain of relationship from consumer to initial commodity seller that increase the price - prices start to grow.
It is fair for financial markets as well. For example, you're investor on bond market, and you try to get interest return on your investments. At the same time, people get $2K monthly or 24K annually without any effort. To recalculate on current interest rate of 1.1%, it means that to get this sum you have to invest 24/1.1% = 2.2 Mln$.
Cool. You have 2 Mln dollars, invest them for 12 months and get the same return as people for free. Of course, this is a bit radical example, wealth of these people are quite different, but, in the core, this is the simple logic that is driving the greed of investors. It just depreciate potential return on investments. Interest rates are rising.
Besides, take a look at recent "hourly earnings" data. It rises for 0.8% per month, on a background of rising unemployment and decreasing of weekly hours. This is wage inflation.

As we said yesterday, the first thing that we're going to do is to keep an eye on IVQ statistics and January NFP release. It is widely expected that we should get negative GDP. In NFP report most attention we have to pay to "hourly earnings" data, not to employment data per se. If data indeed will be negative, it means that no healthy inflationary pressure exists from the US economy directly. Thus, only fiscal inflation. In this case inflationary foundation will be fragile. All eyes will be on stimulus, and if they starts to decrease or Biden will have problems to push more stimulus through Congress - this bubble blows and rates will drop again.
The worst scenario for the gold happens, if data starts to show positive dynamic with additional stimulus on the back. This headwind will be two times stronger to the gold. Our suggestion that it starts to work in IIQ 2021.
Technicals
Monthly
This week market has dropped a bit more, but as price stands inside our grabber pattern, we still could treat this action as retracement. Although fundamental background hints that this is not quite so. Anyway, technically invalidation point we know with certainty - this is 1770 lows. Just below it we have strong monthly support area of 1685-1690.
Market gradually is tending to test 1807 area as well. This is yearly pivot point and major 5/8 Fib support area on daily chart. Supposedly bullish market should not break it down. Since recent fundamental data has hurt gold market strongly, now our task is to watch how market will response to major support areas. Monthly setup needs proper entry point that we do not have yet.

Weekly
On the weekly chart we have opposite grabber pattern. And this is the major source of trickiness here, on gold market. Grabber in particular suggests drop below recent lows and stays in direct confrontation with monthly one. Also grabber stands in a row with AB-CD pattern as OP target has not been reached when gold has turned up. Obviously one of the patterns has to fail. Reversal candle also brings nothing good to the bulls. Somehow gold was able to hold above 1836 support area. Let's see what happens next week.

Daily
Here we've decided to not shoot from the hip and do not deny H&S scenario too early. Although attractiveness of long entry decreased significantly, and now we mostly keep watching what will happen - price keeps theoretical bullish chances inside 1807-1836 area. The major thing to watch here is bullish patterns. If some of them will be formed but fails - this will be clear sign of gold's inability to go higher and confirms downside direction:

Intraday
Particularly speaking we could focus on 4H bullish butterfly pattern, as gold successfully has erased any bullish chances to jump out from the flag pattern. This was expectable, actually. Thus, right now, butterfly leads price to Yearly pivot. Potentially we could get reverse H&S pattern as well. Once any of these bullish patterns will be formed and start to work, this becomes the culmination time. Bullish market has to rely on this pattern and start upward action back to 1956 and higher. If patterns fail - we aim on 1685 K-area.

Gold this week also was figuring in headlines that relates to interest rates performance. Last time we've taken the in-depth view on this subject. Real interest rates is major driving factor for gold and now they are coming to the first stage. Investors are becoming more and more concern about recent interest rate jump. The major question whether it was just temporal, emotional spike or this is stating of a new trend.
At first glance, it mostly seems that action was occasional - US economy should be depressed for 3-5 months at least, Fed stands flat and only stimulus packs support the performance on the markets. But, as we've discussed yesterday - there is a second camp exists as well. Economists of this camp suggests faster rising of interest rates pressure due to economy recovery, rising spending and consumption because of big stimulus and vaccination. So these two different opinions we discuss in relation to FX market, but it keeps its importance for gold market as well. Just to remind you - when real interest rates starts to grow, gold turns south.
“It’s quite clear that the money markets are factoring a very sizeable fiscal stimulus spend from the Democrats, some bounce in inflation,” said Ross Norman, an independent analyst. So gold initially traded lower on those triggers - dollar and Treasury yields (rising) - now it’s trading a little higher on anticipation of some inflation to come.”
“The macro picture is still positive for gold,” said Nicholas Frappell, global general manager at ABC Bullion , adding that gold was still vulnerable in the short term to dollar sentiment and yields.
The higher bond yields have challenged that status recently as they increase the opportunity cost of holding non-interest-yielding bullion. U.S. consumer prices increased solidly in December and inflation could temporarily accelerate this year as the government provides more money to stimulate the economy. U.S. economic activity increased modestly in recent weeks and a growing number of the Federal Reserve's districts saw a drop in employment as a surge in coronavirus cases led to more shutdowns of businesses, the U.S. central bank said on Wednesday.
Gold prices inched lower on Thursday as U.S. Treasury yields rebounded on bets of a sizeable stimulus from incoming U.S. President Joe Biden, although concerns about rising inflation limited bullion's losses.
"Fiscal stimulus will help boost economic recovery, leading to rising real interest rates as well as bring up Federal Reserve's tapering hopes; on the flip side, it'll also increase the inflation outlook," said DailyFX strategist Margaret Yang. So, gold will be struggling around these price levels as the stimulus will have both positive and negative impacts on it, she added.
"Gold prices can continue to lift, but we also acknowledge the bear case scenario, where coronavirus vaccines roll out quickly and successfully lead to the pandemic coming under control through the year," said Lachlan Shaw, National Australia Bank's head of commodity research. That can prompt the Fed to start contemplating the policy reversal a bit sooner, he added.
Comments by U.S. Federal Reserve Chair Jerome Powell cemented hopes around a lower interest rate environment, while prospects of more U.S. stimulus further lifted bullion's appeal as an inflation hedge. Powell said an interest rate hike is coming "no time soon" and pushed back against suggestions that the central bank might
start tapering its bond purchases any time soon.
The number of Americans filing first-time applications for unemployment benefits surged last week.
"Powell pretty much confirmed the bank's dovish stance. ... You're going to see that the Fed is going to remain ultra-accommodative and that's why gold prices are rising," said Edward Moya, senior market analyst at OANDA. This significant jump is reminding everyone that the labor market situation is still dire, and it's going to warrant more stimulus," Moya said, adding that concerns over the coronavirus pandemic remained supportive for gold.
"Gold's upside looks constrained amid rising yield and buoyant risky assets. However, a weaker U.S. dollar, stimulus expectations and depressed real interest rates should remain supportive," ANZ analysts said in a note.
Benchmark 10-year Treasury yields eased after touching a 10-month high earlier in the week.
"Short-term headwinds aside ... if inflation expectations start to increase meaningfully and fast, gold will again become attractive. We expect gold prices to break above $2,000 again," said Harshal Barot, a senior research consultant for South Asia at Metals Focus.
"Bouts of dollar strength and the uptick in U.S. yields have triggered short-term corrections," said Standard Chartered Analyst Suki Cooper. "The gold market is caught between longer-term buying on the back of rising inflation expectations given stimulus measures, but selling as the dollar has bounced and concern over QE
tapering materialised."
"The Biden administration should support a much more expansive spending agenda than before," said Tai Wong, head of base and precious metals derivatives trading at BMO. But it seems like the stubborn short-term resilience of the dollar and concern for even higher yields is triggering steady liquidation in gold."
On the technical front, gold has solid support around $1,775, and a dip to that level could trigger buying again, said Michael Matousek, head trader at U.S. Global Investors.
Analysts at Goldman Sachs Group raised their U.S. growth forecast for the second time this month on expectations that President-elect Joe Biden’s fiscal stimulus plan will hasten the economy’s recovery from the COVID-19 pandemic. “Larger boosts to disposable income and government spending imply stronger growth later in the year,” the bank’s analysts wrote.
The bank expects economic growth of 6.6% in 2021, compared with a previous forecast of 6.4%, according to a report published on Saturday. It also raised forecasts for how much stimulus the new administration will be able to push through in the near-term, to $1.1 trillion from $750 billion.
If we take a look now at recent COT report, then overall situation doesn't look like "temporal". This week gold positions have crushed.
COT Report
Exchange traded funds (ETFs) storing gold for investors shrank for a second month in December, but nevertheless grew more than ever before in 2020 thanks to massive stockpiling earlier in the coronavirus outbreak. Holdings of the world's largest gold-backed exchange-traded fund SPDR Gold Trust fell 0.9% to 1,171.21
tonnes on Wednesday.
CFTC data shows that almost 15% of gold positions have been closed. With total open interest around 755K, this week investors have closed 110K contracts - 1/7 part of all trading volume. At the same time you could see that speculators and hedgers have closed bets on upward action massively. This makes us think that recent jump in interest rates and more attention to this topic is not occasional and short-term.
Now the interest rate chart should also become a regular one. Here we could see clear relation between gold price and real interest rates. There are two moments that we have to consider. First is - real rates are coming to absolute lows of "-1.7%" that was set in 2008 crisis. Second - in recent few weeks interest rates go down together with gold market. It means that one of these markets should change direction soon, and something tells me that this should be gold...
So, things gradually are getting complicated and major thing to do right now is to check the hypothesis, as we've said yesterday in our conclusion. Indeed, currently we have rising of inflationary expectations that are expressed by jumping of interest rates. So, our task is to consider how realistic this expectations, why nominal rates are growing. For healthy interest rate growth we need to get inflationary pressure in economy. It usually appears, when economy pace is hot, it demands more and more money to grow, to finance additional capacity, output, rising production. Population consumption stands high as well as Retail sales, unemployment is low. In general this is the background for inflationary pressure. Do we have something from this factors pack? I guess, no. Besides, with massive money printing - it can't be deficit of liquidity to finance growing economy needs, which means that there will no excess demand for money from real economy sector. Consequently, US economy currently can't produce inflationary pressure.
Hence, we need to speak not on healthy productive inflationary pressure that is a part of economy cycle but on some other, fiscal inflation, money oversupply. When money so cheap and readily available that they start loosing its value. Producers do not want to sell their goods for the same amount of money. People gets money free. Just imagine, what human being tells you in 80's if you said that he/she will get $2000+ monthly for free. Nothing needs to do. Just get and spend. And if you produce something, that costs 2000$, let's say, guitar, you surprisingly understand that your item costs nothing, as people just get it monthly for free. Would you like to spend efforts on production and sell them for the same $2K. Probably not. Probably you would like to include compensation for you real job and time spent into the price... And prices start to grow. In modern world with high degree of technical progress, food and goods are easy, cheap to produce, but still they are limited. When markets come through the whole chain of relationship from consumer to initial commodity seller that increase the price - prices start to grow.
It is fair for financial markets as well. For example, you're investor on bond market, and you try to get interest return on your investments. At the same time, people get $2K monthly or 24K annually without any effort. To recalculate on current interest rate of 1.1%, it means that to get this sum you have to invest 24/1.1% = 2.2 Mln$.
Cool. You have 2 Mln dollars, invest them for 12 months and get the same return as people for free. Of course, this is a bit radical example, wealth of these people are quite different, but, in the core, this is the simple logic that is driving the greed of investors. It just depreciate potential return on investments. Interest rates are rising.
Besides, take a look at recent "hourly earnings" data. It rises for 0.8% per month, on a background of rising unemployment and decreasing of weekly hours. This is wage inflation.
As we said yesterday, the first thing that we're going to do is to keep an eye on IVQ statistics and January NFP release. It is widely expected that we should get negative GDP. In NFP report most attention we have to pay to "hourly earnings" data, not to employment data per se. If data indeed will be negative, it means that no healthy inflationary pressure exists from the US economy directly. Thus, only fiscal inflation. In this case inflationary foundation will be fragile. All eyes will be on stimulus, and if they starts to decrease or Biden will have problems to push more stimulus through Congress - this bubble blows and rates will drop again.
The worst scenario for the gold happens, if data starts to show positive dynamic with additional stimulus on the back. This headwind will be two times stronger to the gold. Our suggestion that it starts to work in IIQ 2021.
Technicals
Monthly
This week market has dropped a bit more, but as price stands inside our grabber pattern, we still could treat this action as retracement. Although fundamental background hints that this is not quite so. Anyway, technically invalidation point we know with certainty - this is 1770 lows. Just below it we have strong monthly support area of 1685-1690.
Market gradually is tending to test 1807 area as well. This is yearly pivot point and major 5/8 Fib support area on daily chart. Supposedly bullish market should not break it down. Since recent fundamental data has hurt gold market strongly, now our task is to watch how market will response to major support areas. Monthly setup needs proper entry point that we do not have yet.
Weekly
On the weekly chart we have opposite grabber pattern. And this is the major source of trickiness here, on gold market. Grabber in particular suggests drop below recent lows and stays in direct confrontation with monthly one. Also grabber stands in a row with AB-CD pattern as OP target has not been reached when gold has turned up. Obviously one of the patterns has to fail. Reversal candle also brings nothing good to the bulls. Somehow gold was able to hold above 1836 support area. Let's see what happens next week.
Daily
Here we've decided to not shoot from the hip and do not deny H&S scenario too early. Although attractiveness of long entry decreased significantly, and now we mostly keep watching what will happen - price keeps theoretical bullish chances inside 1807-1836 area. The major thing to watch here is bullish patterns. If some of them will be formed but fails - this will be clear sign of gold's inability to go higher and confirms downside direction:
Intraday
Particularly speaking we could focus on 4H bullish butterfly pattern, as gold successfully has erased any bullish chances to jump out from the flag pattern. This was expectable, actually. Thus, right now, butterfly leads price to Yearly pivot. Potentially we could get reverse H&S pattern as well. Once any of these bullish patterns will be formed and start to work, this becomes the culmination time. Bullish market has to rely on this pattern and start upward action back to 1956 and higher. If patterns fail - we aim on 1685 K-area.