Sive Morten
Special Consultant to the FPA
- Messages
- 18,644
Fundamentals
Yesterday we've made an analysis on US and EU inflation data and shown that decreasing of inflation does not necessary mean economy growth, because it could drop due negative factors - overall decrease of demand and economy contraction. Thus, in previous 2-3 weeks we've considered inflation, interest rates policy, consumption and job market. Now let's take a look at Fed and how it is going with its balance. This explains why many big companies and respectable analysts start giving terms when Fed might turn to easing again with some precision - early summer. First is, the situation with US Treasury Fed deposit.. it is exhausting and will totally dry right to end of spring. Second - situation on US Treasury market is not perfect, demand for new debt issues stands very weak. These two factors could play the key role in Fed policy.
Market overview
Gold steadied near the highest in almost nine months as poor company earnings and layoffs heightened concerns of a recession. European stocks and US futures edged higher on Friday after slumping in the previous session as job cuts and profit warnings from several major firms soured sentiment. Gold surged on Thursday amid the bearish mood, and is now on track for a weekly gain.
The metal has been rallying since early November on signs the Federal Reserve was turning less hawkish, spurring declines in the dollar and Treasury yields. Traders are monitoring US data for signs the economy is weakening, which could force the central bank to cut rates later this year.
Fed Vice Chair Lael Brainard, considered a policy dove, said rates in the US will need to stay high for a period to cool inflation, while European Central Bank President Christine Lagarde vowed no let-up in efforts to return price gains to within the 2% target. In Japan, inflation hit 4% for the first time in more than four decades.
Commentary from Fed officials has pointed to a terminal rate above 5%, but traders still bet on rates peaking at 4.9% by June and see a 93.7% chance for a 25-basis-point rate hike in February.
While there has been an accumulation of gold by various central banks and agencies, gold ETFs held by individuals have been decreasing. Were ETF buying to return, that would limit any overbought dip in the metal, said Caesar Bryan, portfolio manager of the Gabelli Gold Fund.
Boston Fed President Susan Collins said the Fed would probably need to raise interest rates to "just above" 5% and hold them there, while Fed Vice Chair Lael Brainard said there was evidence in favor of a "soft landing" for the U.S. economy. Bank of St. Louis President James Bullard in a Wall Street Journal interview said policy rates should be moved to above 5% "as quickly as we can", while Cleveland Fed President Loretta Mester echoed similar sentiments.
Given the mixed messaging coming from Fed officials, gold has struggled to gain a firm footing above $1,920 and is looking distinctly overbought on the charts, independent analyst Ross Norman said.
Meanwhile, China saw economic growth slumping in 2022, but officials at the World Economic Forum said the country's reopening could drive global growth beyond expectations. Gold buying in China normally picks up ahead of the Lunar New Year holidays, which run from Jan. 21.
Zimbabwe’s gold coins introduced in July are selling above $2,000 for the first time. The so-called “Mosi-oa-Tunya” gold coin, named after Victoria Falls, a key tourism site which straddles the border between Zimbabwe and Zambia, were priced at $2,002.51 for a one-ounce coin on Monday, according to data on the Reserve Bank of Zimbabwe’s website. The central bank introduced the gold coins to halt a collapse of the Zimbabwean dollar and to help ease demand for US dollars. Smaller units were brought into circulation in November.

Take a look guys, what IMF tells to Zimbabwe government - The International Monetary Fund urged authorities last month to wind down the use of the gold coins and to use appropriate interest-bearing instruments to carry out monetary policy.
They are frightened, because Zimbabwe golden currency shows USD devaluation in real time. Take a look 200$ in half a year, which is about 20% annually. Not bad uh? They do not like it and try to push Zimbabwe back to US serfdom, support Pax Americana world and work for USD prosperity, using all these stuff like dollar-denominated "Interest bearing" instruments....
Gold’s allure also owes much to sheer faith — or, put differently, lack of faith in currencies and the central banks that (mis)manage them. Yielding nothing, various metrics are drafted to justify gold’s malleable value, from ratios with other assets to marginal mining costs to pure chartism. Also Gold has absolutely phenomenal relationship with real interest rates. It makes intuitive sense because of the metal’s negative carry, and there’s a decent inverse correlation over time. That held during much of 2022 as the Federal Reserve raised rates at the fastest clip in decades and investors bolted from precious-metal funds.
Now gold has rallied again, back above $1,900 an ounce and only 7% off its all-time peak. Yet, despite cooling inflation, the Fed doesn’t look done. And using weekly data back to 2000, regression of gold versus yields on 10-year inflation-protected Treasuries — a proxy for real rates — already implies a price roughly 50% lower than today’s. Aversion to alternatives offers one explanation. Apart from crypto’s collapse, stocks and bonds both served up negative returns last year, a confluence observed in only 2% of all 12-month periods since 1926, according to Goldman Sachs Group Inc.
Another source of support is central banks buying gold as rising rates ding the value of US Treasuries holdings and, potentially, to circumvent sanctions on trading with Russia. Net central bank purchases through the first three quarters of last year accounted for fully half the growth in demand for gold and hit their highest level since 1967, just as the postwar dollar-peg to bullion began collapsing. It turns out goldbugs owe much of their recent cheer to the currency (mis)managers — which should make them uncomfortable in more ways than one.
Right now gold is trading at around $1,915 an ounce. That’s high but it’s nowhere near its all-time high of more than $2,060 set in August 2020. However, as the chart below shows, it’s quite possible that gold will set a new record very soon in pound sterling quotation. This might be important for our UK readers.
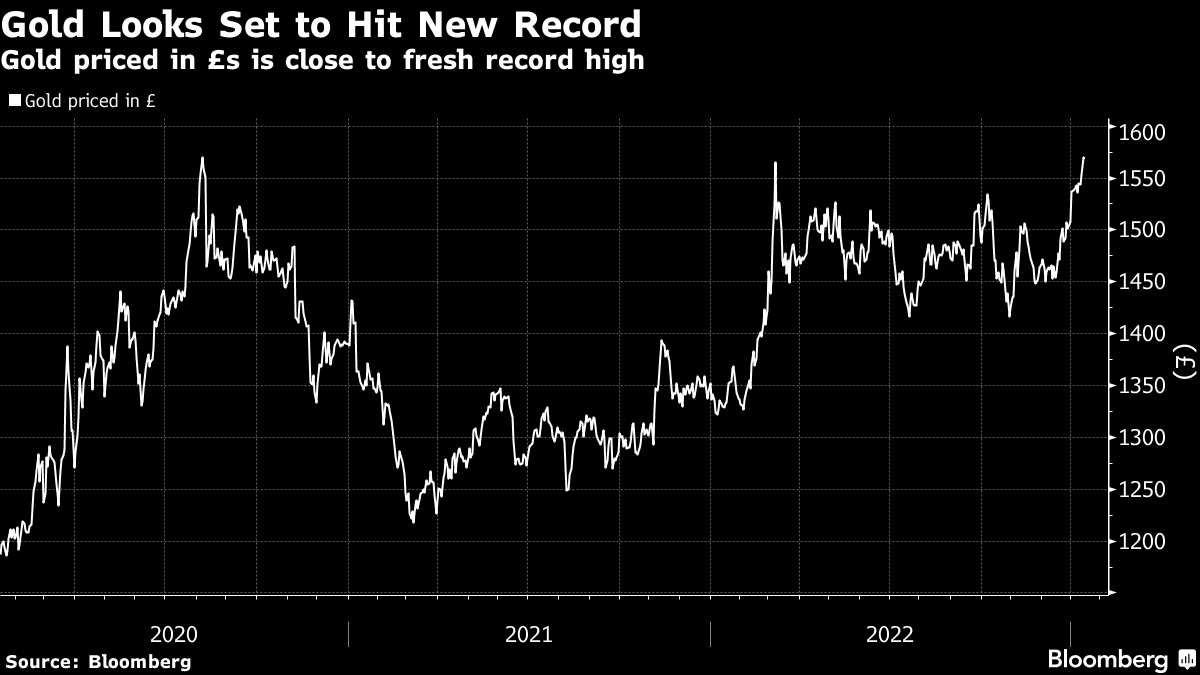
Gold’s all-time high in pound terms (and on an intraday basis, rather than a closing price basis) is around £1,578 per ounce, which it hit in August 2020. As I type, it’s sitting at just below £1,570. So it won’t take much to break that record. For more on why gold is doing well — for starters, it is the form of money with the longest historical pedigree — see Merryn’s latest column. It is great column to read, and actually Merryn tells the same that we did last week, concerning Central Banks demand. We've said - if they are buying then it means something. They are preparing to something or do know something.
Merryn writes - TD Securities are unconvinced on the case for gold. To them, Chinese buying has created a nasty $150 per ounce mispricing in the market — one that will correct if they stop buying. But you could look at this the other way around and take Chinese buying as a clear reminder that gold is one of the few things that everyone thinks is money — from the precocious 11-year-old I met last month to the heads of every central bank in the world. As Alex Chartres of Ruffer recently said on my podcast, there aren’t many other things you can turn to as a long-term safe haven in today’s markets.
A year ago, some thought Bitcoin might be a rival — a digital gold even. The market has now “kneecapped” that idea. These days, if you want gold you will need to buy, well, gold. That being the case, the question is not have you too much, but have you enough — the very same question the head of the PBoC is clearly asking himself right now.
Fed and US Treasury difficulties
Previously we already have explained why we expect stock market collapse in nearest 3-4 months and talked about Fed cash reserves, that they are gradually exhausting. Actually 2/3 of margin safety is lost already. This time we would like to show you the problems on US debt that absolutely brings no relax to situation and makes it even more difficult, cutting the last source of funding.
But first, few words on debt ceil problem. Of course all these talks about US debt default is a pure populism and we should not pay too much attention to it. Out of the system semi-marginal media talk about the US default scenario and everything like that. this is totally an absurd . To understand the texture of the question, I will give a few facts. For the first time the concept of compulsory restriction of borrowing was introduced in 1939, two years later in 1940 the scheme was introduced. During this time, the debt limit has increased 92 times! Since 2000 there have been 24 times, after the crisis of 2009 there were 17 episodes.
Now it is rather not a political lever, because the system of political balance in the United States has been built for a long time, but the case when the political establishment in the United States creates the appearance of contradictions, gaining political points for the next election, while simultaneously solving the purely practical task of building new areas of lobbying.
How long will the undercover fuss last? As long as it takes to survive the media resource of a fictitious political confrontation, which does not exist and cannot exist between Democrats and Republicans. Why? Because strategical issues of national security decisions are made instantly without disputes and complaints. The most striking example is March 2020, when in 6 working days after the first hard lockdown, a $2 trillion budget incentive plan was created from the first to the last page (with a volume of several hundred pages). The Bill was signed by President in two days.
The only thing that is matter here. The point is, the House of Representatives, is controlled today by the Republican Party, which has its own ideas about economic policy. And there is no doubt that the need to raise the debt limit, which can only be changed by the adoption of a new law, will allow Republicans to start a serious discussion about economic policy with the White House.
In particular, it is possible that following this discussion, the Ministry of Finance and monetary authorities in general will have to explain how they are going to support the real sector of the economy, in particular, the construction sector, how they will protect the economy from inflation in the face of a sharp increase in budget expenditures and, finally, has does it make sense to raise the bid in such a situation? In fact these questions are already rising. Even a simple discussion of these questions can cause serious trouble in the financial markets. It should be noted that so far the US monetary authorities have managed to avoid an active discussion on this topic. Although pictures of US Debt payments and rising US Debt CDS can puzzle anyone. Other words speaking, the issue of debt ceil is a great background for political trading.
Now back to US Treasuries market, which potentially we also consider as a source of Gold market strength in mid-term perspective. Here is what we're talking about. Take a look at new net issue of US Debt:

US Treasury has planned to place at least 550 billion dollars in Q4 2022, and placed 234 billion on a group of Bills (up to a year), Notes (from a year to 10 years) and Bonds (over 10 years. 3-month MA are constantly decreasing, started 2021. The reasons is - shutdown of QE in March 2022 and the start of QT sales from June 2022 (lack of liquidity), plus negative rates in real terms.
The US Treasury is forced to place itself in short and expensive debt, loading the budget with additional interest costs and undermining sustainability in 2023 (i.e. debt will have to be refinanced in worse conditions).
Based on net debt issue plans, Fed has planned to have 700 billion cash positions for December 31, 2022, but has received only 446 billion. On January 6, 2023, another 70 billion cache was burned, covering operational and investment gaps. Now US Treasury is constrained by the debt ceil limit, i.e. there will be no major placements, as J. Yellen said "maybe until summer, if debt ceil will not be increased immediately".
The debate about the limit has not yet begun. The limit will be raised, there is no doubt, but the clowning will unfold until about May. Until then, the Ministry of Finance will "incinerate" the entire cache reserve, and problems will begin in June, since the load on the system will increase significantly on a background of a shortage of liquidity, zero cache positions and the need to finance the budget. By this point, the situation on the debt market will deteriorate sharply.
There should be enough money until May 2023, but it will be hard in the summer. This is the reason by the way, why some analysts starts talking about Fed easing by late Spring. As a result, the gap between the plan for the sale of securities and actual sales increased to 172 billion. It is still the financial conditions have not started to deteriorate and the markets are in quite comfortable conditions. The lack of sales from the Fed and the release of almost two hundred billion dollars into the system supported the system, but it can't go on like this for a long time, because the cache from the US Treasury is being depleted and will soon have to borrow again.
What does it all mean? Do not rely on Fed and US Treasury forecasts.
Who buys the treasuries when non-residents and the Fed, being the main holder, sell them? If we take a look at the chart of US Treasuries holders (I do not bother you with spaghetti pictures here), then you'll see that households directly (on their own behalf, as an individual through the exchange) and indirectly (through intermediaries represented by mutual funds) buy them. In total, the financial market – banks, investment funds, brokers and dealers owned 17.6% in Q4 2021, and now 16.3%.
Thus, the main support was concentrated among residents with a very specific subject – the population. On the trajectory of the growth of profitability of the treasury, the population redistributed financial resources from deposits and shares. So the population is saving US Treasuries. But we know the structure of households' finance right now - no savings and huge consumer loan debt that US banks already start reporting provision increasing, which actually has made negative impact on recent banks IQ earnings reports. So, the "Households" source can't support markets for too long. The mess is growing, the degree of entropy in the system is rising which definitely will be supportive for the gold in mid-term perspective. So, we keep our strong positive view on gold market and could talk about at least two times greater price of Gold in perspective of few years.
Technicals
Monthly
Here situation barely has changed. Here we have three strong tail closes, that might be treated as "three white soldiers" probably. Upside action has started with our "222" Buy pattern. At the same time, market already has passed minimal 3/8 upside target. Price is breaking through YPP point, suggesting that it should keep going higher. This is great news for long term investors. Next target stands around ~$2100 ATH and YPR1 of 2057$.
At the same time, market should get tactical barrier in near term as price is coming to Gold overbought level at 1945$ area. It suggests that downside pullback is probable and traders should get another chance to take new (or additional) long positions.

Weekly
Here market has broken through all major Fib levels and above our OP 1900$ target. So, in fact, market stands in "free space" without any reasonable barriers ahead. Using this puny AB-CD pattern tells that XOP stands around 2000-2002$ area. But, we still have overbought level around 1955$, that is also close to monthly one:

Daily
Market perfectly completes our trading plan last week. Now price stands too close to 1945-1950 resistance area to initiate new long positions on daily chart. But if we get the pullback to 1895 and not lower than 1867 area - we could consider it. We do not have any bearish patterns here. Trend remains bullish. Now gold also has reached 1.618 extension of previous XA retracement swing:

Intraday
Here we're watching for the same pattern. 1.27 butterfly extension is done already, but, as price stands flat and shows no solid pullback, it might be the sign that it intends to go higher. Thus, it makes sense to consider 1.618 extension as well around 1950, which is also monthly overbought...

Yesterday we've made an analysis on US and EU inflation data and shown that decreasing of inflation does not necessary mean economy growth, because it could drop due negative factors - overall decrease of demand and economy contraction. Thus, in previous 2-3 weeks we've considered inflation, interest rates policy, consumption and job market. Now let's take a look at Fed and how it is going with its balance. This explains why many big companies and respectable analysts start giving terms when Fed might turn to easing again with some precision - early summer. First is, the situation with US Treasury Fed deposit.. it is exhausting and will totally dry right to end of spring. Second - situation on US Treasury market is not perfect, demand for new debt issues stands very weak. These two factors could play the key role in Fed policy.
Market overview
Gold steadied near the highest in almost nine months as poor company earnings and layoffs heightened concerns of a recession. European stocks and US futures edged higher on Friday after slumping in the previous session as job cuts and profit warnings from several major firms soured sentiment. Gold surged on Thursday amid the bearish mood, and is now on track for a weekly gain.
The metal has been rallying since early November on signs the Federal Reserve was turning less hawkish, spurring declines in the dollar and Treasury yields. Traders are monitoring US data for signs the economy is weakening, which could force the central bank to cut rates later this year.
Fed Vice Chair Lael Brainard, considered a policy dove, said rates in the US will need to stay high for a period to cool inflation, while European Central Bank President Christine Lagarde vowed no let-up in efforts to return price gains to within the 2% target. In Japan, inflation hit 4% for the first time in more than four decades.
“Gold is overbought and needs to correct,” Rhona O’Connell, an analyst at StoneX, wrote in a note. “The $2,000 mark is on the relatively distant horizon, but if it were to be attained in the near future then it would almost certainly be a case of ‘blink and you miss it.’”
Commentary from Fed officials has pointed to a terminal rate above 5%, but traders still bet on rates peaking at 4.9% by June and see a 93.7% chance for a 25-basis-point rate hike in February.
While there has been an accumulation of gold by various central banks and agencies, gold ETFs held by individuals have been decreasing. Were ETF buying to return, that would limit any overbought dip in the metal, said Caesar Bryan, portfolio manager of the Gabelli Gold Fund.
The dollar was hovering close to an eight-month low after a raft of data showed the U.S. economy was losing momentum, making gold cheaper for holders of foreign currency. Data on Wednesday showed U.S. retail sales fell by the most in a year in December, while producer prices fell more than expected last month, offering evidence that inflation was receding. Sentiment in wider financial markets remained weak as global slowdown worries dented investors' appetite for riskier assets."There is flight to safety. Gold just seems to do better when markets are declining," said Jeffrey Sica, chief executive officer of Circle Squared Alternative Investments. "The U.S. dollar is weakening and that's one of the reasons why we're seeing the rally in gold, which I think is going to just accelerate from here."
Boston Fed President Susan Collins said the Fed would probably need to raise interest rates to "just above" 5% and hold them there, while Fed Vice Chair Lael Brainard said there was evidence in favor of a "soft landing" for the U.S. economy. Bank of St. Louis President James Bullard in a Wall Street Journal interview said policy rates should be moved to above 5% "as quickly as we can", while Cleveland Fed President Loretta Mester echoed similar sentiments.
Given the mixed messaging coming from Fed officials, gold has struggled to gain a firm footing above $1,920 and is looking distinctly overbought on the charts, independent analyst Ross Norman said.
"We're due for a bigger correction here," said Daniel Pavilonis, senior market strategist at RJO Futures. "We've seen a sharp selloff in 10-year yields - from just shy of 4% down to 3%. At the same time, we've seen a sharp rally in the metals. I just think we're going to see a retracement of that rally... gold could sell off maybe $150 from here and again become a buying opportunity."
"Recession worries and the Fed's policy decision would be the major catalysts for prices in the near future," said Hareesh V, head of commodity research at Geojit Financial Services.
"We're looking at this as more of a slight pullback within our sideways-to-higher trend. We believe the combination of the weaker dollar and sticky inflation concerns continues to support our underlying positive environment," said David Meger, director of metals trading at High Ridge Futures.
Meanwhile, China saw economic growth slumping in 2022, but officials at the World Economic Forum said the country's reopening could drive global growth beyond expectations. Gold buying in China normally picks up ahead of the Lunar New Year holidays, which run from Jan. 21.
"We expect gold prices to trend around $1,950/oz in 2023," Goldman Sachs said in a note dated Friday.
Zimbabwe’s gold coins introduced in July are selling above $2,000 for the first time. The so-called “Mosi-oa-Tunya” gold coin, named after Victoria Falls, a key tourism site which straddles the border between Zimbabwe and Zambia, were priced at $2,002.51 for a one-ounce coin on Monday, according to data on the Reserve Bank of Zimbabwe’s website. The central bank introduced the gold coins to halt a collapse of the Zimbabwean dollar and to help ease demand for US dollars. Smaller units were brought into circulation in November.
Take a look guys, what IMF tells to Zimbabwe government - The International Monetary Fund urged authorities last month to wind down the use of the gold coins and to use appropriate interest-bearing instruments to carry out monetary policy.
They are frightened, because Zimbabwe golden currency shows USD devaluation in real time. Take a look 200$ in half a year, which is about 20% annually. Not bad uh? They do not like it and try to push Zimbabwe back to US serfdom, support Pax Americana world and work for USD prosperity, using all these stuff like dollar-denominated "Interest bearing" instruments....
Gold’s allure also owes much to sheer faith — or, put differently, lack of faith in currencies and the central banks that (mis)manage them. Yielding nothing, various metrics are drafted to justify gold’s malleable value, from ratios with other assets to marginal mining costs to pure chartism. Also Gold has absolutely phenomenal relationship with real interest rates. It makes intuitive sense because of the metal’s negative carry, and there’s a decent inverse correlation over time. That held during much of 2022 as the Federal Reserve raised rates at the fastest clip in decades and investors bolted from precious-metal funds.
Now gold has rallied again, back above $1,900 an ounce and only 7% off its all-time peak. Yet, despite cooling inflation, the Fed doesn’t look done. And using weekly data back to 2000, regression of gold versus yields on 10-year inflation-protected Treasuries — a proxy for real rates — already implies a price roughly 50% lower than today’s. Aversion to alternatives offers one explanation. Apart from crypto’s collapse, stocks and bonds both served up negative returns last year, a confluence observed in only 2% of all 12-month periods since 1926, according to Goldman Sachs Group Inc.
Another source of support is central banks buying gold as rising rates ding the value of US Treasuries holdings and, potentially, to circumvent sanctions on trading with Russia. Net central bank purchases through the first three quarters of last year accounted for fully half the growth in demand for gold and hit their highest level since 1967, just as the postwar dollar-peg to bullion began collapsing. It turns out goldbugs owe much of their recent cheer to the currency (mis)managers — which should make them uncomfortable in more ways than one.
Right now gold is trading at around $1,915 an ounce. That’s high but it’s nowhere near its all-time high of more than $2,060 set in August 2020. However, as the chart below shows, it’s quite possible that gold will set a new record very soon in pound sterling quotation. This might be important for our UK readers.
Gold’s all-time high in pound terms (and on an intraday basis, rather than a closing price basis) is around £1,578 per ounce, which it hit in August 2020. As I type, it’s sitting at just below £1,570. So it won’t take much to break that record. For more on why gold is doing well — for starters, it is the form of money with the longest historical pedigree — see Merryn’s latest column. It is great column to read, and actually Merryn tells the same that we did last week, concerning Central Banks demand. We've said - if they are buying then it means something. They are preparing to something or do know something.
Merryn writes - TD Securities are unconvinced on the case for gold. To them, Chinese buying has created a nasty $150 per ounce mispricing in the market — one that will correct if they stop buying. But you could look at this the other way around and take Chinese buying as a clear reminder that gold is one of the few things that everyone thinks is money — from the precocious 11-year-old I met last month to the heads of every central bank in the world. As Alex Chartres of Ruffer recently said on my podcast, there aren’t many other things you can turn to as a long-term safe haven in today’s markets.
A year ago, some thought Bitcoin might be a rival — a digital gold even. The market has now “kneecapped” that idea. These days, if you want gold you will need to buy, well, gold. That being the case, the question is not have you too much, but have you enough — the very same question the head of the PBoC is clearly asking himself right now.
Fed and US Treasury difficulties
Previously we already have explained why we expect stock market collapse in nearest 3-4 months and talked about Fed cash reserves, that they are gradually exhausting. Actually 2/3 of margin safety is lost already. This time we would like to show you the problems on US debt that absolutely brings no relax to situation and makes it even more difficult, cutting the last source of funding.
But first, few words on debt ceil problem. Of course all these talks about US debt default is a pure populism and we should not pay too much attention to it. Out of the system semi-marginal media talk about the US default scenario and everything like that. this is totally an absurd . To understand the texture of the question, I will give a few facts. For the first time the concept of compulsory restriction of borrowing was introduced in 1939, two years later in 1940 the scheme was introduced. During this time, the debt limit has increased 92 times! Since 2000 there have been 24 times, after the crisis of 2009 there were 17 episodes.
Now it is rather not a political lever, because the system of political balance in the United States has been built for a long time, but the case when the political establishment in the United States creates the appearance of contradictions, gaining political points for the next election, while simultaneously solving the purely practical task of building new areas of lobbying.
How long will the undercover fuss last? As long as it takes to survive the media resource of a fictitious political confrontation, which does not exist and cannot exist between Democrats and Republicans. Why? Because strategical issues of national security decisions are made instantly without disputes and complaints. The most striking example is March 2020, when in 6 working days after the first hard lockdown, a $2 trillion budget incentive plan was created from the first to the last page (with a volume of several hundred pages). The Bill was signed by President in two days.
The only thing that is matter here. The point is, the House of Representatives, is controlled today by the Republican Party, which has its own ideas about economic policy. And there is no doubt that the need to raise the debt limit, which can only be changed by the adoption of a new law, will allow Republicans to start a serious discussion about economic policy with the White House.
In particular, it is possible that following this discussion, the Ministry of Finance and monetary authorities in general will have to explain how they are going to support the real sector of the economy, in particular, the construction sector, how they will protect the economy from inflation in the face of a sharp increase in budget expenditures and, finally, has does it make sense to raise the bid in such a situation? In fact these questions are already rising. Even a simple discussion of these questions can cause serious trouble in the financial markets. It should be noted that so far the US monetary authorities have managed to avoid an active discussion on this topic. Although pictures of US Debt payments and rising US Debt CDS can puzzle anyone. Other words speaking, the issue of debt ceil is a great background for political trading.
Now back to US Treasuries market, which potentially we also consider as a source of Gold market strength in mid-term perspective. Here is what we're talking about. Take a look at new net issue of US Debt:
US Treasury has planned to place at least 550 billion dollars in Q4 2022, and placed 234 billion on a group of Bills (up to a year), Notes (from a year to 10 years) and Bonds (over 10 years. 3-month MA are constantly decreasing, started 2021. The reasons is - shutdown of QE in March 2022 and the start of QT sales from June 2022 (lack of liquidity), plus negative rates in real terms.
The US Treasury is forced to place itself in short and expensive debt, loading the budget with additional interest costs and undermining sustainability in 2023 (i.e. debt will have to be refinanced in worse conditions).
Based on net debt issue plans, Fed has planned to have 700 billion cash positions for December 31, 2022, but has received only 446 billion. On January 6, 2023, another 70 billion cache was burned, covering operational and investment gaps. Now US Treasury is constrained by the debt ceil limit, i.e. there will be no major placements, as J. Yellen said "maybe until summer, if debt ceil will not be increased immediately".
The debate about the limit has not yet begun. The limit will be raised, there is no doubt, but the clowning will unfold until about May. Until then, the Ministry of Finance will "incinerate" the entire cache reserve, and problems will begin in June, since the load on the system will increase significantly on a background of a shortage of liquidity, zero cache positions and the need to finance the budget. By this point, the situation on the debt market will deteriorate sharply.
There should be enough money until May 2023, but it will be hard in the summer. This is the reason by the way, why some analysts starts talking about Fed easing by late Spring. As a result, the gap between the plan for the sale of securities and actual sales increased to 172 billion. It is still the financial conditions have not started to deteriorate and the markets are in quite comfortable conditions. The lack of sales from the Fed and the release of almost two hundred billion dollars into the system supported the system, but it can't go on like this for a long time, because the cache from the US Treasury is being depleted and will soon have to borrow again.
What does it all mean? Do not rely on Fed and US Treasury forecasts.
Who buys the treasuries when non-residents and the Fed, being the main holder, sell them? If we take a look at the chart of US Treasuries holders (I do not bother you with spaghetti pictures here), then you'll see that households directly (on their own behalf, as an individual through the exchange) and indirectly (through intermediaries represented by mutual funds) buy them. In total, the financial market – banks, investment funds, brokers and dealers owned 17.6% in Q4 2021, and now 16.3%.
Thus, the main support was concentrated among residents with a very specific subject – the population. On the trajectory of the growth of profitability of the treasury, the population redistributed financial resources from deposits and shares. So the population is saving US Treasuries. But we know the structure of households' finance right now - no savings and huge consumer loan debt that US banks already start reporting provision increasing, which actually has made negative impact on recent banks IQ earnings reports. So, the "Households" source can't support markets for too long. The mess is growing, the degree of entropy in the system is rising which definitely will be supportive for the gold in mid-term perspective. So, we keep our strong positive view on gold market and could talk about at least two times greater price of Gold in perspective of few years.
Technicals
Monthly
Here situation barely has changed. Here we have three strong tail closes, that might be treated as "three white soldiers" probably. Upside action has started with our "222" Buy pattern. At the same time, market already has passed minimal 3/8 upside target. Price is breaking through YPP point, suggesting that it should keep going higher. This is great news for long term investors. Next target stands around ~$2100 ATH and YPR1 of 2057$.
At the same time, market should get tactical barrier in near term as price is coming to Gold overbought level at 1945$ area. It suggests that downside pullback is probable and traders should get another chance to take new (or additional) long positions.
Weekly
Here market has broken through all major Fib levels and above our OP 1900$ target. So, in fact, market stands in "free space" without any reasonable barriers ahead. Using this puny AB-CD pattern tells that XOP stands around 2000-2002$ area. But, we still have overbought level around 1955$, that is also close to monthly one:
Daily
Market perfectly completes our trading plan last week. Now price stands too close to 1945-1950 resistance area to initiate new long positions on daily chart. But if we get the pullback to 1895 and not lower than 1867 area - we could consider it. We do not have any bearish patterns here. Trend remains bullish. Now gold also has reached 1.618 extension of previous XA retracement swing:
Intraday
Here we're watching for the same pattern. 1.27 butterfly extension is done already, but, as price stands flat and shows no solid pullback, it might be the sign that it intends to go higher. Thus, it makes sense to consider 1.618 extension as well around 1950, which is also monthly overbought...