Sive Morten
Special Consultant to the FPA
- Messages
- 18,643
Fundamentals
Yesterday, in EUR weekly report we've discussed in details major driving factors for all markets, and gold is not an exception - perspective of Fed policy and coming IIQ GDP US data.
Here we add a bit more that has relation to gold directly.
As Reuters reports - Gold slid as much as 2% on Friday and was set for its first weekly fall in seven weeks after data showed U.S. jobs growth rebounded strongly in June, which lowered the likelihood of an interest rate cut by the Federal Reserve this month.
Nonfarm payrolls increased by 224,000 jobs last month, the most in five months, data showed. Economists polled by Reuters had forecast payrolls rising by 160,000 jobs.
“The U.S. jobs data is driving all the pressure on gold right now. The payroll numbers crushed all expectations. That may decrease the urgency for a Fed cut in July,” said Chris Gaffney, president of world markets at TIAA Bank.
Adding pressure on gold, the dollar surged to an over two-week peak against a basket of six major currencies.
Gold is highly sensitive to interest rates and a lower chance of a cut would increase the opportunity cost of holding the non-interest-bearing bullion.
Federal funds futures implied traders now see only a 9.0% chance the U.S. central bank will decrease key money market rates by half a point, down from 29% on Wednesday, according to CME Group’s FedWatch program.
“Most of the markets though, still see some kind of cut but it pulls away that expectation of a 50-basis-points cut and most of what can be expected is a quarter-basis-point cut,” Gaffney said.
The outlook for gold still remains positive, however, analysts said. Gold hit a six-year high of $1,438.63 an ounce last week and is still holding above key technical levels.
“The yellow metal will likely find buyers as the global growth slowdown should keep demand strong for gold,” Edward Moya, senior market analyst at OANDA, said in a note.
Gold is often seen as an alternative investment during times of political and financial uncertainty.
Meanwhile, in India, the world’s second largest gold consumer, local rates surged to record highs following a surprise hike in the gold import duty on Friday.
The announcement is likely to increase the price paid by consumers, Capital Economics said in a note.
“While we had already been anticipating a slowdown in India’s gold imports this year, soaring prices and
higher tariffs present an additional headwind to demand.”
Although it may sound too brave, but somehow I agree with the comment above that "NFP data may decrease the urgency for a Fed cut in July". Despite that our view contradicts to market expectation that rate will be cut for 25 b.p. with 95% probability, we still think that no rate cut could follow.
In long-term perspective, indeed gold sentiment stands positive, which agrees with our long term view. CFTC data shows the healthy growth on net long position. SPDR fund also shows healthy data with ~ 50 tonnes surplus during the month.
Finally, recent view of Fathom on global economy perspective shows that situation stands not as bad as it represents in media. This also could act against Fed down step in July.
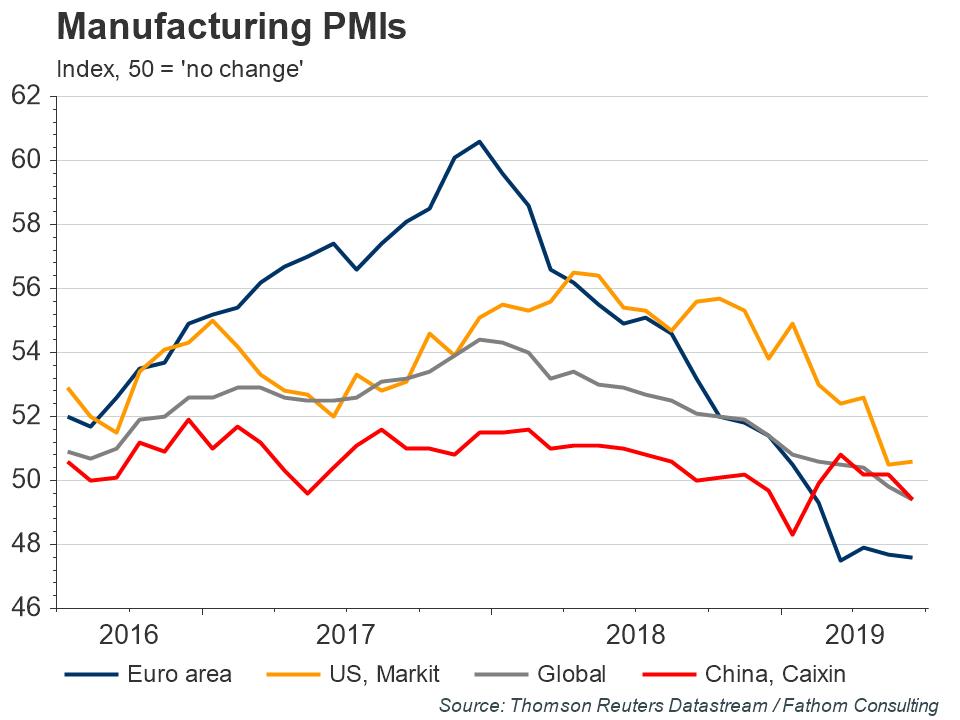
Not a trade war but ‘tradepolitik’ is the new normal state of relations between the US and China, Mexico and others — with threats of restrictive trade practices and implementations of those threats waxing and waning like the phases of the moon. That new normal is weighing down on sentiment, as illustrated by the manufacturing PMIs in the chart below. It is starting to dampen growth in the global economy too — but probably not by enough to tip the world into recession.
The impact we have seen to date is more than a mechanical consequence of the tariffs levied by the US and by China. Six months ago, we used our global economic model to argue that it would take a substantial escalation of trade disputes to push most major economies into recession. Specifically, we needed to see not only the US and China raise 25% tariffs on all trade with each other, but the US and the EU, and the EU and China to do likewise. That remains a distant prospect.
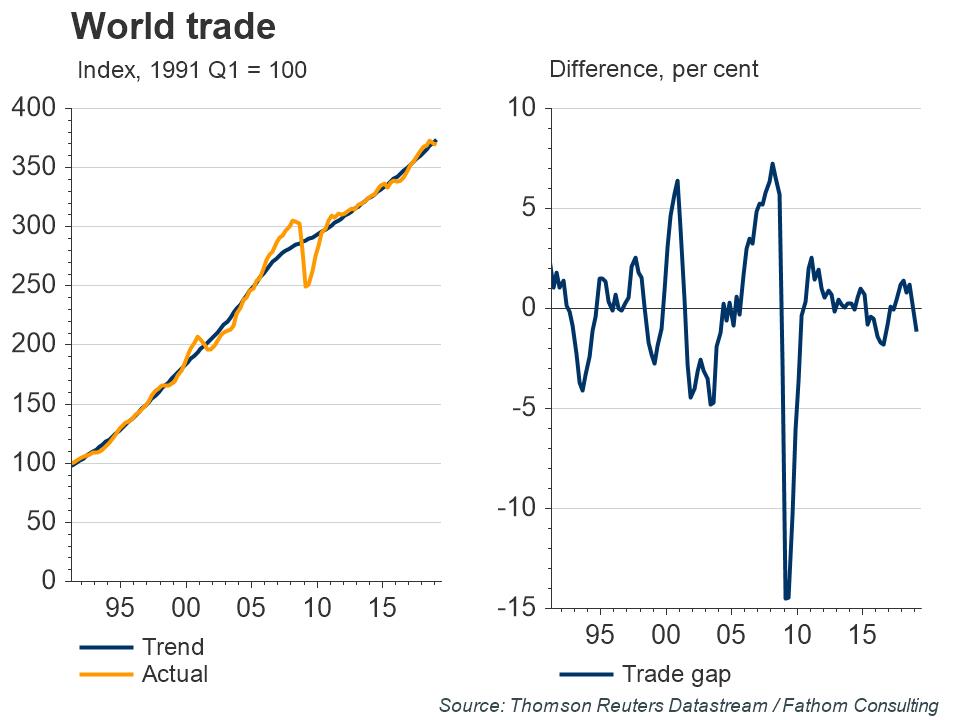
What we have seen in business surveys, and indeed in direct measures of world trade, such as that provided by the Netherlands Bureau for Economic Policy Analysis, is largely a consequence of fear rather than fact — it is fear that has pushed world trade below its long-term trend, creating a negative ‘trade gap’ shown in the chart on the right in the panel below. Fear can have direct, macroeconomic consequences. It will tend to produce a reduction in spending by consumers, but particularly by firms in the form of weaker investment. With that hit to spending, world trade will suffer too. The euro area is more damaged by a downturn in world trade than many major economies, with Germany particularly vulnerable. A 1% reduction in world trade below normal levels would hit the German economy twice as hard as it would hit the US economy.
Where do we go from here? If we are right, and the slowdown we have seen to date is largely attributable to fear regarding the actions of US President Donald Trump, then in principle it is within his gift to end it. On the eve of an election year, he will not want to tip the global economy into recession, with all that would imply for US equity prices. He would be quite happy, of course, if the Fed were to respond to the fear he has induced by cutting interest rates — and he has told them as much. But will it? Investors certainly hope so.
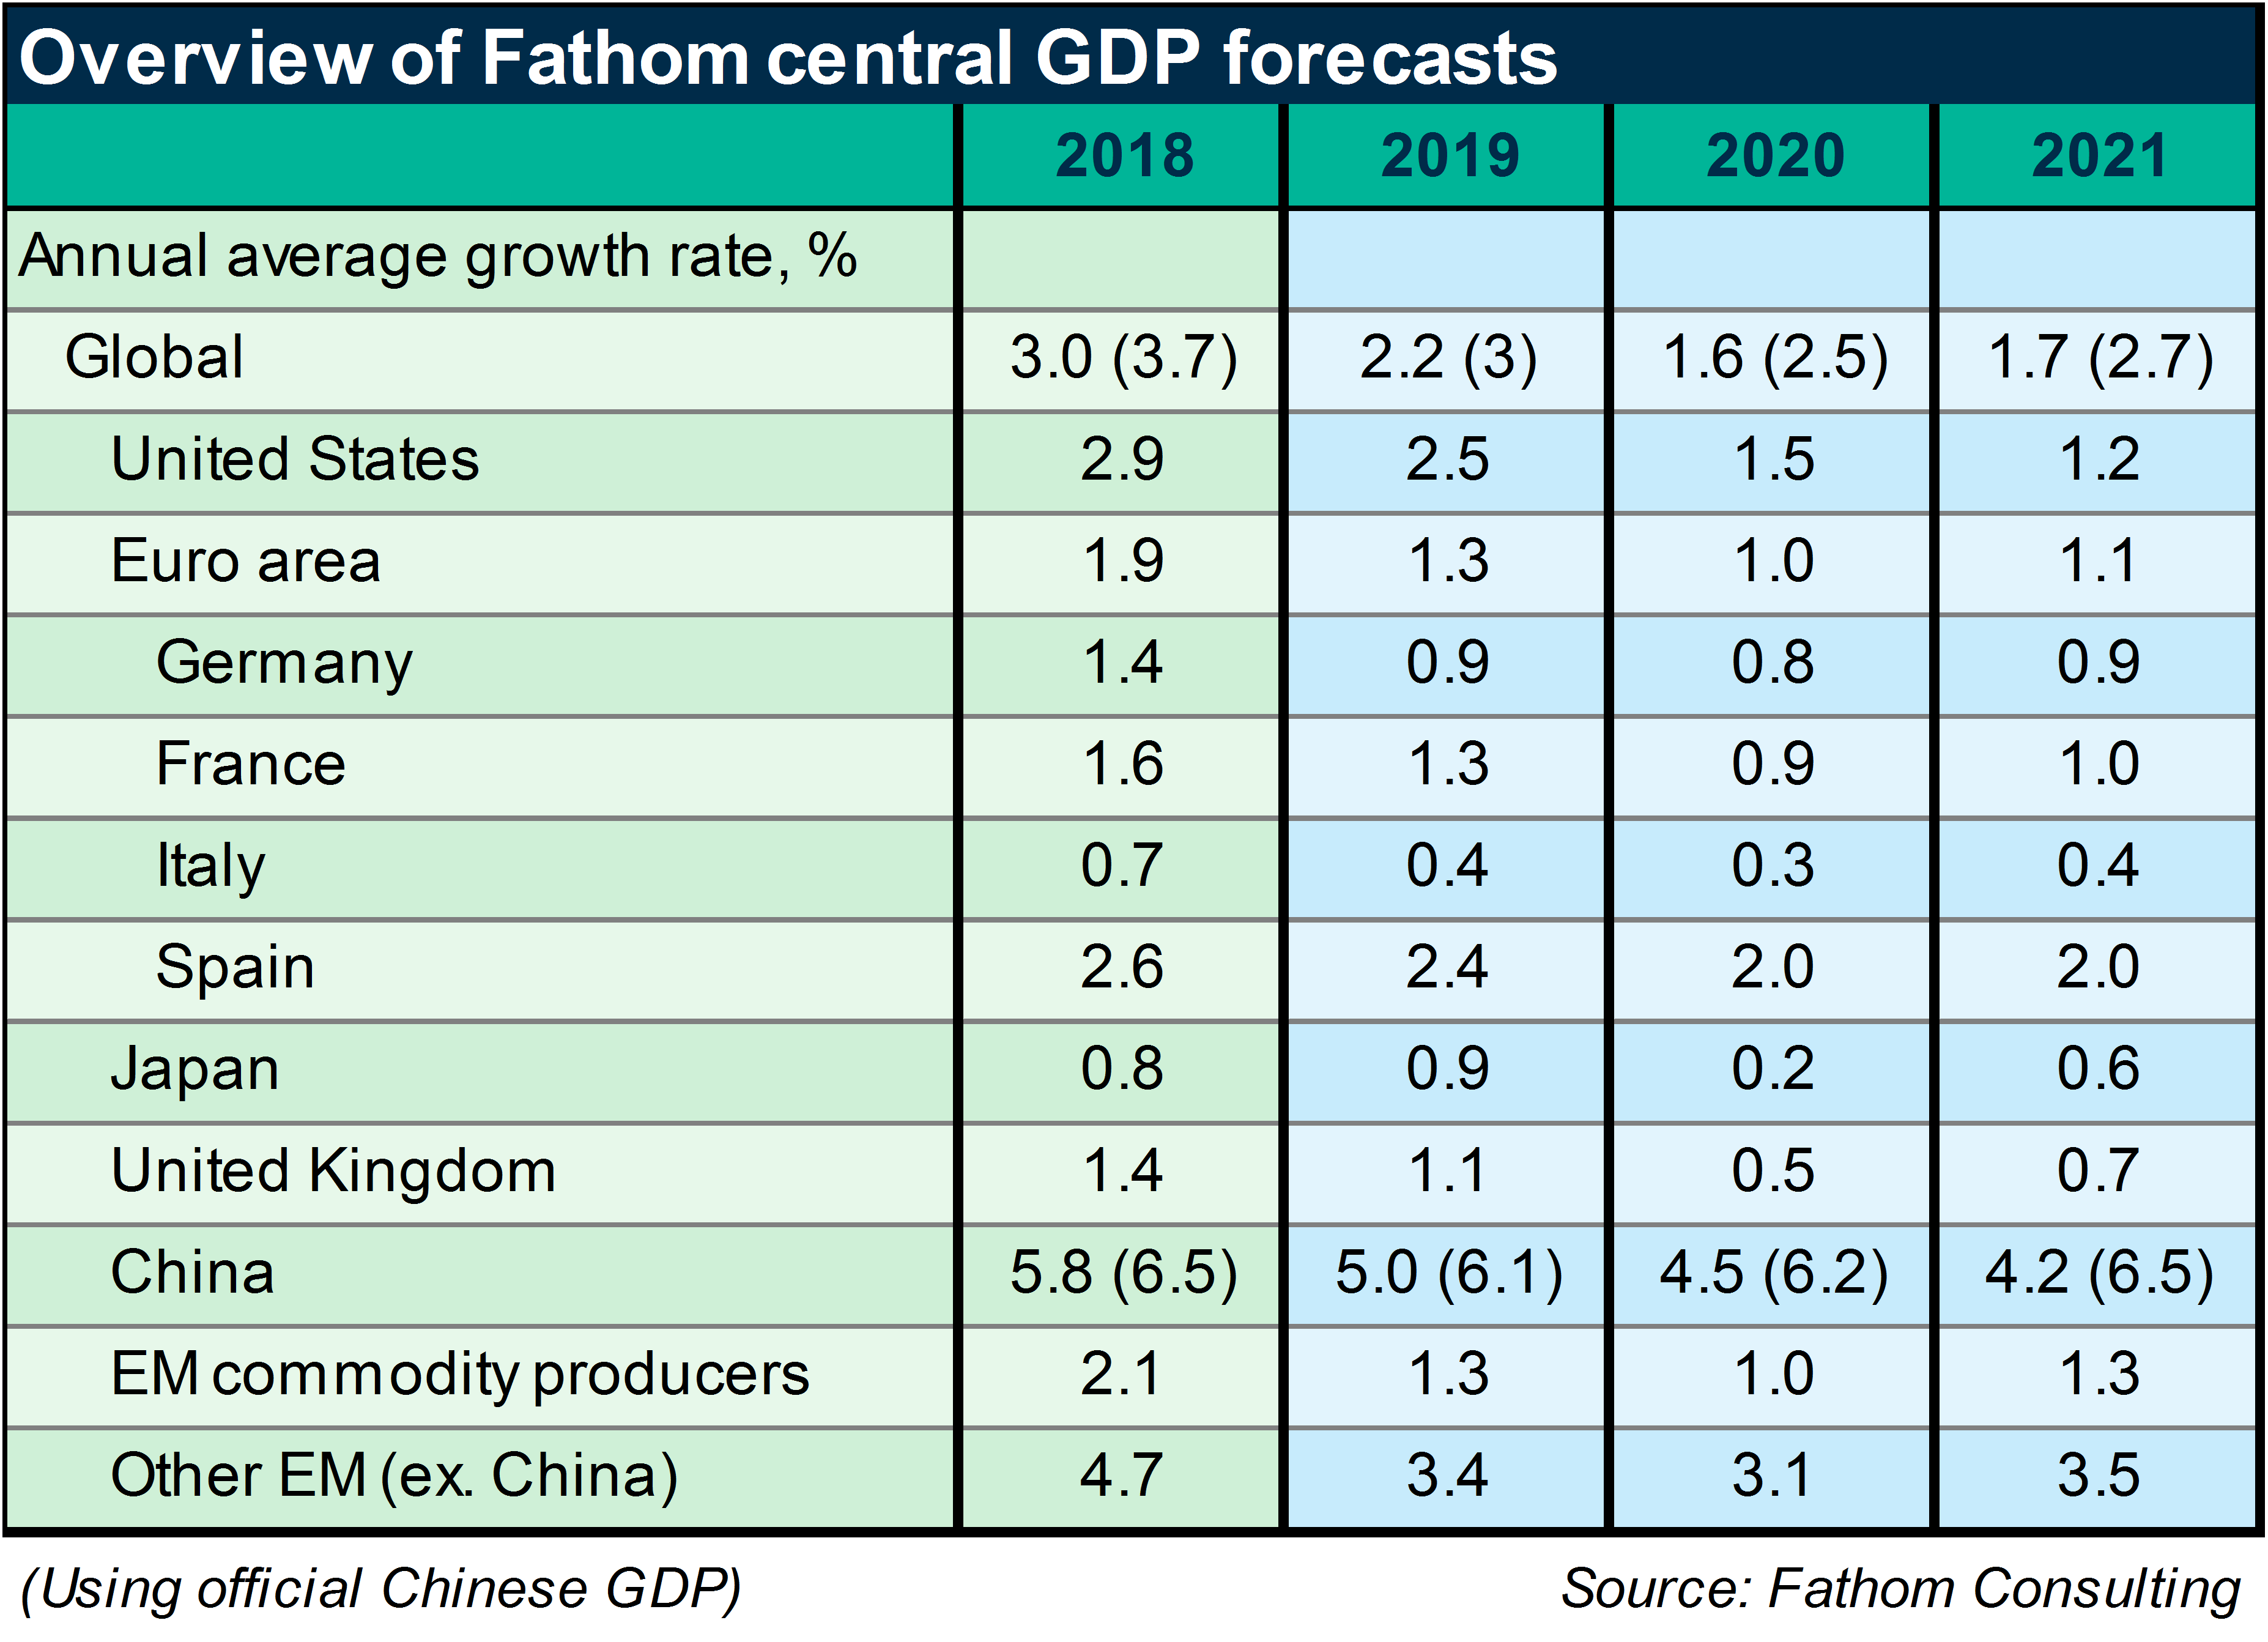
In our view we will go back through the looking glass again over the course of the coming year. Growth will slow in the US and elsewhere, but the growth outlook is not as bleak as the markets see it, particularly because the Trump administration will soft-pedal on trade tensions in the run-up to the election in 2020. Moreover, with our forecast showing US inflation close to target next year, we see no strong economic incentive for the Fed to move the policy rate in either direction. Our central forecast for growth is set out in the table above.
So, as a bottom line, we could say that in short-term perspective gold the same possibility - within 2 weeks it could stay on its own, while market will wait for major driving factors of Fed meeting and GDP report. With this two weeks we focus mostly on tactical setups and reaching of our major 1450 target.
In longer-term, the degree of uncertainty is rising which includes multiple global events of extreme importance, such as US elections, tariffs, Brexit, changing of global political situation, uncertainty in perspective of major economies - all these moments should support demand for gold.
Technical
Monthly
Monthly chart doesn't show any changes in our long-term technical view as July stands as inside month by far. Retracement now stands small and doesn't loom our view.
Market has broken through multiple important levels. They are major 3/8 Fib resistance, which also is a neckline of our extended H&S pattern and price exceeded YPR1. Once price turns in area above Pivot Resistance 1 it stops to be retracement and becomes new trend. As price stands above broken area with no return below it we should treat it as bullish sign.
Still our major OP target has not been hit yet and this moment stands in our focus right now.
Fundamental reasons for gold rising mostly relate to changing of global political and economical situation. Strong global shifts never could happen without big political events. This should provide big support to gold market. Now it is widely suggested that these processes should accelerate closer to 2020 year, or even in second half of 2019. Right now we see that it also has impact on economy.

Weekly
On weekly chart we have the same patterns but of a smaller scale. Weekly OP target coincides with the monthly one. Last two weeks gold was not able to move higher due strong overbought. Spending time in flat action decreases the overbought pressure. Although it is not totally eliminated, but now price stands right at OB level, but not above it. This could let market gradually proceed higher as investors (despite our view) hew to the Fed and wait for rate cut.
Our strategy suggests reaching of the target first around 1450 area and then starting of major retracement. It should be rather significant and should provide us good entry point for taking long-term bullish position on gold market. Weekly K-area around 1330 looks like an area where setup for position taking could be formed.

Daily
Our daily setup works nice. The deep retracement that we've discussed on Friday is done and the bottom of right wing of our butterfly pattern stands in place. The only risk factor here is bearish grabber that suggests drop below recent lows and erasing of butterfly pattern. But we have some doubts on nature of this pattern because it could appear occasionally, due weekly overbought level, but not due real change in market's sentiment.
Still, as retracement stands deeper than we thought initially, it is not big distance to recent lows and butterfly invalidation point, so overall risk of potential trade looks acceptable. Next week we check this setup. If everything goes well and butterfly starts to work, market should continue upside action to 1450 area and reach it accurately by the end of July, to the Fed meeting and GDP report.

Intraday
Let's take a look what alternative scenarios could be formed. First is, on 1H chart, market already has broken through our predefined area, where "perfect" retracement should stop. This was XOP and Fib support around 1390 area. We talked about it on Friday. The OP of larger pattern also has been passed. Downside action was strong. Still if somehow you've taken long position (as I do), we do not have any other choice but to keep stops below the butterfly invalidation point. XOP target is extended and stands below recent lows, which also cancels butterfly if market will get there.

If somehow daily grabber will work and sellers' pressure holds strong - we could get "222" Buy pattern, instead of butterfly. It is interesting that 4H OP and 1H XOP coincides around 1379. Theoretically, reaching of 4H XOP at 1345 also will be "222" Buy, but now it seems as not very probable, because this level stands below daily oversold and strong support levels.
Taking it all together, it seems that healthy decision is to place stop (for those who already have position), below 1377 level. If butterfly will be erased, but "222" starts to work - we still will be in game. If you have no positions, you have better choice - watch for bullish reversal patterns either right here, while butterfly is still valid or around 1379 when '222" Buy pattern will be formed.

Conclusion
No doubts, gold keeps positive mood, shows great upside impulse and fundamental background for continuation. Our major target of 1450 should be reached sooner rather than later - probably before end of July. Major retracement starts only after target will be hit.
The technical portion of Sive's analysis owes a great deal to Joe DiNapoli's methods, and uses a number of Joe's proprietary indicators. Please note that Sive's analysis is his own view of the market and is not endorsed by Joe DiNapoli or any related companies.
Yesterday, in EUR weekly report we've discussed in details major driving factors for all markets, and gold is not an exception - perspective of Fed policy and coming IIQ GDP US data.
Here we add a bit more that has relation to gold directly.
As Reuters reports - Gold slid as much as 2% on Friday and was set for its first weekly fall in seven weeks after data showed U.S. jobs growth rebounded strongly in June, which lowered the likelihood of an interest rate cut by the Federal Reserve this month.
Nonfarm payrolls increased by 224,000 jobs last month, the most in five months, data showed. Economists polled by Reuters had forecast payrolls rising by 160,000 jobs.
“The U.S. jobs data is driving all the pressure on gold right now. The payroll numbers crushed all expectations. That may decrease the urgency for a Fed cut in July,” said Chris Gaffney, president of world markets at TIAA Bank.
Adding pressure on gold, the dollar surged to an over two-week peak against a basket of six major currencies.
Gold is highly sensitive to interest rates and a lower chance of a cut would increase the opportunity cost of holding the non-interest-bearing bullion.
Federal funds futures implied traders now see only a 9.0% chance the U.S. central bank will decrease key money market rates by half a point, down from 29% on Wednesday, according to CME Group’s FedWatch program.
“Most of the markets though, still see some kind of cut but it pulls away that expectation of a 50-basis-points cut and most of what can be expected is a quarter-basis-point cut,” Gaffney said.
The outlook for gold still remains positive, however, analysts said. Gold hit a six-year high of $1,438.63 an ounce last week and is still holding above key technical levels.
“The yellow metal will likely find buyers as the global growth slowdown should keep demand strong for gold,” Edward Moya, senior market analyst at OANDA, said in a note.
Gold is often seen as an alternative investment during times of political and financial uncertainty.
Meanwhile, in India, the world’s second largest gold consumer, local rates surged to record highs following a surprise hike in the gold import duty on Friday.
The announcement is likely to increase the price paid by consumers, Capital Economics said in a note.
“While we had already been anticipating a slowdown in India’s gold imports this year, soaring prices and
higher tariffs present an additional headwind to demand.”
Although it may sound too brave, but somehow I agree with the comment above that "NFP data may decrease the urgency for a Fed cut in July". Despite that our view contradicts to market expectation that rate will be cut for 25 b.p. with 95% probability, we still think that no rate cut could follow.
In long-term perspective, indeed gold sentiment stands positive, which agrees with our long term view. CFTC data shows the healthy growth on net long position. SPDR fund also shows healthy data with ~ 50 tonnes surplus during the month.
Finally, recent view of Fathom on global economy perspective shows that situation stands not as bad as it represents in media. This also could act against Fed down step in July.
Not a trade war but ‘tradepolitik’ is the new normal state of relations between the US and China, Mexico and others — with threats of restrictive trade practices and implementations of those threats waxing and waning like the phases of the moon. That new normal is weighing down on sentiment, as illustrated by the manufacturing PMIs in the chart below. It is starting to dampen growth in the global economy too — but probably not by enough to tip the world into recession.
The impact we have seen to date is more than a mechanical consequence of the tariffs levied by the US and by China. Six months ago, we used our global economic model to argue that it would take a substantial escalation of trade disputes to push most major economies into recession. Specifically, we needed to see not only the US and China raise 25% tariffs on all trade with each other, but the US and the EU, and the EU and China to do likewise. That remains a distant prospect.
What we have seen in business surveys, and indeed in direct measures of world trade, such as that provided by the Netherlands Bureau for Economic Policy Analysis, is largely a consequence of fear rather than fact — it is fear that has pushed world trade below its long-term trend, creating a negative ‘trade gap’ shown in the chart on the right in the panel below. Fear can have direct, macroeconomic consequences. It will tend to produce a reduction in spending by consumers, but particularly by firms in the form of weaker investment. With that hit to spending, world trade will suffer too. The euro area is more damaged by a downturn in world trade than many major economies, with Germany particularly vulnerable. A 1% reduction in world trade below normal levels would hit the German economy twice as hard as it would hit the US economy.
Where do we go from here? If we are right, and the slowdown we have seen to date is largely attributable to fear regarding the actions of US President Donald Trump, then in principle it is within his gift to end it. On the eve of an election year, he will not want to tip the global economy into recession, with all that would imply for US equity prices. He would be quite happy, of course, if the Fed were to respond to the fear he has induced by cutting interest rates — and he has told them as much. But will it? Investors certainly hope so.
In our view we will go back through the looking glass again over the course of the coming year. Growth will slow in the US and elsewhere, but the growth outlook is not as bleak as the markets see it, particularly because the Trump administration will soft-pedal on trade tensions in the run-up to the election in 2020. Moreover, with our forecast showing US inflation close to target next year, we see no strong economic incentive for the Fed to move the policy rate in either direction. Our central forecast for growth is set out in the table above.
So, as a bottom line, we could say that in short-term perspective gold the same possibility - within 2 weeks it could stay on its own, while market will wait for major driving factors of Fed meeting and GDP report. With this two weeks we focus mostly on tactical setups and reaching of our major 1450 target.
In longer-term, the degree of uncertainty is rising which includes multiple global events of extreme importance, such as US elections, tariffs, Brexit, changing of global political situation, uncertainty in perspective of major economies - all these moments should support demand for gold.
Technical
Monthly
Monthly chart doesn't show any changes in our long-term technical view as July stands as inside month by far. Retracement now stands small and doesn't loom our view.
Market has broken through multiple important levels. They are major 3/8 Fib resistance, which also is a neckline of our extended H&S pattern and price exceeded YPR1. Once price turns in area above Pivot Resistance 1 it stops to be retracement and becomes new trend. As price stands above broken area with no return below it we should treat it as bullish sign.
Still our major OP target has not been hit yet and this moment stands in our focus right now.
Fundamental reasons for gold rising mostly relate to changing of global political and economical situation. Strong global shifts never could happen without big political events. This should provide big support to gold market. Now it is widely suggested that these processes should accelerate closer to 2020 year, or even in second half of 2019. Right now we see that it also has impact on economy.
Weekly
On weekly chart we have the same patterns but of a smaller scale. Weekly OP target coincides with the monthly one. Last two weeks gold was not able to move higher due strong overbought. Spending time in flat action decreases the overbought pressure. Although it is not totally eliminated, but now price stands right at OB level, but not above it. This could let market gradually proceed higher as investors (despite our view) hew to the Fed and wait for rate cut.
Our strategy suggests reaching of the target first around 1450 area and then starting of major retracement. It should be rather significant and should provide us good entry point for taking long-term bullish position on gold market. Weekly K-area around 1330 looks like an area where setup for position taking could be formed.
Daily
Our daily setup works nice. The deep retracement that we've discussed on Friday is done and the bottom of right wing of our butterfly pattern stands in place. The only risk factor here is bearish grabber that suggests drop below recent lows and erasing of butterfly pattern. But we have some doubts on nature of this pattern because it could appear occasionally, due weekly overbought level, but not due real change in market's sentiment.
Still, as retracement stands deeper than we thought initially, it is not big distance to recent lows and butterfly invalidation point, so overall risk of potential trade looks acceptable. Next week we check this setup. If everything goes well and butterfly starts to work, market should continue upside action to 1450 area and reach it accurately by the end of July, to the Fed meeting and GDP report.
Intraday
Let's take a look what alternative scenarios could be formed. First is, on 1H chart, market already has broken through our predefined area, where "perfect" retracement should stop. This was XOP and Fib support around 1390 area. We talked about it on Friday. The OP of larger pattern also has been passed. Downside action was strong. Still if somehow you've taken long position (as I do), we do not have any other choice but to keep stops below the butterfly invalidation point. XOP target is extended and stands below recent lows, which also cancels butterfly if market will get there.
If somehow daily grabber will work and sellers' pressure holds strong - we could get "222" Buy pattern, instead of butterfly. It is interesting that 4H OP and 1H XOP coincides around 1379. Theoretically, reaching of 4H XOP at 1345 also will be "222" Buy, but now it seems as not very probable, because this level stands below daily oversold and strong support levels.
Taking it all together, it seems that healthy decision is to place stop (for those who already have position), below 1377 level. If butterfly will be erased, but "222" starts to work - we still will be in game. If you have no positions, you have better choice - watch for bullish reversal patterns either right here, while butterfly is still valid or around 1379 when '222" Buy pattern will be formed.
Conclusion
No doubts, gold keeps positive mood, shows great upside impulse and fundamental background for continuation. Our major target of 1450 should be reached sooner rather than later - probably before end of July. Major retracement starts only after target will be hit.
The technical portion of Sive's analysis owes a great deal to Joe DiNapoli's methods, and uses a number of Joe's proprietary indicators. Please note that Sive's analysis is his own view of the market and is not endorsed by Joe DiNapoli or any related companies.