Sive Morten
Special Consultant to the FPA
- Messages
- 18,648
Fundamentals
Despite the sell-off in the beginning of the week that we've mentioned in our analysis, gold feels absolutely comfortable in current conditions. Despite the headwinds of interest rates hike, there is a lot of uncertainty around positive effect on economy and inflation. Besides geopolitical tensions stand at high level which hardly trigger sell-off in gold in near term.
Market overview
Commodity prices went on the rampage on Monday as industrial buyers and traders scrambled to source raw materials hit by supply disruptions caused by war conflict in Eastern Europe. Nickel rocketed 76%, palladium reached a record level and gold broke through $2,000 an ounce on safe-haven appeal, while oil and wheat jumped to 14-year highs.
Many markets saw rollercoaster swings, with oil and metals reversing direction as headlines flashed across traders' screens. The ferocity of some gains was fuelled by speculators cancelling out bearish positions, but once that buying ran its course, prices slid, traders said. Commodity markets have been shaken not only by tough Western sanctions on Russia that might be widened to include oil, but logistics turmoil that has blocked the flow of grains and metals from the region.

The searing rally in raw material prices has sparked concerns over economic growth in countries still recovering from the COVID-19 pandemic.
Oil prices spiked after the United States and European allies said they were considering banning imports of Russian oil. Brent crude surged as much as 17.8% to $139.13 a barrel, its highest since July 2008, when it hit a record of $147.50, but later reversed and shed $20.
Germany said it did not currently plan to stop energy imports from Russia. JPMorgan analysts said oil could soar to $185 this year, while analysts at Mitsubishi UFJ Financial Group Inc said it may rise to $180 and cause a global recession. Worries about an oil ban also roiled European gas prices, which hit record highs.
The panic spurred investors to take cover in gold, regarded as a safe haven from turmoil in other markets.

Euro zone real government bond yields fell sharply as surging energy prices fueled concerns that global economies are at risk of stagflation, a condition in which prices soar while growth stagnates. Germany's 10-year and 30-year inflation-linked government bond yields fell to new record lows , while the benchmark U.S. 10-year Treasury yield rose slightly after touching its lowest level in two months.
Bank of America analysts estimate that the loss of Russia's 5 million barrels a day could cause crude oil prices to hit $200 a barrel. Russia supplies around 10% of the world's nickel, and investors fear that Western sanctions against Russia could disrupt air and sea shipments of commodities produced and exported by Russia.
Goldman Sachs hiked its price forecasts for Brent oil saying the world could be facing one of "largest energy supply shocks ever" because of the Ukraine crisis, while Barclays said prices in its worst case scenario could top $200 a barrel.
China's central bank is uniquely placed to backstop a global commodities crisis sparked by sanctions imposed in response to Russia's invasion of Ukraine, potentially paving the way for a much stronger yuan, a Credit Suisse investment strategist said. In a note published on Monday, Zoltan Pozsar, global head of the bank's short-term interest rate strategy, said the unfolding crisis in Ukraine had led to a "perfect storm" in commodities that could weaken the Eurodollar system, contribute to inflation in Western economies and threaten financial stability.
Western central banks, held back by sanctions imposed by their own governments, will not be able to provide support such as emergency liquidity needed to close market gaps, he said, adding that the People's Bank of China (PBOC) faced no such restrictions. Pozsar said selling U.S. Treasuries to fund vessel leasing and purchases of cheap Russian commodities would help the PBOC control inflation in China, while leading to commodity shortages, recession, and higher yields in Western economies. Alternatively, the PBOC could print yuan to buy Russian commodities.
Gold extended its rally towards a record high on Tuesday, after investors made a beeline for the traditional safe-haven metal on mounting fears around the Russia-Ukraine crisis, with the U.S. and Britain saying they would ban oil from Moscow.

Retracement on Wednesday can't change the opinion of the investors, that nothing is over yet.
Gold steadied near the $2,000 an ounce level on Thursday, after big gyrations over the past couple of sessions, as its safe-haven appeal was supported by a lack of progress in talks between Russia and Ukraine. A rush to safe-haven assets earlier this week had pushed gold near the record levels hit in August 2020.
Investors also took stock of February inflation data from the United States, which was in line with expectations but also showed the biggest year-on-year increase since January 1982. Overall, gold and palladium are still "relatively strong", with technicals pointed to the upside, said Eli Tesfaye, senior market strategist at RJO Futures, adding that Thursday's price action is likely to set the tone going forward.
Commodities: Time to shine
(By Pimco)
Commodities have typically performed well late in the business cycle – and during periods of global turmoil – offering a potential hedge against inflation and disruption. In the decade since the global financial crisis, low inflation persisted and commodities performed poorly. Until recently. Over the past year, pandemic-induced supply shortages and demand spikes have driven inflation higher, and commodities are beginning to shine. In addition, the correlation between equities and bonds has been turning positive as inflation rises, further making the case for increasing commodity allocations. Three key pillars support our view, low oil inventories, high roll yields and diversification.
Low oil inventories: Inventories have hit low levels amid surging COVID-reopening demand and lagging supply. This imbalance is most acute in energy markets, where producers, faced with environmental restrictions and poor returns, have underinvested in drilling new wells -- both shale oil and conventional. In turn, prices have escalated. And the sting of higher energy costs can be felt in the rising prices of other commodities. Producing base metals – central to the world’s move away from fossil fuels – is highly energy intensive. Similarly, natural gas is used to make ammonia fertilizer – a key cost of agricultural products. To meet current and projected demand, energy producers will need to invest in new capacity. But we think they will wait to bring more rigs online until they are confident that price strength will last.
High roll yields: Consistent with lower inventories, most major commodity markets are in a state of backwardation (forward prices are lower than spot prices), which is the single strongest historical predictor of forward returns. The “roll yield” (derived from rolling a lower-priced longer-term contract into a higher-priced short-term contract) for the Bloomberg Commodity Index (BCOM) is averaging over 5% positive, exceeding the combined buyback and net dividend yield for the S&P 500. This is the highest level of backwardation after adjusting for short term rates since the early 2000s, which preceded the last commodities supercycle. While we think it is premature to call a supercycle, as higher prices will ultimately beget more supply, holding commodities to hedge inflation risks is more attractive when carry provides a tailwind.
Diversification amid inflation: Commodities have historically provided critical diversification for investors as the business cycle advances, and inflation becomes a dominant driver of asset prices rather than growth. To be sure, while nominal asset classes such as equities and fixed income have had a negative response to inflation surprises, real assets such as commodities have historically tended to be effective as inflation hedges. For a 1% unexpected change in inflation, commodities have historically delivered excess returns of over 8%.
The last central bank hiking cycle in 2018 was an exception. Commodities didn’t lead asset returns largely. At that time, the relentless rise in shale oil production deflated costs, providing a headwind to all commodity returns. We think this time historical commodity price trends will return and that the commodity cycle has begun. In January and February, as markets grappled with repricing a faster pace of central bank tightening, both equities and bonds generally struggled while most commodity indices climbed 15% to 22%.
Geopolitical risk: It is against this backdrop that the recent events concerning Russia and Ukraine are playing out. While current energy production has not been disrupted thus far, and sanctions, as of yet, are designed to prevent disruption of current supplies, exports are being negatively impacted by concerns around shipping, insurance, and credit. As such, it did not require sanctions on Russian exports to lead to declining availability. In addition, sanctions are likely to limit the flow of capital and technology to Russian oil, gas, and mineral extraction companies. We believe this is directionally supportive of long-term energy and materials prices. With Germany halting the review of the Nord stream 2 natural gas pipeline, it is likely that much of the volatility we have experienced in natural gas this past year will continue into the foreseeable future.
Investment takeaways: We see a strong case for a heavier commodities allocation in investor portfolios. Investors and equity indices are currently under-allocated to commodities relative to historical averages. Yet we expect, high and volatile inflation – rather than growth – may be the biggest driver of equity and fixed income returns over the coming year, making commodities a valuable potential hedge to the traditional 60/40 portfolio. Moreover, the current supply-demand imbalance and high roll yields provide supportive tailwinds, positioning commodities to shine.

COT Report
Although net long positions chart shows not very significant change, in reality changes are solid. Take a look at the CFTC numbers. Open Interest jumps for 10% just in one week, while as hedgers as speculators significantly increase possession with the gold, despite that price hits 2K area. The demand for precious metal funds jumped to a six-week high as they obtained $1.67 billion in net buying, while, energy funds received $1.3 million.

As a bottom line:
In general we agree with the Pimco view. In fact there are two major drivers for the gold market that is closely tighten with each other. First is geopolitical tensions, which, as we've forecasted, hardly end soon and stands for the long term. Second is difficult situation in the US with rising inflation. And we would say that the former is more important than the latter. Because geopolitics now at high degree depends on how political and economical situation in the US will go. Our view is the US inflation has structural nature, not fiscal, and it can't be stopped by just rising the rate. Now, still few people understand it, and american government tries to conceal it from population, putting responsibility on external factors and on Putin personally. Yesterday we already mention this in our FX report:

Now we see just minor signs of grumbling in population and dropping Democrats rating, but this trend should accelerate in coming month and we suggest that Democrats lose elections in November. They try to say - "hey, this is not our fault, its Putin price hike, force-major, what we could do?" Supposedly the US intentionally banned Crude Oil supply from Russia to disguise the inner problem. In fact, the share of Russian oil in the US is very small, and it can't make any feasible impact on the economy. Besides, the US has enough own oil to extract and refine. This has been done to use as external reason of the problems that Biden administration has, which they do not know what to do with it and just to take off the responsibility from the Fed and Administration. When they start rising rates, but inflation doesn't go away - they will tell that we did everything that we could, but this is external factor that is out of our control.
This makes us think that nominal interest rates will be 1-2 steps behind inflation rate, which should keep real interest rates in negative or near-zero territory. This is the perfect background for the gold rally. Investors' demand for safe haven also should keep interest rates under the pressure and simultaneously support gold, which will be double positive sub-product.
Speaking on geopolitics, we see big chances of further escalation with involving Eastern European limitrophes of the US, such as Poland and Baltic countries. At least we can't totally ignore this scenario. Our position is based on two moments. The US needs EU money, so they need to support instability in the region. Strategically they also need to cut EU from any economical relation with Russia and China once and for all to avoid competition. Thus, harder conflict should serve well to this target. Normalization geopolitical situation in Europe contracts demand for the US assets and money flows to the US, and Biden once again will have to explain people why inflation is not dropping.
Whatever scenario we get - anyway it will be positive to the gold. More geopolitical escalation in the EU - more demand for the gold. Normalization in the EU - rising inflation in the US and negative interest rates, with possible falling in stagflation. Despite that $2000 level now seems solid, it might just a beginning, and our 2600$ next target doesn't look impossible any more. Besides, as it was said above - dollar could start loosing value naturally, if commodities export will be re-directed through China hub and trading gradually turns to renminbi.
Technicals
Monthly
It seems that gold is stuck around 2070$ area for some time, as it hits monthly overbought area. February grabber has been erased, so, bearish context that we've mentioned last time now is off the table. Market stands above YPR1, which is definitely the bullish sign. Very often this happens before strong long-term upside rally. Thus, current pullback looks reasonable. Monthly trend turns bullish, but it is not confirmed yet, as March is still under way.
Here you can see our big AB-CD pattern with OP at 2600$. It is long way to run...

Weekly
Here price drops below oversold level, both targets also have been completed, and price already has done the minimal 3/8 necessary pullback. With the huge shooting star pattern on the top, it probable makes no sense to hurry up with new entry and wait for some stabilization, watching for possible deeper retracement. As EU money starts to flow to the US, in April and May we could see temporal easing of inflationary pressure, that could be mistakenly treated as effect of Fed rate change and trigger deeper retracement on the Gold market. This should let us to get sweet entry levels:

Daily
So, market briefly touched K-support area, starting upward bounce. Daily trend stands bullish. As we said, this was good entry level as it is protected by strong K-area and daily oversold. At the same time, we have huge bearish engulfing pattern, that now keeps us aside from taking new long position for investing, because usually engulfing pattern leads to AB-CD retracement shape. Thus, once initial upside pullback ends, another downside leg might get started.

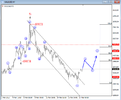
Intraday
Those who would like to make long trades could consider either minor H&S pattern that is forming right now at the bottom or watch for the large pattern, and wait for forming of the right arm's bottom, as usual. Potential target of this trade is 2027 Agreement area. While bears probably should wait when upside pullback will be over, or bullish setup fails.

Despite the sell-off in the beginning of the week that we've mentioned in our analysis, gold feels absolutely comfortable in current conditions. Despite the headwinds of interest rates hike, there is a lot of uncertainty around positive effect on economy and inflation. Besides geopolitical tensions stand at high level which hardly trigger sell-off in gold in near term.
Market overview
Commodity prices went on the rampage on Monday as industrial buyers and traders scrambled to source raw materials hit by supply disruptions caused by war conflict in Eastern Europe. Nickel rocketed 76%, palladium reached a record level and gold broke through $2,000 an ounce on safe-haven appeal, while oil and wheat jumped to 14-year highs.
"Nerves of steel will be needed amid the extreme volatility," analyst Daniel Briesemann at Commerzbank in Frankfurt said in a note.
Many markets saw rollercoaster swings, with oil and metals reversing direction as headlines flashed across traders' screens. The ferocity of some gains was fuelled by speculators cancelling out bearish positions, but once that buying ran its course, prices slid, traders said. Commodity markets have been shaken not only by tough Western sanctions on Russia that might be widened to include oil, but logistics turmoil that has blocked the flow of grains and metals from the region.
The searing rally in raw material prices has sparked concerns over economic growth in countries still recovering from the COVID-19 pandemic.
"I suspect growth projections for 2022 around the world will need to be sharply revised lower, and it will be interesting to see what the central banks of the world will do, " OANDA senior analyst Jeffrey Halley said in a report.
Oil prices spiked after the United States and European allies said they were considering banning imports of Russian oil. Brent crude surged as much as 17.8% to $139.13 a barrel, its highest since July 2008, when it hit a record of $147.50, but later reversed and shed $20.
Germany said it did not currently plan to stop energy imports from Russia. JPMorgan analysts said oil could soar to $185 this year, while analysts at Mitsubishi UFJ Financial Group Inc said it may rise to $180 and cause a global recession. Worries about an oil ban also roiled European gas prices, which hit record highs.
The panic spurred investors to take cover in gold, regarded as a safe haven from turmoil in other markets.
Euro zone real government bond yields fell sharply as surging energy prices fueled concerns that global economies are at risk of stagflation, a condition in which prices soar while growth stagnates. Germany's 10-year and 30-year inflation-linked government bond yields fell to new record lows , while the benchmark U.S. 10-year Treasury yield rose slightly after touching its lowest level in two months.
"The crippling effect of oil prices above $130 would send many European economies into a recession," and that scenario caused European stocks to move into bear market territory, said Edward Moya, senior analyst at OANDA. The U.S. can handle not having any Russian energy supplies, but that is not the case for Europe."
Bank of America analysts estimate that the loss of Russia's 5 million barrels a day could cause crude oil prices to hit $200 a barrel. Russia supplies around 10% of the world's nickel, and investors fear that Western sanctions against Russia could disrupt air and sea shipments of commodities produced and exported by Russia.
Goldman Sachs hiked its price forecasts for Brent oil saying the world could be facing one of "largest energy supply shocks ever" because of the Ukraine crisis, while Barclays said prices in its worst case scenario could top $200 a barrel.
The conflict and broader supply-chain disruptions provide a challenging backdrop for upcoming central bank meetings, ANZ economist Finn Robinson wrote in a note to investors. Policy makers will need to safeguard the smooth transmission of monetary policy whilst also shoring up their inflation credentials at a time of surging inflation pressures and growing evidence of second round effects," Robinson wrote.
China's central bank is uniquely placed to backstop a global commodities crisis sparked by sanctions imposed in response to Russia's invasion of Ukraine, potentially paving the way for a much stronger yuan, a Credit Suisse investment strategist said. In a note published on Monday, Zoltan Pozsar, global head of the bank's short-term interest rate strategy, said the unfolding crisis in Ukraine had led to a "perfect storm" in commodities that could weaken the Eurodollar system, contribute to inflation in Western economies and threaten financial stability.
"This crisis is not like anything we have seen since President Nixon took the U.S. dollar off gold in 1971 – the end of the era of commodity-based money," said Pozsar. "When this crisis (and war) is over, the U.S. dollar should be much weaker and ... the renminbi much stronger, backed by a basket of commodities. Russian commodities today are like subprime (collateralized debt obligations) were in 2008. Conversely, non-Russian commodities are like U.S. Treasury securities were back in 2008. One collapsing in price, and the other one surging in price, with margin calls on both regardless of which side you are on," Pozsar said.
Western central banks, held back by sanctions imposed by their own governments, will not be able to provide support such as emergency liquidity needed to close market gaps, he said, adding that the People's Bank of China (PBOC) faced no such restrictions. Pozsar said selling U.S. Treasuries to fund vessel leasing and purchases of cheap Russian commodities would help the PBOC control inflation in China, while leading to commodity shortages, recession, and higher yields in Western economies. Alternatively, the PBOC could print yuan to buy Russian commodities.
"That's the birth of the Euro-renminbi market and China's first real step to break the hegemony of the Eurodollar market. That is also inflationary for the West and means less demand for long-term Treasuries," Pozsar said.
Gold extended its rally towards a record high on Tuesday, after investors made a beeline for the traditional safe-haven metal on mounting fears around the Russia-Ukraine crisis, with the U.S. and Britain saying they would ban oil from Moscow.
"The combination of roaring energy prices, grain prices, base metal prices is culminated in dramatic inflationary pressures that continue to be the major underlying support behind gold moves higher," said David Meger, director of metals trading at High Ridge Futures. In addition, we're seeing significant amount of safe-haven bids in the gold market as equity markets have come under pressure due to major concerns on the geopolitical front."
Retracement on Wednesday can't change the opinion of the investors, that nothing is over yet.
"Things can't just keep going up. At some point, equilibrium level has to be reached," said Edward Meir, analyst with ED&F Man Capital Markets, adding palladium could still go higher since it was in a deficit prior to the crisis. "At some stage, all these commodity prices have to discount the fact that there's no Russian output coming in no matter what commodity you're talking about," Meir added.
"We got a little carried away with gold, but we're at a much firmer footing than before this conflict, mainly because I still think the Federal Reserve and other central banks are going to be very cautious about how they reduce liquidity," said Bart Melek, head of commodity strategies at TD Securities.
"If the current instability in geopolitical terms continues, it's very likely we'll seek fresh all-time highs for precious metals," said Michael McCarthy, chief strategy officer at Tiger Brokers, Australia.
Gold steadied near the $2,000 an ounce level on Thursday, after big gyrations over the past couple of sessions, as its safe-haven appeal was supported by a lack of progress in talks between Russia and Ukraine. A rush to safe-haven assets earlier this week had pushed gold near the record levels hit in August 2020.
Investors also took stock of February inflation data from the United States, which was in line with expectations but also showed the biggest year-on-year increase since January 1982. Overall, gold and palladium are still "relatively strong", with technicals pointed to the upside, said Eli Tesfaye, senior market strategist at RJO Futures, adding that Thursday's price action is likely to set the tone going forward.
"The inflation numbers are certainly an underlying bullish element for gold. However, geopolitics is trumping economic data right now," said Jim Wycoff, senior analyst at Kitco Metals. (Gold) bulls spent a lot of energy pushing prices to a record high earlier this week. Now, even bullish inflation data isn't given much benefit because (prices) are just exhausted."
Commodities: Time to shine
(By Pimco)
Commodities have typically performed well late in the business cycle – and during periods of global turmoil – offering a potential hedge against inflation and disruption. In the decade since the global financial crisis, low inflation persisted and commodities performed poorly. Until recently. Over the past year, pandemic-induced supply shortages and demand spikes have driven inflation higher, and commodities are beginning to shine. In addition, the correlation between equities and bonds has been turning positive as inflation rises, further making the case for increasing commodity allocations. Three key pillars support our view, low oil inventories, high roll yields and diversification.
Low oil inventories: Inventories have hit low levels amid surging COVID-reopening demand and lagging supply. This imbalance is most acute in energy markets, where producers, faced with environmental restrictions and poor returns, have underinvested in drilling new wells -- both shale oil and conventional. In turn, prices have escalated. And the sting of higher energy costs can be felt in the rising prices of other commodities. Producing base metals – central to the world’s move away from fossil fuels – is highly energy intensive. Similarly, natural gas is used to make ammonia fertilizer – a key cost of agricultural products. To meet current and projected demand, energy producers will need to invest in new capacity. But we think they will wait to bring more rigs online until they are confident that price strength will last.
High roll yields: Consistent with lower inventories, most major commodity markets are in a state of backwardation (forward prices are lower than spot prices), which is the single strongest historical predictor of forward returns. The “roll yield” (derived from rolling a lower-priced longer-term contract into a higher-priced short-term contract) for the Bloomberg Commodity Index (BCOM) is averaging over 5% positive, exceeding the combined buyback and net dividend yield for the S&P 500. This is the highest level of backwardation after adjusting for short term rates since the early 2000s, which preceded the last commodities supercycle. While we think it is premature to call a supercycle, as higher prices will ultimately beget more supply, holding commodities to hedge inflation risks is more attractive when carry provides a tailwind.
Diversification amid inflation: Commodities have historically provided critical diversification for investors as the business cycle advances, and inflation becomes a dominant driver of asset prices rather than growth. To be sure, while nominal asset classes such as equities and fixed income have had a negative response to inflation surprises, real assets such as commodities have historically tended to be effective as inflation hedges. For a 1% unexpected change in inflation, commodities have historically delivered excess returns of over 8%.
The last central bank hiking cycle in 2018 was an exception. Commodities didn’t lead asset returns largely. At that time, the relentless rise in shale oil production deflated costs, providing a headwind to all commodity returns. We think this time historical commodity price trends will return and that the commodity cycle has begun. In January and February, as markets grappled with repricing a faster pace of central bank tightening, both equities and bonds generally struggled while most commodity indices climbed 15% to 22%.
Geopolitical risk: It is against this backdrop that the recent events concerning Russia and Ukraine are playing out. While current energy production has not been disrupted thus far, and sanctions, as of yet, are designed to prevent disruption of current supplies, exports are being negatively impacted by concerns around shipping, insurance, and credit. As such, it did not require sanctions on Russian exports to lead to declining availability. In addition, sanctions are likely to limit the flow of capital and technology to Russian oil, gas, and mineral extraction companies. We believe this is directionally supportive of long-term energy and materials prices. With Germany halting the review of the Nord stream 2 natural gas pipeline, it is likely that much of the volatility we have experienced in natural gas this past year will continue into the foreseeable future.
Investment takeaways: We see a strong case for a heavier commodities allocation in investor portfolios. Investors and equity indices are currently under-allocated to commodities relative to historical averages. Yet we expect, high and volatile inflation – rather than growth – may be the biggest driver of equity and fixed income returns over the coming year, making commodities a valuable potential hedge to the traditional 60/40 portfolio. Moreover, the current supply-demand imbalance and high roll yields provide supportive tailwinds, positioning commodities to shine.
COT Report
Although net long positions chart shows not very significant change, in reality changes are solid. Take a look at the CFTC numbers. Open Interest jumps for 10% just in one week, while as hedgers as speculators significantly increase possession with the gold, despite that price hits 2K area. The demand for precious metal funds jumped to a six-week high as they obtained $1.67 billion in net buying, while, energy funds received $1.3 million.
As a bottom line:
In general we agree with the Pimco view. In fact there are two major drivers for the gold market that is closely tighten with each other. First is geopolitical tensions, which, as we've forecasted, hardly end soon and stands for the long term. Second is difficult situation in the US with rising inflation. And we would say that the former is more important than the latter. Because geopolitics now at high degree depends on how political and economical situation in the US will go. Our view is the US inflation has structural nature, not fiscal, and it can't be stopped by just rising the rate. Now, still few people understand it, and american government tries to conceal it from population, putting responsibility on external factors and on Putin personally. Yesterday we already mention this in our FX report:
Now we see just minor signs of grumbling in population and dropping Democrats rating, but this trend should accelerate in coming month and we suggest that Democrats lose elections in November. They try to say - "hey, this is not our fault, its Putin price hike, force-major, what we could do?" Supposedly the US intentionally banned Crude Oil supply from Russia to disguise the inner problem. In fact, the share of Russian oil in the US is very small, and it can't make any feasible impact on the economy. Besides, the US has enough own oil to extract and refine. This has been done to use as external reason of the problems that Biden administration has, which they do not know what to do with it and just to take off the responsibility from the Fed and Administration. When they start rising rates, but inflation doesn't go away - they will tell that we did everything that we could, but this is external factor that is out of our control.
This makes us think that nominal interest rates will be 1-2 steps behind inflation rate, which should keep real interest rates in negative or near-zero territory. This is the perfect background for the gold rally. Investors' demand for safe haven also should keep interest rates under the pressure and simultaneously support gold, which will be double positive sub-product.
Speaking on geopolitics, we see big chances of further escalation with involving Eastern European limitrophes of the US, such as Poland and Baltic countries. At least we can't totally ignore this scenario. Our position is based on two moments. The US needs EU money, so they need to support instability in the region. Strategically they also need to cut EU from any economical relation with Russia and China once and for all to avoid competition. Thus, harder conflict should serve well to this target. Normalization geopolitical situation in Europe contracts demand for the US assets and money flows to the US, and Biden once again will have to explain people why inflation is not dropping.
Whatever scenario we get - anyway it will be positive to the gold. More geopolitical escalation in the EU - more demand for the gold. Normalization in the EU - rising inflation in the US and negative interest rates, with possible falling in stagflation. Despite that $2000 level now seems solid, it might just a beginning, and our 2600$ next target doesn't look impossible any more. Besides, as it was said above - dollar could start loosing value naturally, if commodities export will be re-directed through China hub and trading gradually turns to renminbi.
Technicals
Monthly
It seems that gold is stuck around 2070$ area for some time, as it hits monthly overbought area. February grabber has been erased, so, bearish context that we've mentioned last time now is off the table. Market stands above YPR1, which is definitely the bullish sign. Very often this happens before strong long-term upside rally. Thus, current pullback looks reasonable. Monthly trend turns bullish, but it is not confirmed yet, as March is still under way.
Here you can see our big AB-CD pattern with OP at 2600$. It is long way to run...
Weekly
Here price drops below oversold level, both targets also have been completed, and price already has done the minimal 3/8 necessary pullback. With the huge shooting star pattern on the top, it probable makes no sense to hurry up with new entry and wait for some stabilization, watching for possible deeper retracement. As EU money starts to flow to the US, in April and May we could see temporal easing of inflationary pressure, that could be mistakenly treated as effect of Fed rate change and trigger deeper retracement on the Gold market. This should let us to get sweet entry levels:
Daily
So, market briefly touched K-support area, starting upward bounce. Daily trend stands bullish. As we said, this was good entry level as it is protected by strong K-area and daily oversold. At the same time, we have huge bearish engulfing pattern, that now keeps us aside from taking new long position for investing, because usually engulfing pattern leads to AB-CD retracement shape. Thus, once initial upside pullback ends, another downside leg might get started.
Intraday
Those who would like to make long trades could consider either minor H&S pattern that is forming right now at the bottom or watch for the large pattern, and wait for forming of the right arm's bottom, as usual. Potential target of this trade is 2027 Agreement area. While bears probably should wait when upside pullback will be over, or bullish setup fails.