Sive Morten
Special Consultant to the FPA
- Messages
- 18,639
Fundamentals
Gold market this week was mostly in the same boat as the other ones, and investors were watching for the Fed statement and statistics that could re-shape the market in short-term and make impact on the sentiment. In general, gold market is very unstable in recent weeks and sentiment changes drastically very often. Usually this type of sentiment is more typical before downside trend as it is the 2nd side of the fear. When market prepares to rally it usually shows the gradual positive change in positions and investors' mood. Right now, based on COT reports we see that gold is overreacting of any fundamental events. Just recently we saw big jump in bullish position, but this week good data has put gold in depression and triggered massive positions covering. This "sensitivity" promises nothing good to investors. It looks like market is scared by something and nervous of every sudden noises.
Market overview
Gold gained on Monday, as surging COVID-19 cases boosted the metal's safe-haven appeal, aided by a weaker dollar ahead of the U.S. Federal Reserve's meeting this
week, while auto-catalyst palladium held below a record peak scaled last week.
"The COVID-19 situation in India and Japan is deteriorating. So that is boiling demand for safety, resulting in higher gold prices," said Margaret Yang, a strategist at DailyFX, adding that an easing dollar is further supporting prices. Сases in India registered a record surge, while Japan declared states of emergency for Tokyo, Osaka and two other prefectures on Friday to combat a spike. On the other hand, investors are looking at very strong U.S. economic data release," said Yang, adding higher yields are capping gold's gains.
U.S. factory activity powered ahead in early April, while retail sales jumped to a record high in March and hiring accelerated. New orders for key U.S.-made capital goods rose solidly in March and shipments surged, cementing expectations that economic growth accelerated in the first quarter as massive government aid and improving public health boosted demand.
U.S. consumer confidence jumped to a 14-month high in April as increased vaccinations against COVID-19 and additional fiscal stimulus allowed for more services businesses to reopen, boosting demand and hiring by companies. Analysts and traders have slashed their gold price forecasts, with many believing a return to last year's record highs is unlikely as economic recovery tarnishes the safe-haven metal's appeal, a Reuters poll showed on Tuesday.
Gold prices rose on Thursday bolstered by the U.S. Federal Reserve's pledge to maintain easy monetary policy to aid economic recovery, while a weaker dollar provided further support.
The Federal Reserve held interest rates and its bond-buying program steady on Wednesday after its two-day policy meet despite taking a rosier view of the U.S. economic recovery. Fed Chair Jerome Powell also said the coming price increases would almost surely be of a passing nature, and not present the sort of persistent problem that would force the central bank to begin raising interest rates sooner than expected.
U.S. President Joe Biden plans to unveil a sweeping $1.8 trillion package for families and education in his first speech to Congress. Gold tends to benefit from widespread stimulus measures from central banks because it is viewed as a hedge against inflation.
Meanwhile, the U.S. trade deficit in goods jumped to a record high in March, suggesting trade was a drag on economic growth in the first quarter, but that was likely offset by robust domestic demand amid massive government aid.
Gold prices dipped on Friday, set for their worst week in a month, as U.S. Treasury yields gained on strong economic data and dented the non-yielding metal's appeal
Despite the decline, bullion was poised for its first monthly gain of the year.
Data showed late Thursday that U.S. economic growth accelerated in the first quarter as fiscal stimulus fuelled consumer spending.
"This string of consecutively strong U.S. economic data is weighing on gold," said Stephen Innes, managing partner at SPI Asset Management, adding that people would rather book profits on month-end after a decent run-up in gold. Gold still remains bid, it is just not a strong hand right now, because of the month-end rebalancing."
Benchmark U.S. 10-year Treasury yields hovered near their highest in more than two weeks, increasing the opportunity cost of holding non-yielding bullion. Earlier this week, the Fed held interest rates and its bond-buying program steady.
"Ongoing strength in domestic data should lead to an incrementally hawkish turn in Fed guidance over the coming months," UBS analysts said in a note. Higher U.S. real rates will likely trigger further ETF outflows, UBS said, adding that they expect bullion to fall to $1,600 per ounce by year-end.
COT Report
As we've said in the beginning of the report, recent data on investors' positions is very wobbling. We see massive changes in opposite directions in a very tight time period. It means that investors do not have some extended consistency and reacts frightenedly on any whisper. This doesn't correspond to normal bullish sentiment. It means that overall situation stands fragile and any small push could trigger collapse, especially on mostly bearish background.
Thus, this week again - take a look that open interest has dropped for 20+K and speculators have increased bearish exposure for 10K contracts. Besides, a lot of spreading positions where closed.

At first glance, net position has not changed, but...

Take a look at open interest chart. It is definitely shows that interest to gold market is dropping since the beginning of the year. Investors are abandoning it. As it was mentioned above - maybe recent drop is a result of asset rebalancing again. This is definitely negative sign for the market.

So, today we try to not repeat the same things that we've discussed yesterday about major driving factors. We had in-depth discussion where we've made important conclusion on inflation situation, Fed strategy and US economy conditions. Some new details that relates to gold market makes the overall picture completed and it is perfectly expressed by UBS comments - drop to $1600 by the end of the year.
Indeed, now even most conservative sceptics do not have any doubts that US and global economy recovers. And does it with impressive pace. The recovery stands across the board, involving all spheres - employment, consumption, production, inflation, business sentiment etc., that reflexed in most common statistics, such as recent GDP release. Rebalancing of global financial portfolios also could be seen on the markets, where investors relocate assets and prepare for growth stage of the economy.
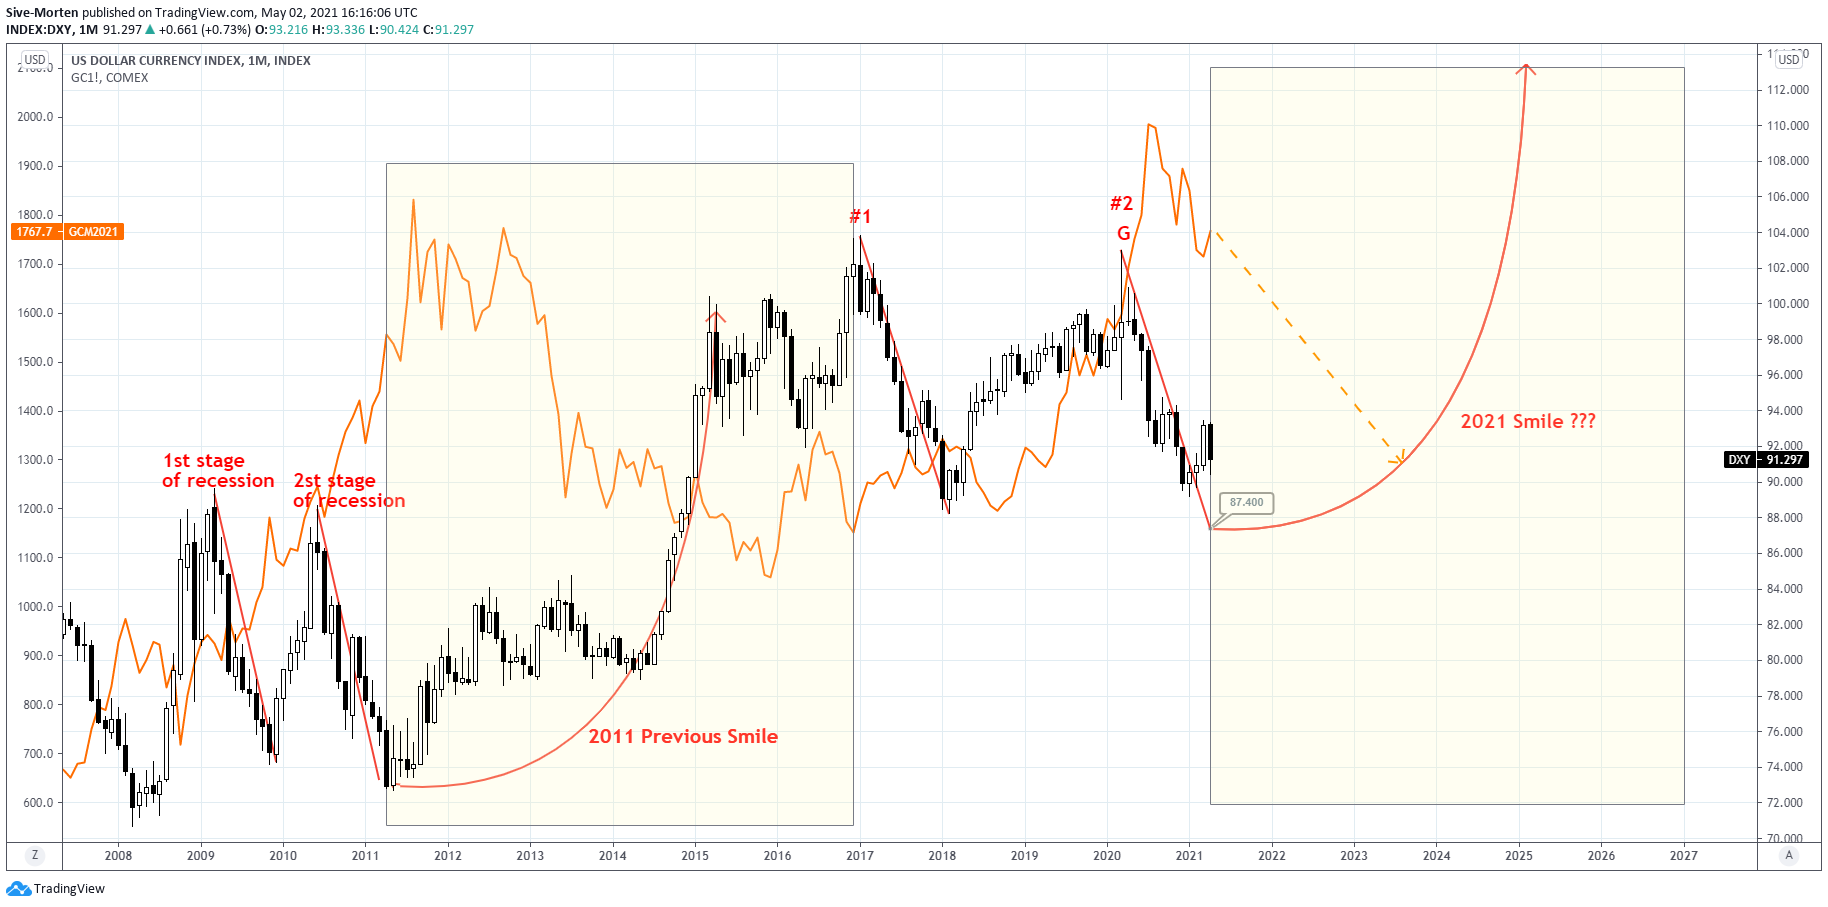
This environment just confirms our position that we've announced few months ago and no reasons to change it. As we said, gold could show some bounce and stands on the surface in short-term, within 2-3 months probably, on initial stage, when US dollar just turns to growth. But in a longer-term perspective, outside of 6 months we suggest that its doomed. As we've shown you the picture previously and could show it again - take a look what happens to the gold when US economy rising:
Technicals
Monthly
April shows nice performance but context on monthly chart remains bearish due multiple factors - MACD trend stands bearish, price is below YPP and downside action shows acceleration on CD leg. No doubts gold still has chances to move slightly higher, currently most popular target range among investors stand around 1810-1850$ area. But the inability of the gold to break YPP of 1810$ last week shows the weakness. YPP is long-term barometer, the border between bullish and bearish sentiment. This week gold has lost this game, but as it is coiling around, it could make the 2nd challenge.
Unfortunately gold is dependable asset right now and its performance tightly related to interest rates. Last week we've estimated that ability to reach 1850$ corresponds to 1.5% level breakout by 10-year interest rates.
Major 1650$ long-term target suggests that any upward action is temporal and sooner rather than later gold should drop to reach it.
Monthly time-frame doesn't provide definite signals and mostly situation depends on shorter-term charts.

Weekly
Weekly performance stands anemic as we've got inside week, that makes no impact on overall situation. Thus, we keep the same analysis that we've made previously.
Definitely gold has problems with K-area and YPP resistance.
MACD has turned bullish here and market is breaking out of tight flag consolidation. Now price stands nearest resistance level of 1784$. We have no overbought barriers by far. Here we could apply only classic way for target estimation based on broken flag - supposedly market could double its height and reach major 1828-1851$ resistance area. This should be major challenge for the gold, as it is also accompanied by overbought area.
But to keep this target reasonable gold has to stay outside of the broken flag. Otherwise bullish context will be cancelled.

Daily
Friday has become an inside session as well that also makes no impact on overall situation. Here is things stand simple - pain or gain. While market stands above 1750$ support, it keeps short-term bullish context valid and will challenge 1800-1810$ resistance area again and again. As we will get NFP data next week and other releases, some miss in expectations could provide unexpected support, but this scenario works only until gold is outside weekly flag.
Conversely, drop back, especially forming of reversal swing and breakout of 1723$ lows totally destroys bullish context. For those who intends to buy gold, it means that better to take positions only around strong support areas that give chance on technical bounce and moving stops to breakeven. It is preferable if patterns also will be formed around. For the truth's sake - daily picture provides little inspiration as it shows nothing fascinating.

Intraday
In general, the tactics of relying on strong levels works nice by far - price shows good reaction despite that sell-off was strong. For the short-term trading 1750$ support could be used for entry and stop placement behind it. Market is forming widening triangle . In a case of downside breakout - we have no choice but shift to 1723 support, which is last bullish outpost. But in this case, bullish context becomes very weak, getting a kind of deadly hit.

In fact, if you consider buying the gold - your task is to take position as close to major support as possible. It is good if we get some patterns. On Friday we've discussed "222" Buy pattern that has been formed, but potentially it could turn to butterfly that re-tests $1750 level. This is perfect combination for entry. As overall situation provides weak context, it is better to follow conservative tactics, using as much protection as possible.

Gold market this week was mostly in the same boat as the other ones, and investors were watching for the Fed statement and statistics that could re-shape the market in short-term and make impact on the sentiment. In general, gold market is very unstable in recent weeks and sentiment changes drastically very often. Usually this type of sentiment is more typical before downside trend as it is the 2nd side of the fear. When market prepares to rally it usually shows the gradual positive change in positions and investors' mood. Right now, based on COT reports we see that gold is overreacting of any fundamental events. Just recently we saw big jump in bullish position, but this week good data has put gold in depression and triggered massive positions covering. This "sensitivity" promises nothing good to investors. It looks like market is scared by something and nervous of every sudden noises.
Market overview
Gold gained on Monday, as surging COVID-19 cases boosted the metal's safe-haven appeal, aided by a weaker dollar ahead of the U.S. Federal Reserve's meeting this
week, while auto-catalyst palladium held below a record peak scaled last week.
"The COVID-19 situation in India and Japan is deteriorating. So that is boiling demand for safety, resulting in higher gold prices," said Margaret Yang, a strategist at DailyFX, adding that an easing dollar is further supporting prices. Сases in India registered a record surge, while Japan declared states of emergency for Tokyo, Osaka and two other prefectures on Friday to combat a spike. On the other hand, investors are looking at very strong U.S. economic data release," said Yang, adding higher yields are capping gold's gains.
U.S. factory activity powered ahead in early April, while retail sales jumped to a record high in March and hiring accelerated. New orders for key U.S.-made capital goods rose solidly in March and shipments surged, cementing expectations that economic growth accelerated in the first quarter as massive government aid and improving public health boosted demand.
U.S. consumer confidence jumped to a 14-month high in April as increased vaccinations against COVID-19 and additional fiscal stimulus allowed for more services businesses to reopen, boosting demand and hiring by companies. Analysts and traders have slashed their gold price forecasts, with many believing a return to last year's record highs is unlikely as economic recovery tarnishes the safe-haven metal's appeal, a Reuters poll showed on Tuesday.
Gold prices rose on Thursday bolstered by the U.S. Federal Reserve's pledge to maintain easy monetary policy to aid economic recovery, while a weaker dollar provided further support.
The Federal Reserve held interest rates and its bond-buying program steady on Wednesday after its two-day policy meet despite taking a rosier view of the U.S. economic recovery. Fed Chair Jerome Powell also said the coming price increases would almost surely be of a passing nature, and not present the sort of persistent problem that would force the central bank to begin raising interest rates sooner than expected.
U.S. President Joe Biden plans to unveil a sweeping $1.8 trillion package for families and education in his first speech to Congress. Gold tends to benefit from widespread stimulus measures from central banks because it is viewed as a hedge against inflation.
Meanwhile, the U.S. trade deficit in goods jumped to a record high in March, suggesting trade was a drag on economic growth in the first quarter, but that was likely offset by robust domestic demand amid massive government aid.
Gold prices dipped on Friday, set for their worst week in a month, as U.S. Treasury yields gained on strong economic data and dented the non-yielding metal's appeal
Despite the decline, bullion was poised for its first monthly gain of the year.
Data showed late Thursday that U.S. economic growth accelerated in the first quarter as fiscal stimulus fuelled consumer spending.
"This string of consecutively strong U.S. economic data is weighing on gold," said Stephen Innes, managing partner at SPI Asset Management, adding that people would rather book profits on month-end after a decent run-up in gold. Gold still remains bid, it is just not a strong hand right now, because of the month-end rebalancing."
Benchmark U.S. 10-year Treasury yields hovered near their highest in more than two weeks, increasing the opportunity cost of holding non-yielding bullion. Earlier this week, the Fed held interest rates and its bond-buying program steady.
"Ongoing strength in domestic data should lead to an incrementally hawkish turn in Fed guidance over the coming months," UBS analysts said in a note. Higher U.S. real rates will likely trigger further ETF outflows, UBS said, adding that they expect bullion to fall to $1,600 per ounce by year-end.
COT Report
As we've said in the beginning of the report, recent data on investors' positions is very wobbling. We see massive changes in opposite directions in a very tight time period. It means that investors do not have some extended consistency and reacts frightenedly on any whisper. This doesn't correspond to normal bullish sentiment. It means that overall situation stands fragile and any small push could trigger collapse, especially on mostly bearish background.
Thus, this week again - take a look that open interest has dropped for 20+K and speculators have increased bearish exposure for 10K contracts. Besides, a lot of spreading positions where closed.
At first glance, net position has not changed, but...
Take a look at open interest chart. It is definitely shows that interest to gold market is dropping since the beginning of the year. Investors are abandoning it. As it was mentioned above - maybe recent drop is a result of asset rebalancing again. This is definitely negative sign for the market.
So, today we try to not repeat the same things that we've discussed yesterday about major driving factors. We had in-depth discussion where we've made important conclusion on inflation situation, Fed strategy and US economy conditions. Some new details that relates to gold market makes the overall picture completed and it is perfectly expressed by UBS comments - drop to $1600 by the end of the year.
Indeed, now even most conservative sceptics do not have any doubts that US and global economy recovers. And does it with impressive pace. The recovery stands across the board, involving all spheres - employment, consumption, production, inflation, business sentiment etc., that reflexed in most common statistics, such as recent GDP release. Rebalancing of global financial portfolios also could be seen on the markets, where investors relocate assets and prepare for growth stage of the economy.
This environment just confirms our position that we've announced few months ago and no reasons to change it. As we said, gold could show some bounce and stands on the surface in short-term, within 2-3 months probably, on initial stage, when US dollar just turns to growth. But in a longer-term perspective, outside of 6 months we suggest that its doomed. As we've shown you the picture previously and could show it again - take a look what happens to the gold when US economy rising:
Technicals
Monthly
April shows nice performance but context on monthly chart remains bearish due multiple factors - MACD trend stands bearish, price is below YPP and downside action shows acceleration on CD leg. No doubts gold still has chances to move slightly higher, currently most popular target range among investors stand around 1810-1850$ area. But the inability of the gold to break YPP of 1810$ last week shows the weakness. YPP is long-term barometer, the border between bullish and bearish sentiment. This week gold has lost this game, but as it is coiling around, it could make the 2nd challenge.
Unfortunately gold is dependable asset right now and its performance tightly related to interest rates. Last week we've estimated that ability to reach 1850$ corresponds to 1.5% level breakout by 10-year interest rates.
Major 1650$ long-term target suggests that any upward action is temporal and sooner rather than later gold should drop to reach it.
Monthly time-frame doesn't provide definite signals and mostly situation depends on shorter-term charts.
Weekly
Weekly performance stands anemic as we've got inside week, that makes no impact on overall situation. Thus, we keep the same analysis that we've made previously.
Definitely gold has problems with K-area and YPP resistance.
MACD has turned bullish here and market is breaking out of tight flag consolidation. Now price stands nearest resistance level of 1784$. We have no overbought barriers by far. Here we could apply only classic way for target estimation based on broken flag - supposedly market could double its height and reach major 1828-1851$ resistance area. This should be major challenge for the gold, as it is also accompanied by overbought area.
But to keep this target reasonable gold has to stay outside of the broken flag. Otherwise bullish context will be cancelled.
Daily
Friday has become an inside session as well that also makes no impact on overall situation. Here is things stand simple - pain or gain. While market stands above 1750$ support, it keeps short-term bullish context valid and will challenge 1800-1810$ resistance area again and again. As we will get NFP data next week and other releases, some miss in expectations could provide unexpected support, but this scenario works only until gold is outside weekly flag.
Conversely, drop back, especially forming of reversal swing and breakout of 1723$ lows totally destroys bullish context. For those who intends to buy gold, it means that better to take positions only around strong support areas that give chance on technical bounce and moving stops to breakeven. It is preferable if patterns also will be formed around. For the truth's sake - daily picture provides little inspiration as it shows nothing fascinating.
Intraday
In general, the tactics of relying on strong levels works nice by far - price shows good reaction despite that sell-off was strong. For the short-term trading 1750$ support could be used for entry and stop placement behind it. Market is forming widening triangle . In a case of downside breakout - we have no choice but shift to 1723 support, which is last bullish outpost. But in this case, bullish context becomes very weak, getting a kind of deadly hit.
In fact, if you consider buying the gold - your task is to take position as close to major support as possible. It is good if we get some patterns. On Friday we've discussed "222" Buy pattern that has been formed, but potentially it could turn to butterfly that re-tests $1750 level. This is perfect combination for entry. As overall situation provides weak context, it is better to follow conservative tactics, using as much protection as possible.