Sive Morten
Special Consultant to the FPA
- Messages
- 18,648
Fundamentals
Despite that economy statistics, such as CPI/PPI also makes impact on gold. Say, next week we will keep an eye on Retail Sales data, which is among the statistics whales clearly shows the ongoing situation in the US economy. Besides, Retail Sales is great for GDP forecast as it takes ~ 70% of it, also it has tight relation with real sector and production. So, in some way, it is a cornerstone indicator, showing the health of economy. Still, whatever important economy news we get, gold still is more sensible to political issues, as on external arena, as inside the US, such as a debt ceil, which is gradually becoming the political question either.
Market overview
As we've mentioned yesterday and last week, now it comes to wide coverage in large media - U.S. banks tightened credit standards over the first months of the year and saw weakness in loan demand from businesses and consumers, the Fed's senior loan officer opinion survey showed. Chicago Fed chief Austan Goolsbee said in an interview with Yahoo Finance that he was getting "vibes" a credit squeeze is beginning.
Daniel Ghali, commodity strategist at TD Securities, said the prospect of recession was likely to make markets price in future Fed rate cuts, which should lead "discretionary traders to deploy their capital in gold". Non-yielding gold has greater appeal to investors when interest rates fall and reduce competition from other assets. Markets saw an 85% chance of the Fed holding rates at their current level in June, and a 31% chance of a rate cut in July, according to CME's FedWatch tool.
Fed Governor Philip Jefferson said the U.S. economy is slowing in an "orderly fashion" allowing inflation to decline even as growth continues. New York Fed chief John Williams said inflation remains too high, but tighter credit should slow the economy, blunting how far the Fed might need to go. Equities markets fell on concerns about China's domestic demand recovery after weak Chinese trade data, and the impasse over the U.S. debt ceiling. Commerzbank analyst Carsten Fritsch, however, wrote in a note that there is no scope for the Fed to implement rate cuts this year.
Gold prices edged lower on Wednesday as optimism over the Federal Reserve cutting interest rates this year faded after U.S. inflation report, triggering profit-taking among some investors. Gold rose as much as 0.7% after data showed U.S. Consumer Price Index (CPI) rose 4.9% in April from a year earlier but lower than expectations of a 5% increase, before turning negative. Month-over-month CPI in April rose 0.4% after gaining 0.1% in March.
The data disrupted the modest momentum that had been building for an 11th straight interest rate hike in June, with the bulk of futures tied to the Fed's rate betting on a pause. Some analysts have said gold could attempt another run to record highs, given persistent economic worries, including a potential U.S. debt ceiling default.
Gold prices fell to a one-week low on Friday, and are on track for a weekly dip, weighed down by a stronger dollar and an uptick in U.S. bond yields. Higher 10-year Treasury yields further dimmed zero-interest bullion's appeal.
Treasury Secretary Janet Yellen said there was still uncertainty about exactly when Treasury would run out of cash to pay U.S. government debts, which could come as early as June 1. Fed Governor Michelle Bowman, however, reiterated the central bank's stance on raising rates if necessary to fight still-high inflation.
Fawad Razaqzada, market analyst at City Index, attributed the drop to the dollar rebound and concerns over China's economic recovery.
So, we do not see any visible changes in market sentiment. Everybody talk about rate cut, Fed pivot and speculate on possible debt ceil or US default. Let's then pay a bit more attention to few specific moments. Briefly, we've discussed them in our FX report yesterday - CPI, raising of initial claims and so on, but here are still few moments to mention.
Inflation and employment data scrutiny
Few times this year we were totally discourage with NFP reports, showing too big numbers to believe them. Although by the comments in media it was seemed that everybody just took them without any questions. It is not only about NFP, but also on JOLTS and claims. Few times we have shown the background that argued the reality of NFP numbers, with drop of average working hours and continues claims. Now WSJ confirms our suspicions.
Many people tell and honestly believe that in the USA the statistics are drawn and the thought arises "well, it can't be, it's the USA, firstly, everything is objective, and secondly, someone would surely notice some contradictions." But, in fact, the problem with distorted statistics often lies not in the juggling of data, but in the method of determining them.
WSJ writes:
According to the study 68% of the surveyed managers have vacancies posted more than 30 days ago and 28% more than 3 months. And every 5th manager does not plan to fill a vacancy until 2023 (at that time it was +4.5 months). That is, extrapolating, 2-3 million vacancies reported by the Ministry of Labor are fake. This data, by the way, is collected by polling companies about the number of open vacancies, so they are distorted by fake vacancies by default.
Do you know how unemployment data is collected? Here it should be clarified that there are two types of research - a survey of companies and a survey of households, but everyone and everywhere refers to data (the same 3.4% according to the latest data) compiled from a survey of companies, and they are meant. Companies simply ask how many people they have employed and compare with the working population. At the same time, these data are distorted by people employed in several companies, and their number has increased over the past 2 years.

But to complete the picture of the distortion of labor statistics, it is necessary to consider the data on layoffs and wage statistics, which we do maybe in some next reports, but you get the core. The same story you'll see in layoffs and wage. In fact, here is the chart of so called "seasonal adjustments" for initial claims - just feel the difference:

Now, concerning CPI numbers. We think that numbers are significantly undervalued. This is not some intended fake, but legal "adjustments" to calculation method that significantly diminishes inflation value. In headlines this sounds awesome - “Consumer Prices in April Rise at the Slowest Annual Rate in Two Years.” But if you read about one inch below the headline, you’ll discover things aren’t so great. In fact, the actual data reveals price inflation is looking pretty sticky.
According to data released by the Bureau of Labor Statistics, April CPI rose by 4.9% on an annual basis. That was a tick lower than the 5% annual CPI increase reported in March and also lower than the projection for another 5% annual gain. Looking at the monthly numbers, CPI was up by 0.4% over last month, representing a significant increase in prices. That compares to a 0.1% month-on-month increase in March, signaling that price inflation isn’t cooling at all.
In fact, looking at the CPI prints through the first four months of this year, the average is 0.35% which annualized to 4.2% on the year. This is more than double the Fed’s 2% target. The core CPI numbers cast even more doubt on the notion that the Fed is winning the inflation fight. Stripping out more volatile food and energy prices, core CPI was up 0.4%. Over the last 12 months, core CPI was up 5.5%, just a tick lower than in March.
More concerning is the fact that core CPI has held steady in recent months, rising by 0.4% in January, 0.5% in February, 0.4% in March, and by 0.4% again in April.
Keep in mind, inflation is worse than the government data suggest. This CPI uses a formula that understates the actual rise in prices. Based on the formula used in the 1970s, CPI is closer to double the official numbers. Using previous way of calculation, CPI should be two digits somewhere around 10-12%. The same we could say about GDP drop in real numbers. It should be not positive but ~ "-7-9%" annually.
In the past, gold has rallied on “positive” inflation news, but after the April CPI data came out, gold dipped. Schiff said it sold off because investors realized that the “good” news is actually bad.
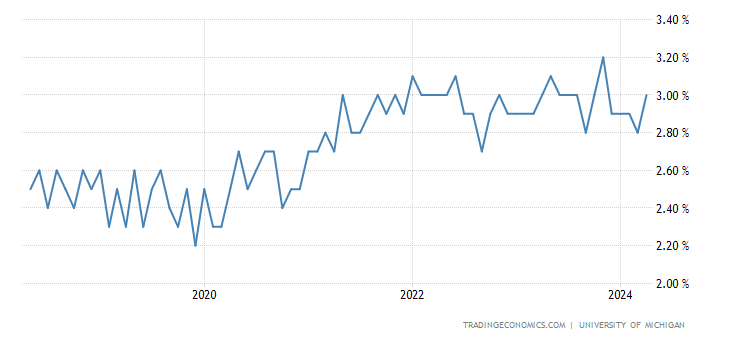
Partially we get confirmation of this suggestion by rising of inflationary expectations, despite high Fed rate, and futures forecast of rate cut this year. Here is US Michigan 5-year inflationary expectations.
The Federal Reserve will likely need to raise interest rates further and hold them higher for some time if US price pressures don’t cool off and the jobs market shows no sign of slowing, Governor Michelle Bowman said.
That's being said, I wouldn't hurry up with conclusion that we will not see the rate change in June and July, if even Fed members talk about it. Besides, even with futures market's expectations is not everything as smooth as it is shown in Fed Watch Tool. Several positions in options linked to the overnight interest rate appeared last week, which indicate additional tightening that will be appropriate in the next few Fed policy meetings scheduled for June and July. Besides, in J. Powell's prank video, he clearly said "two more rate changes". It was prior May meeting, so It means June at least.
Regardless of what the mainstream headlines tell you, price inflation remains persistently sticky, and there really is no justification for a tightening pause. The moment it is forced to reckon with the damage done by decades of easy money, it will return to easy money like a pig to mud — no matter what the central bankers are telling you today.
TWO MORE CENTS ON DEBT CEIL
Now it is a hot topic - how much you have to raise the debt ceiling in order to solve your problems. Interestingly, after the proposal of the Republicans to raise the ceiling by 1.5 trillion. dollars, it was announced in the media that this would be enough for almost a year or a year and a half. But in fact, we have seen that this is enough for 4 months (until the end of the 3rd quarter).
So if the Republican proposal is accepted, the problem will be pushed back to September, maybe a little further. But we must understand that the law adopted by Congress was not only about the ceiling, but also about changes in the structure of the budget, so the Democrats are unlikely to agree. And here we come to the question of how much money will be needed and why it will be a mega-QE.
Even without taking into account the potential default, we have seen that the problems in the event of a recession and the acute phase of the crisis are too many. This is commercial real estate, and generalized problems of the banking sector, and problems of small business, and growth unemployment in general, and the disproportionate consequences of the covid crisis, when the low-income part of the population ate up savings and works at 2 jobs, the wealthier did not lose their jobs, and state subsidies were put on the stock market. Let's not forget about the flow of migrants, which is growing and who, in the absence of work for them, must somehow be fed.
The sharp rise in unemployment at the time of the crisis (and a very strong crisis, stronger than 2008), might become the main argument for the existence of helicopter money. Because of the crisis of regional banks, small and medium-sized businesses will crumble and the number of unemployed in this sector will be very large.
Why are we talking about mega-QE? Because in the aggregate it will be a very large infusion. Even without a default on treasuries, the commercial real estate market is of 20 trillion dollars will require trillions of dollars of state support. More precisely, not the market, but those who hold commercial mortgage-backed securities will demand subsidies from "bank rescuers" - this is hundreds of billions, if not a trillion, a couple of trillions of helicopter money for the unemployed population, this is already a cherry on the cake.
Even without a default, at a time when everything will fall down, there will simply be no one to buy these assets, except for the Fed. Considering that the withdrawal from money market funds will be blocked. And so the demand for treasure is not very good, as we've considered this yesterday. As a result, only 5-7 trillion will have to be borrowed for support, not to mention the existing deficit of $2 Trln.
So direct emission injections (that is, new printed money) not just into the financial sector, but precisely into the final demand will amount to around $4 trillion and the fight against inflation can be forgotten.
GOLD PRICE
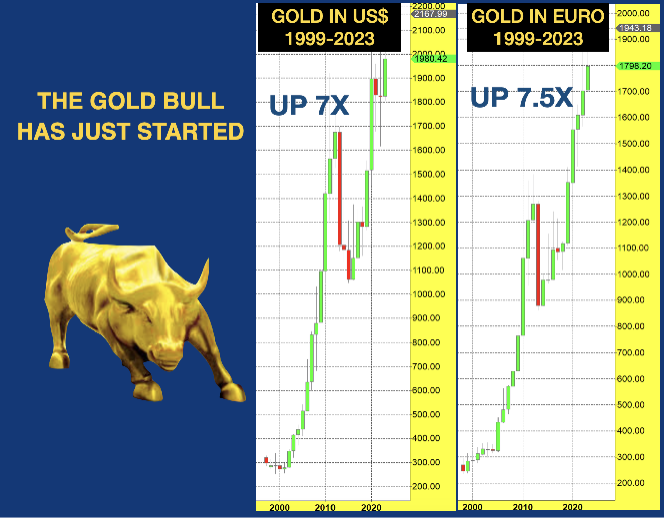
All these heavy thoughts make investors to expect solid gold appreciation in long term perspective, but situation is too difficult to talk about precise numbers. Mostly we should think in ratios. People could have put their money into gold at the beginning of this century and today would have seen their investment multiply 7 times or more depending on their base currency.
But that would have been too simple since it takes away the whole mystique of the asset management industry with their trillions of dollars of investments. Ok, gold was up substantially in the last couple of decades. What about going forward? Should investors put their money with the experts who will then buy stocks, bonds and property investments which have had more than a century of printed money pushing values to bubble territory?
Well, the unequivocal reply to that is obviously YES. Since governments and central banks are the biggest supporters of gold by continuously destroying the value of paper money, gold ownership is must. The Everything Bubble is likely to turn into the “Everything Collapse” with all the bubble assets declining between 75% and 95% in real terms. After all; assets inflated by fake money must clearly be fake.
The biggest collapse will obviously be the $300 trillion debt market. But before this debt collapse, Western governments and central banks will have drowned financial markets in mouse-click money. Since Western Governments and Central Banks know that the system is on the verge of collapse, they are doing all they can to control the people. Covid vaccines, lockups, global warming were just the beginning. Next is CBDCs (Central Bank Digital Currencies). This will be the most perfect way for governments to control their people by having full control of their money. So especially the West is at a risk of coming under totalitarian control.
There are obviously very few who have the possibility to escape what is coming but anyone who can, should really investigate all alternative options. But what most people with savings can do is to own physical gold and some silver and store it in a safe jurisdiction outside the financial system. Then at least if your government becomes too oppressive, you can flee to your gold. You could even store it at home, in the safe.
Gold is Eternal Wealth. Therefore, if you hold gold as wealth protection, you don’t have to worry what happens to the value of your paper money. Gold will always reflect the debasement of paper money. Therefore to give a forecast of the gold price is totally meaningless and a mug’s game. It is not the future price of gold that we should forecast. Instead, what is important is what will happen to your money. What will happen to the Dollar, the Euro, the Pound or the Yen. Will it go down by 50% or maybe 100%.
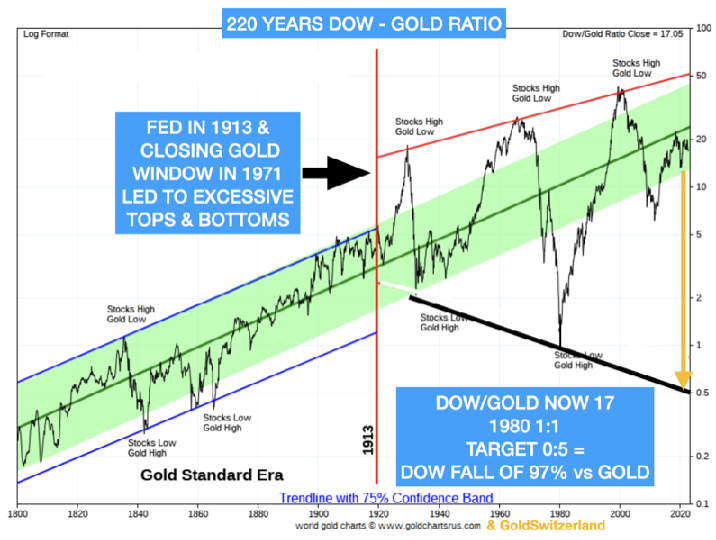
And for anyone who believes that the stock market will protect him from the coming collapse of the financial system, we have bad news. The Dow – Gold ratio, currently at 17, is likely to reach at least the 1980 level of 1:1. That would mean a 94% fall of stocks against gold from here. But is nothing impossible it could easily reach the trend line of 0.5:1 which means that the Dow would fall 97% against gold.
BRICS countries began trading with each other using alternative currencies because the Fed’s interest-rate hikes made the US dollar too expensive. Foreign treasuries and foreign nations have been dumping U.S. treasuries throughout 2022… $14 trillion in foreign debt has to be paid in U.S. dollars. The fiat game is not sustainable. This debt game is not sustainable. You can’t keep solving the debt problem with more debt. FedNow and other central bank digital currencies only serve to expand the government’s control. Protect your wealth through direct ownership of physical gold.
Thus, in fact, the gold price is an objective value and fiat currencies are subjective one. So, gold price is a relative value, In fact the gold is a "par", "ultimate" of value. So, it price depends on the fantasy of central bankers and how strong they hurt domestic economy. But even right now, using technical tools we could estimate nearest upside target around 2650-2700$ area.
Conclusion:
So, today, guys we just add some details to our FX report. Now the line between FX and Gold reports almost doesn't exist as they are becoming a single report, mostly because markets are driven by fundamental and political news, that make similar impact with minor nuances on all markets. It is clearly shown that US financial authorities are trapped in liquidity pit. They have no money to finance current government activity, support distressed banks. The amount of funds that US Treasury needs is so big, that they could meet problems, trying to sell new bonds issues, even if debt ceil will be raised. It is almost unavoidably should lead to some way of QE in perspective of 2-3 months, no matter what happens with the debt ceil. The degree of chaos and entropy is rising. And we do not exclude sharp political changes, say J. Biden impeachment or his family probe on "old" affairs. At the same time, it is not the fact that Fed starts cutting the rate. Despite that it could bring huge volatility on the market, in general all these events are positive for the gold.
Despite that economy statistics, such as CPI/PPI also makes impact on gold. Say, next week we will keep an eye on Retail Sales data, which is among the statistics whales clearly shows the ongoing situation in the US economy. Besides, Retail Sales is great for GDP forecast as it takes ~ 70% of it, also it has tight relation with real sector and production. So, in some way, it is a cornerstone indicator, showing the health of economy. Still, whatever important economy news we get, gold still is more sensible to political issues, as on external arena, as inside the US, such as a debt ceil, which is gradually becoming the political question either.
Market overview
As we've mentioned yesterday and last week, now it comes to wide coverage in large media - U.S. banks tightened credit standards over the first months of the year and saw weakness in loan demand from businesses and consumers, the Fed's senior loan officer opinion survey showed. Chicago Fed chief Austan Goolsbee said in an interview with Yahoo Finance that he was getting "vibes" a credit squeeze is beginning.
"If the woes among regional banks are thrust back into the spotlight, that could trigger another leg up for this safe-haven asset," said Han Tan, chief market analyst at Exinity.
Daniel Ghali, commodity strategist at TD Securities, said the prospect of recession was likely to make markets price in future Fed rate cuts, which should lead "discretionary traders to deploy their capital in gold". Non-yielding gold has greater appeal to investors when interest rates fall and reduce competition from other assets. Markets saw an 85% chance of the Fed holding rates at their current level in June, and a 31% chance of a rate cut in July, according to CME's FedWatch tool.
Fed Governor Philip Jefferson said the U.S. economy is slowing in an "orderly fashion" allowing inflation to decline even as growth continues. New York Fed chief John Williams said inflation remains too high, but tighter credit should slow the economy, blunting how far the Fed might need to go. Equities markets fell on concerns about China's domestic demand recovery after weak Chinese trade data, and the impasse over the U.S. debt ceiling. Commerzbank analyst Carsten Fritsch, however, wrote in a note that there is no scope for the Fed to implement rate cuts this year.
Gold prices edged lower on Wednesday as optimism over the Federal Reserve cutting interest rates this year faded after U.S. inflation report, triggering profit-taking among some investors. Gold rose as much as 0.7% after data showed U.S. Consumer Price Index (CPI) rose 4.9% in April from a year earlier but lower than expectations of a 5% increase, before turning negative. Month-over-month CPI in April rose 0.4% after gaining 0.1% in March.
"There's still risks the Fed will have to keep rates higher for longer... Gold is going to need more rate cuts to become aggressively priced in for it to continue its rally," said Edward Moya, senior market analyst at OANDA.
The data disrupted the modest momentum that had been building for an 11th straight interest rate hike in June, with the bulk of futures tied to the Fed's rate betting on a pause. Some analysts have said gold could attempt another run to record highs, given persistent economic worries, including a potential U.S. debt ceiling default.
But gold may struggle in the short term with core inflation unchanged from last month and well above the Fed's target, said Ole Hansen, head of commodity strategy at Saxo Bank.
Gold prices fell to a one-week low on Friday, and are on track for a weekly dip, weighed down by a stronger dollar and an uptick in U.S. bond yields. Higher 10-year Treasury yields further dimmed zero-interest bullion's appeal.
However, "the upside is limited for dollar strengthening due to the debt ceiling issues that we will be going through for the next couple of weeks, where gold will benefit if that lingers on," said Bob Haberkorn, senior market strategist at RJO Futures.
Treasury Secretary Janet Yellen said there was still uncertainty about exactly when Treasury would run out of cash to pay U.S. government debts, which could come as early as June 1. Fed Governor Michelle Bowman, however, reiterated the central bank's stance on raising rates if necessary to fight still-high inflation.
The bullish sentiment in the gold market still stands strong over expectations of the Fed cutting rates later this year, said Lukman Otunuga, a senior research analyst at FXTM, adding that traders have practically priced in a 25-basis-point cut by September.
Fawad Razaqzada, market analyst at City Index, attributed the drop to the dollar rebound and concerns over China's economic recovery.
So, we do not see any visible changes in market sentiment. Everybody talk about rate cut, Fed pivot and speculate on possible debt ceil or US default. Let's then pay a bit more attention to few specific moments. Briefly, we've discussed them in our FX report yesterday - CPI, raising of initial claims and so on, but here are still few moments to mention.
Inflation and employment data scrutiny
Few times this year we were totally discourage with NFP reports, showing too big numbers to believe them. Although by the comments in media it was seemed that everybody just took them without any questions. It is not only about NFP, but also on JOLTS and claims. Few times we have shown the background that argued the reality of NFP numbers, with drop of average working hours and continues claims. Now WSJ confirms our suspicions.
Many people tell and honestly believe that in the USA the statistics are drawn and the thought arises "well, it can't be, it's the USA, firstly, everything is objective, and secondly, someone would surely notice some contradictions." But, in fact, the problem with distorted statistics often lies not in the juggling of data, but in the method of determining them.
WSJ writes:
“... not all job postings are linked to real jobs. According to the Department of Labor… 10.8 million jobs were posted in January. … Although companies continue to post job ads, many vacancies are not filled, recruiters say. ... in a survey of over 1,000 hiring managers, 27% reported that job ads have been posted for more than four months. ... among those who reported they weren't actively trying to fill positions, nearly half said they kept the ads up to date to give the impression that the company was growing . A third of managers ... to calm overworked employees . Other reasons ... creating a pool of ready candidates in case an employee leaves or in case an "irresistible" candidate applies."
According to the study 68% of the surveyed managers have vacancies posted more than 30 days ago and 28% more than 3 months. And every 5th manager does not plan to fill a vacancy until 2023 (at that time it was +4.5 months). That is, extrapolating, 2-3 million vacancies reported by the Ministry of Labor are fake. This data, by the way, is collected by polling companies about the number of open vacancies, so they are distorted by fake vacancies by default.
Do you know how unemployment data is collected? Here it should be clarified that there are two types of research - a survey of companies and a survey of households, but everyone and everywhere refers to data (the same 3.4% according to the latest data) compiled from a survey of companies, and they are meant. Companies simply ask how many people they have employed and compare with the working population. At the same time, these data are distorted by people employed in several companies, and their number has increased over the past 2 years.
But to complete the picture of the distortion of labor statistics, it is necessary to consider the data on layoffs and wage statistics, which we do maybe in some next reports, but you get the core. The same story you'll see in layoffs and wage. In fact, here is the chart of so called "seasonal adjustments" for initial claims - just feel the difference:
Now, concerning CPI numbers. We think that numbers are significantly undervalued. This is not some intended fake, but legal "adjustments" to calculation method that significantly diminishes inflation value. In headlines this sounds awesome - “Consumer Prices in April Rise at the Slowest Annual Rate in Two Years.” But if you read about one inch below the headline, you’ll discover things aren’t so great. In fact, the actual data reveals price inflation is looking pretty sticky.
According to data released by the Bureau of Labor Statistics, April CPI rose by 4.9% on an annual basis. That was a tick lower than the 5% annual CPI increase reported in March and also lower than the projection for another 5% annual gain. Looking at the monthly numbers, CPI was up by 0.4% over last month, representing a significant increase in prices. That compares to a 0.1% month-on-month increase in March, signaling that price inflation isn’t cooling at all.
In fact, looking at the CPI prints through the first four months of this year, the average is 0.35% which annualized to 4.2% on the year. This is more than double the Fed’s 2% target. The core CPI numbers cast even more doubt on the notion that the Fed is winning the inflation fight. Stripping out more volatile food and energy prices, core CPI was up 0.4%. Over the last 12 months, core CPI was up 5.5%, just a tick lower than in March.
More concerning is the fact that core CPI has held steady in recent months, rising by 0.4% in January, 0.5% in February, 0.4% in March, and by 0.4% again in April.
Keep in mind, inflation is worse than the government data suggest. This CPI uses a formula that understates the actual rise in prices. Based on the formula used in the 1970s, CPI is closer to double the official numbers. Using previous way of calculation, CPI should be two digits somewhere around 10-12%. The same we could say about GDP drop in real numbers. It should be not positive but ~ "-7-9%" annually.
In the past, gold has rallied on “positive” inflation news, but after the April CPI data came out, gold dipped. Schiff said it sold off because investors realized that the “good” news is actually bad.
Far more ‘improvement’ would be needed to get the Fed to officially pivot. But persistent inflation is actually very bullish for gold. When investors finally figure that out gold will soar.”
Partially we get confirmation of this suggestion by rising of inflationary expectations, despite high Fed rate, and futures forecast of rate cut this year. Here is US Michigan 5-year inflationary expectations.
The Federal Reserve will likely need to raise interest rates further and hold them higher for some time if US price pressures don’t cool off and the jobs market shows no sign of slowing, Governor Michelle Bowman said.
“Should inflation remain high and the labor market remain tight, additional monetary policy tightening will likely be appropriate to attain a sufficiently restrictive stance of monetary policy,” Bowman said in remarks for delivery on Friday. “I also expect that our policy rate will need to remain sufficiently restrictive for some time to bring inflation down and create conditions that will support a sustainably strong labor market.”
That's being said, I wouldn't hurry up with conclusion that we will not see the rate change in June and July, if even Fed members talk about it. Besides, even with futures market's expectations is not everything as smooth as it is shown in Fed Watch Tool. Several positions in options linked to the overnight interest rate appeared last week, which indicate additional tightening that will be appropriate in the next few Fed policy meetings scheduled for June and July. Besides, in J. Powell's prank video, he clearly said "two more rate changes". It was prior May meeting, so It means June at least.
Regardless of what the mainstream headlines tell you, price inflation remains persistently sticky, and there really is no justification for a tightening pause. The moment it is forced to reckon with the damage done by decades of easy money, it will return to easy money like a pig to mud — no matter what the central bankers are telling you today.
TWO MORE CENTS ON DEBT CEIL
Now it is a hot topic - how much you have to raise the debt ceiling in order to solve your problems. Interestingly, after the proposal of the Republicans to raise the ceiling by 1.5 trillion. dollars, it was announced in the media that this would be enough for almost a year or a year and a half. But in fact, we have seen that this is enough for 4 months (until the end of the 3rd quarter).
So if the Republican proposal is accepted, the problem will be pushed back to September, maybe a little further. But we must understand that the law adopted by Congress was not only about the ceiling, but also about changes in the structure of the budget, so the Democrats are unlikely to agree. And here we come to the question of how much money will be needed and why it will be a mega-QE.
Even without taking into account the potential default, we have seen that the problems in the event of a recession and the acute phase of the crisis are too many. This is commercial real estate, and generalized problems of the banking sector, and problems of small business, and growth unemployment in general, and the disproportionate consequences of the covid crisis, when the low-income part of the population ate up savings and works at 2 jobs, the wealthier did not lose their jobs, and state subsidies were put on the stock market. Let's not forget about the flow of migrants, which is growing and who, in the absence of work for them, must somehow be fed.
The sharp rise in unemployment at the time of the crisis (and a very strong crisis, stronger than 2008), might become the main argument for the existence of helicopter money. Because of the crisis of regional banks, small and medium-sized businesses will crumble and the number of unemployed in this sector will be very large.
Why are we talking about mega-QE? Because in the aggregate it will be a very large infusion. Even without a default on treasuries, the commercial real estate market is of 20 trillion dollars will require trillions of dollars of state support. More precisely, not the market, but those who hold commercial mortgage-backed securities will demand subsidies from "bank rescuers" - this is hundreds of billions, if not a trillion, a couple of trillions of helicopter money for the unemployed population, this is already a cherry on the cake.
Even without a default, at a time when everything will fall down, there will simply be no one to buy these assets, except for the Fed. Considering that the withdrawal from money market funds will be blocked. And so the demand for treasure is not very good, as we've considered this yesterday. As a result, only 5-7 trillion will have to be borrowed for support, not to mention the existing deficit of $2 Trln.
So direct emission injections (that is, new printed money) not just into the financial sector, but precisely into the final demand will amount to around $4 trillion and the fight against inflation can be forgotten.
GOLD PRICE
All these heavy thoughts make investors to expect solid gold appreciation in long term perspective, but situation is too difficult to talk about precise numbers. Mostly we should think in ratios. People could have put their money into gold at the beginning of this century and today would have seen their investment multiply 7 times or more depending on their base currency.
But that would have been too simple since it takes away the whole mystique of the asset management industry with their trillions of dollars of investments. Ok, gold was up substantially in the last couple of decades. What about going forward? Should investors put their money with the experts who will then buy stocks, bonds and property investments which have had more than a century of printed money pushing values to bubble territory?
Well, the unequivocal reply to that is obviously YES. Since governments and central banks are the biggest supporters of gold by continuously destroying the value of paper money, gold ownership is must. The Everything Bubble is likely to turn into the “Everything Collapse” with all the bubble assets declining between 75% and 95% in real terms. After all; assets inflated by fake money must clearly be fake.
The biggest collapse will obviously be the $300 trillion debt market. But before this debt collapse, Western governments and central banks will have drowned financial markets in mouse-click money. Since Western Governments and Central Banks know that the system is on the verge of collapse, they are doing all they can to control the people. Covid vaccines, lockups, global warming were just the beginning. Next is CBDCs (Central Bank Digital Currencies). This will be the most perfect way for governments to control their people by having full control of their money. So especially the West is at a risk of coming under totalitarian control.
There are obviously very few who have the possibility to escape what is coming but anyone who can, should really investigate all alternative options. But what most people with savings can do is to own physical gold and some silver and store it in a safe jurisdiction outside the financial system. Then at least if your government becomes too oppressive, you can flee to your gold. You could even store it at home, in the safe.
Gold is Eternal Wealth. Therefore, if you hold gold as wealth protection, you don’t have to worry what happens to the value of your paper money. Gold will always reflect the debasement of paper money. Therefore to give a forecast of the gold price is totally meaningless and a mug’s game. It is not the future price of gold that we should forecast. Instead, what is important is what will happen to your money. What will happen to the Dollar, the Euro, the Pound or the Yen. Will it go down by 50% or maybe 100%.
And for anyone who believes that the stock market will protect him from the coming collapse of the financial system, we have bad news. The Dow – Gold ratio, currently at 17, is likely to reach at least the 1980 level of 1:1. That would mean a 94% fall of stocks against gold from here. But is nothing impossible it could easily reach the trend line of 0.5:1 which means that the Dow would fall 97% against gold.
BRICS countries began trading with each other using alternative currencies because the Fed’s interest-rate hikes made the US dollar too expensive. Foreign treasuries and foreign nations have been dumping U.S. treasuries throughout 2022… $14 trillion in foreign debt has to be paid in U.S. dollars. The fiat game is not sustainable. This debt game is not sustainable. You can’t keep solving the debt problem with more debt. FedNow and other central bank digital currencies only serve to expand the government’s control. Protect your wealth through direct ownership of physical gold.
Thus, in fact, the gold price is an objective value and fiat currencies are subjective one. So, gold price is a relative value, In fact the gold is a "par", "ultimate" of value. So, it price depends on the fantasy of central bankers and how strong they hurt domestic economy. But even right now, using technical tools we could estimate nearest upside target around 2650-2700$ area.
Conclusion:
So, today, guys we just add some details to our FX report. Now the line between FX and Gold reports almost doesn't exist as they are becoming a single report, mostly because markets are driven by fundamental and political news, that make similar impact with minor nuances on all markets. It is clearly shown that US financial authorities are trapped in liquidity pit. They have no money to finance current government activity, support distressed banks. The amount of funds that US Treasury needs is so big, that they could meet problems, trying to sell new bonds issues, even if debt ceil will be raised. It is almost unavoidably should lead to some way of QE in perspective of 2-3 months, no matter what happens with the debt ceil. The degree of chaos and entropy is rising. And we do not exclude sharp political changes, say J. Biden impeachment or his family probe on "old" affairs. At the same time, it is not the fact that Fed starts cutting the rate. Despite that it could bring huge volatility on the market, in general all these events are positive for the gold.
 . I am depressed of what the world has become.