Sive Morten
Special Consultant to the FPA
- Messages
- 18,648
Fundamentals
As other markets this week, gold feels the whole power of inflation driving factor that pushed the gold prices to 5-month top. One would think - what is the reason for recent rally? Inflation jumps which brings potential hazard of interest rate change. Besides, as we already know - gold has weak inflation protection in short-term and ignores fluctuations of cyclical rate changes around major long-term global money devaluation trend, which is very slow. We suggest that the answer is twofold. First is - real interest rates. They have collapsed on inflation's jump. Second - Fed policy, as they tie hands and can't change rate right now, waiting for stabilization of employment. This lets gold to use this discrepancy
Market overview
Gold hit a five-month high on Wednesday, leading a rally in precious metals, as data showed U.S. consumer prices surged last month, burnishing bullion’s appeal as an inflation hedge. U.S. consumer prices accelerated in October as Americans paid more for gasoline and food, leading to the biggest annual gain in 31 years.
The rally looked past strength in the U.S. dollar, which usually dulls gold demand from other currency holders, for much of the session, but finally buckled to give up a chunk of the gains as the greenback hit its highest in over a year. Safe-haven gold, on course for a fifth straight day of gains, also drew support from a slide in real yields on U.S. Treasuries and the overall risk-off sentiment that pushed down Wall Street’s main indexes.
Gold prices edged higher on Thursday, extending a rally fuelled by a surge in U.S. consumer prices that spurred some demand for the metal as an inflation hedge.
The bank raised its 0-3 month gold price target to $1,900 and expects the metal to average $1,800 in the fourth quarter.
Gold also gained despite the dollar hitting its highest in a year and benchmark 10-year U.S. Treasury yields rising.
DailyFX currency strategist Ilya Spivak said prices could head lower as markets digest the CPI data, especially amid concerns that the U.S. Federal Reserve could tighten its policy more aggressively. Interest rate hikes to cool inflation should weigh on gold as they would raise the non-yielding metal’s opportunity cost.
Several Fed officials this week expressed growing concerns over more long-lasting inflation, even as they expect price increases to eventually subside.
Gold slipped on Friday as some investors locked in profits from a six-session long streak of gains, and an uptick in U.S. bond yields cooled safe-haven inflows into bullion driven by inflation worries. Gold has gained as much as $110 since Nov. 3, bolstered by deepening fears of inflation and reassurances from key central banks that interest rates would remain low for the time being.
Raising gold’s opportunity cost, U.S. benchmark 10-year Treasury yields held above the 1.5% mark, while the dollar index rose to its highest since July 2020.
While a stronger dollar typically makes gold more expensive for overseas buyers, bullion investors seemed to largely ignore the rally in the U.S. currency over the past couple of days as a big jump in U.S. consumer prices in October took centre-stage. But the initial rally kept inflation-hedge gold on track for a weekly gain.
The sharp rise in inflation has also fanned fears that the Federal Reserve could hike interest rates sooner than expected.
U.S. Treasury Secretary Janet Yellen said on Friday that labor force participation was "quite depressed" compared to pre-pandemic levels.
Some of the worries may be starting to take their toll. Stocks have wobbled in recent days, endangering a sixth week of positive returns for the S&P 500. The CBOE Market Volatility index, known as Wall Street’s fear gauge, on Wednesday hit its highest level in a month.
Based on the level of the 10-year U.S. Treasury yield, Morgan Stanley strategists said in a note on Monday that the S&P 500 should be trading at about 20.5 times forward earnings estimates, as opposed to its current level of 21.5 times.
Some investors believe a startling rise in consumer prices to their highest level in more than three decades may accelerate the speed at which the Fed reduces its bond buying and eventually raises interest rates, potentially weighing on stocks and other risky assets. The central bank kicked off an unwind of its $120 billion government bond buying program this month
Market participants will also start turning their focus to next year, when S&P 500 profit growth is expected to slow to 7.5% after rebounding an estimated 49% this year following the pandemic shutdowns.
Chad Morganlander, portfolio manager at Washington Crossing Advisors, has been paring back his stock holdings in the past month, reducing equity exposure in some portfolios from an overweight position to neutral and moving more into cash and bonds.
Analysts at BofA Global Research recently wrote that investors’ options bets “reveal mounting demand for leverage as investors chase the market's performance into year-end.” Taken together with the market’s recent run, “we view this as FOMO… not a fundamentally justified rally.”
A Capital Economics report, meanwhile, said the firm’s analysts expect a gradual climb in real yields and underwhelming economic growth to hold back the U.S. stock market.
Tesla CEO Elon Musk offloaded a combined $6.9 billion worth of shares in the electric car company this week, taking advantage of a meteoric rally that vaulted the firm's value to over $1 trillion. The billionaire sold 1.2 million shares held by his trust for more than $1.2 billion on Friday, the latest in a flurry of his stock transactions, according to a U.S. securities filing released later in the day.
Inflation temporariness
(By Bloomberg Intelligence)
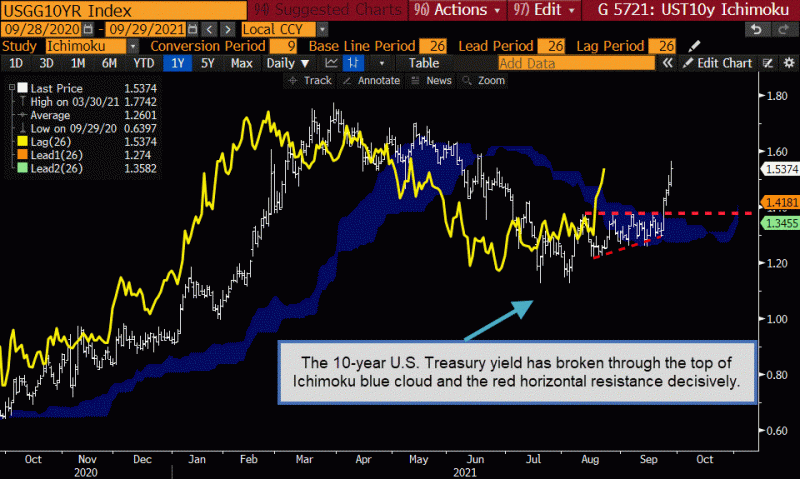
While central banks make assurances that inflation is transitory, many corners of the market suggest otherwise. Global angst among businesses about inflation is rising as the cost of raw materials rises, increasing pressure on them to raise consumer prices. The 10-year U.S. Treasury yield has broken through a key resistance, despite Federal Reserve assurances. Rising price pressures accelerated inflows into inflation-protected exchange traded funds this year. And the strong relationship between inflation and commodities indicate there’s more upside for raw material prices ahead.
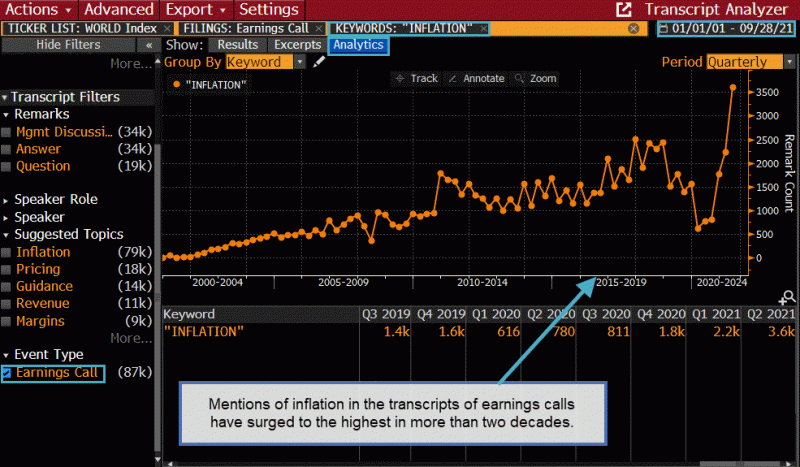
Mentions of inflation during earnings calls have surged in the past year with the last quarter seeing a surge to the highest in more than two decades. The word popped up more than 3,600 times in the transcripts of analyst briefings of 1,557 global stocks.
Bond traders have begun to position for the return of inflation, even as Fed Chair Jerome Powell said at a recent hearing that inflation will likely moderate after remaining elevated in the coming months.
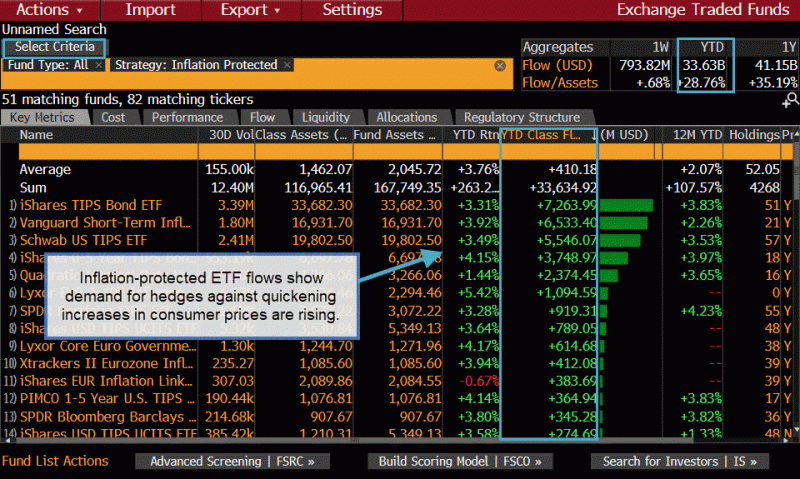
Investor demand for hedges against inflation is increasing. A total of 51 inflation-protected ETFs attracted $33.6 billion this year and registered a year-to-date gain of 3.8%. At $7.3 billion of net inflows, the iShares TIPS Bond ETF topped the list, followed by the Vanguard Short-Term Inflation-Protected Securities Index Fund at $6.5 billion.
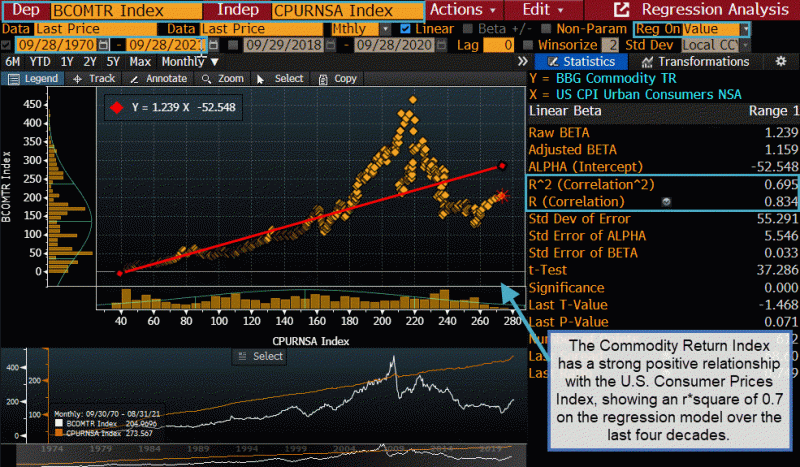
As inflation pressures grow, there has been a strong correlation between inflation and commodity prices historically. For example, the Commodity Return Index has a strong positive relationship with the U.S. Consumer Prices Index. The regression model shows an r*square of 0.7 over the last four decades. A reading of positive 1 would mean the securities move in lockstep.
COT Report
This week we do not have fresh numbers from CFTC, but SPDR statistics shows no changes by far as ETF reserves do not reflect any rally yet. But this is common thing as physical reserves have inertness and need time to react on market sentiment changes:

Source: SPDR Fund, FPA
As a bottom line
Now let's recall what we've said in the beginning. Gold and real interest rates relation resolves any concerns on why Gold jumps when nominal interest rates shows rally as well. Here we even do not mention jump of the US dollar as well:

And now take a look what has happened with real interest rates on Friday. Red line stands for inflation, black - nominal 1-year rate, blue - real short-term interest rate.
This level previously was seen on 1980's but there it was due minor mismatch and lag between inflation data and nominal interest rates reaction. In fact, there was no such a difference. In fact, so low interest rates last time was after WWII in 1945-1948 years.

Thus, our riddle has very clear conditions. Everybody understands that situation will not stand for too long. At some moment Fed patience blows and they start to act more aggressively. So, the first question is when this will happen... To answer it, we need to take Fed's place. They vitally need to rise employment, boost participation rate and support economy growth. It means that if they could, they would keep interest rates low as long as possible. But the problem is rising inflation. As they think that it is transitory - they need time to be sure that it is not. By our view, the maximum Fed patience credit stands in the IQ of 2022. On January they could point the acceleration of the tapering, while by the end of IQ of 2022, if inflation remains high - the rate change could be announced. Now it is widely suggested that rate will be changed somewhere in the summer. Until next meeting we get few more inflation reports.
The major risk still, that we see is sensitivity to the news of interest rates change. Although it could become not the real hazard - market makers, with any news release or statistics of higher inflation 100% start to shake the boat, scaring investors with coming interest rate change and aggressive Fed policy. It means that any statistics release potentially cares the risk of fast, sharp but short-term drawdown on the gold market. But it should not make any decisive impact on major direction that supposedly will be over only when Fed sends clear signal that inflation is not temporal anymore and real interest rates will change the direction.
Finally, by taking the global view on ongoing processes, it seems that the combination of CV-19 and artificial diversion of global supply chains (whatever the nature they have), are aimed to destroy China as major global competitor, economical and political. There is an opinion that "bottlenecks" are not natural but artificial and made intentionally to remove China as primary competitor from global arena. This is done by artificial price rising on Chinese goods via sabotage of cargo shipping, logistic chains and delays in off loading cargos in major ports. This leads to rising price on Chinese goods making them too expensive. US wants to send major production back to the US but also destroy the rival, launching chain economy disaster reaction inside the country. China economy is very fragile from social sphere point of view. Any delay and massive closing of small private firms could become a national problem, echoing across the whole domestic economy and population wealth. This is ultimate and slightly radical view on the situation, but who knows... If we're correct with this suggestion - gold has really golden times ahead.... And equity market fears look absolutely logical with this environment. Here is few scenarios, but final conclusion is up to you.
Technicals
Monthly
With the new facts and new reality, our recent mentioning of flag consolidation and that
August range, that is vital for short-term performance is broken up as well now. Trend still stands bearish here by far, but it needs some time to reverse. Speaking about upside target, we have very thrilling combination. Major COP is completed, but we also have all-time COP, when A point equals to ~ 40$ - fixed gold price to US dollar before the Bretton Wood. In this case all time COP agrees with YPR1 around 2165$. This is next nearest target on gold...

Weekly
Weekly trend has turned bullish and market hits nearest OP target, breaking the triangle resistance. Next logical target is 1920-1925$ area that includes larger scale OP, major Fib resistance level (which creates an Agreement, right?), and weekly Obought area:

Daily
Daily picture barely has changed since Friday. Price now stands at overbought here, after completing of local OP target. Odds suggest the technical retracement, that we actually have discussed on Friday as well. Now it seems that re-testing of 1830-1835$ support could be logical result of the pullback. Nearest upward target stands around 1915$ area and previous top, which is minor XOP of 4H chart. Next daily target is XOP at 1960$

Intraday
On intraday chart picture stands the same and it seems that DRPO pattern is growing, at least, we've got the 1st drop below 3x3 DMA. Here we're still watching for the moderate pullback to consider long entry.

As other markets this week, gold feels the whole power of inflation driving factor that pushed the gold prices to 5-month top. One would think - what is the reason for recent rally? Inflation jumps which brings potential hazard of interest rate change. Besides, as we already know - gold has weak inflation protection in short-term and ignores fluctuations of cyclical rate changes around major long-term global money devaluation trend, which is very slow. We suggest that the answer is twofold. First is - real interest rates. They have collapsed on inflation's jump. Second - Fed policy, as they tie hands and can't change rate right now, waiting for stabilization of employment. This lets gold to use this discrepancy
Market overview
Gold hit a five-month high on Wednesday, leading a rally in precious metals, as data showed U.S. consumer prices surged last month, burnishing bullion’s appeal as an inflation hedge. U.S. consumer prices accelerated in October as Americans paid more for gasoline and food, leading to the biggest annual gain in 31 years.
“Once again we have hot inflationary data,” said David Meger, director of metals trading at High Ridge Futures. “Gold being the quintessential hedge against inflation, we believe inflation is the underlying positive environment that will foster the gold market rally in the weeks and months ahead. This environment is a double-edged sword because as inflationary data continues to come out hotter than expected, the concern will be whether the Federal Reserve reduces liquidity faster than anticipated,” Meger said.
The rally looked past strength in the U.S. dollar, which usually dulls gold demand from other currency holders, for much of the session, but finally buckled to give up a chunk of the gains as the greenback hit its highest in over a year. Safe-haven gold, on course for a fifth straight day of gains, also drew support from a slide in real yields on U.S. Treasuries and the overall risk-off sentiment that pushed down Wall Street’s main indexes.
Its break above the key resistance level of $1,835 per ounce is important and a close above the $1,851 mark could ignite upward momentum towards $1,900, said Standard Chartered analyst Suki Cooper. Gold has a solid floor to build price momentum from given the seasonally strong demand from India,” she said.
Gold prices edged higher on Thursday, extending a rally fuelled by a surge in U.S. consumer prices that spurred some demand for the metal as an inflation hedge.
“Concerns about more persistent inflation or even the potential for stagflation is buttressing inflation hedge demand for TIPS, gold, and crypto, which could continue thematically in the short term as November CPI should keep showing underlying strength,” analysts at Citi said in a note.
The bank raised its 0-3 month gold price target to $1,900 and expects the metal to average $1,800 in the fourth quarter.
Gold also gained despite the dollar hitting its highest in a year and benchmark 10-year U.S. Treasury yields rising.
DailyFX currency strategist Ilya Spivak said prices could head lower as markets digest the CPI data, especially amid concerns that the U.S. Federal Reserve could tighten its policy more aggressively. Interest rate hikes to cool inflation should weigh on gold as they would raise the non-yielding metal’s opportunity cost.
Several Fed officials this week expressed growing concerns over more long-lasting inflation, even as they expect price increases to eventually subside.
“We are heading towards very challenging times with an economic slowdown appearing imminent and gold Exchange Traded Fund (ETF) demand should bounce back, supporting prices this year,” Kunal Shah, head of research at Nirmal Bang Commodities said, adding that expects gold to rise to $1,900 in coming months.
Gold slipped on Friday as some investors locked in profits from a six-session long streak of gains, and an uptick in U.S. bond yields cooled safe-haven inflows into bullion driven by inflation worries. Gold has gained as much as $110 since Nov. 3, bolstered by deepening fears of inflation and reassurances from key central banks that interest rates would remain low for the time being.
“Gold prices had gained due to a combination of factors. But if yields do continue to rise, the metal is probably not going to go much higher,” said Michael Hewson, chief market analyst at CMC Markets UK, adding gold is also seeing a “little bit of profit-taking after some really solid gains.”
Raising gold’s opportunity cost, U.S. benchmark 10-year Treasury yields held above the 1.5% mark, while the dollar index rose to its highest since July 2020.
While a stronger dollar typically makes gold more expensive for overseas buyers, bullion investors seemed to largely ignore the rally in the U.S. currency over the past couple of days as a big jump in U.S. consumer prices in October took centre-stage. But the initial rally kept inflation-hedge gold on track for a weekly gain.
“Gold has lifted its reputation as a store of value in particular after high inflation readings from the United States, and this will give further support,” Commerzbank analyst Daniel Briesemann said.
The sharp rise in inflation has also fanned fears that the Federal Reserve could hike interest rates sooner than expected.
"(But) the fact the Fed will tighten its monetary policy here starting this month is not having such a strong effect on gold prices," Briesemann added.
Societe Generale analysts forecast gold prices to average $1,950 an ounce in the first quarter of 2022, given the “renewed commitment from the Federal Reserve to support the economy while letting inflation printing higher.”
U.S. Treasury Secretary Janet Yellen said on Friday that labor force participation was "quite depressed" compared to pre-pandemic levels.
Yellen said there were several reasons for an "abnormally low" supply of labor, including a shortage of childcare workers and educators, which "creates childcare problems.""When we really get control of the (COVID-19) pandemic, I think labor supply will go back to normal," Yellen told CBS' "Face the Nation" in an interview on Friday.
"That also tends to suppress labor supply," she added.
Some of the worries may be starting to take their toll. Stocks have wobbled in recent days, endangering a sixth week of positive returns for the S&P 500. The CBOE Market Volatility index, known as Wall Street’s fear gauge, on Wednesday hit its highest level in a month.
Based on the level of the 10-year U.S. Treasury yield, Morgan Stanley strategists said in a note on Monday that the S&P 500 should be trading at about 20.5 times forward earnings estimates, as opposed to its current level of 21.5 times.
"We think retail flows, seasonal strength and institutional 'FOMO' have taken valuations above fair value," the Morgan Stanley strategists said, using the acronym for "fear of missing out."
Some investors believe a startling rise in consumer prices to their highest level in more than three decades may accelerate the speed at which the Fed reduces its bond buying and eventually raises interest rates, potentially weighing on stocks and other risky assets. The central bank kicked off an unwind of its $120 billion government bond buying program this month
Market participants will also start turning their focus to next year, when S&P 500 profit growth is expected to slow to 7.5% after rebounding an estimated 49% this year following the pandemic shutdowns.
Chad Morganlander, portfolio manager at Washington Crossing Advisors, has been paring back his stock holdings in the past month, reducing equity exposure in some portfolios from an overweight position to neutral and moving more into cash and bonds.
Investors have been "handsomely rewarded" in the wake of the Fed's easy money policies, he said. The real question is what to do now," Morganlander said. "Our viewpoint is that you want to try to be a little less risky."
Analysts at BofA Global Research recently wrote that investors’ options bets “reveal mounting demand for leverage as investors chase the market's performance into year-end.” Taken together with the market’s recent run, “we view this as FOMO… not a fundamentally justified rally.”
A Capital Economics report, meanwhile, said the firm’s analysts expect a gradual climb in real yields and underwhelming economic growth to hold back the U.S. stock market.
Tesla CEO Elon Musk offloaded a combined $6.9 billion worth of shares in the electric car company this week, taking advantage of a meteoric rally that vaulted the firm's value to over $1 trillion. The billionaire sold 1.2 million shares held by his trust for more than $1.2 billion on Friday, the latest in a flurry of his stock transactions, according to a U.S. securities filing released later in the day.
Inflation temporariness
(By Bloomberg Intelligence)
While central banks make assurances that inflation is transitory, many corners of the market suggest otherwise. Global angst among businesses about inflation is rising as the cost of raw materials rises, increasing pressure on them to raise consumer prices. The 10-year U.S. Treasury yield has broken through a key resistance, despite Federal Reserve assurances. Rising price pressures accelerated inflows into inflation-protected exchange traded funds this year. And the strong relationship between inflation and commodities indicate there’s more upside for raw material prices ahead.
Mentions of inflation during earnings calls have surged in the past year with the last quarter seeing a surge to the highest in more than two decades. The word popped up more than 3,600 times in the transcripts of analyst briefings of 1,557 global stocks.
Bond traders have begun to position for the return of inflation, even as Fed Chair Jerome Powell said at a recent hearing that inflation will likely moderate after remaining elevated in the coming months.
Investor demand for hedges against inflation is increasing. A total of 51 inflation-protected ETFs attracted $33.6 billion this year and registered a year-to-date gain of 3.8%. At $7.3 billion of net inflows, the iShares TIPS Bond ETF topped the list, followed by the Vanguard Short-Term Inflation-Protected Securities Index Fund at $6.5 billion.
As inflation pressures grow, there has been a strong correlation between inflation and commodity prices historically. For example, the Commodity Return Index has a strong positive relationship with the U.S. Consumer Prices Index. The regression model shows an r*square of 0.7 over the last four decades. A reading of positive 1 would mean the securities move in lockstep.
COT Report
This week we do not have fresh numbers from CFTC, but SPDR statistics shows no changes by far as ETF reserves do not reflect any rally yet. But this is common thing as physical reserves have inertness and need time to react on market sentiment changes:
Source: SPDR Fund, FPA
As a bottom line
Now let's recall what we've said in the beginning. Gold and real interest rates relation resolves any concerns on why Gold jumps when nominal interest rates shows rally as well. Here we even do not mention jump of the US dollar as well:
And now take a look what has happened with real interest rates on Friday. Red line stands for inflation, black - nominal 1-year rate, blue - real short-term interest rate.
This level previously was seen on 1980's but there it was due minor mismatch and lag between inflation data and nominal interest rates reaction. In fact, there was no such a difference. In fact, so low interest rates last time was after WWII in 1945-1948 years.
Thus, our riddle has very clear conditions. Everybody understands that situation will not stand for too long. At some moment Fed patience blows and they start to act more aggressively. So, the first question is when this will happen... To answer it, we need to take Fed's place. They vitally need to rise employment, boost participation rate and support economy growth. It means that if they could, they would keep interest rates low as long as possible. But the problem is rising inflation. As they think that it is transitory - they need time to be sure that it is not. By our view, the maximum Fed patience credit stands in the IQ of 2022. On January they could point the acceleration of the tapering, while by the end of IQ of 2022, if inflation remains high - the rate change could be announced. Now it is widely suggested that rate will be changed somewhere in the summer. Until next meeting we get few more inflation reports.
Many banks, foresee the Fed response and already have increased gold price forecasts for the end of the year, such as Société General and Citi. Here we're also not occasionally talked on US stock market. VIX is rising slowly, fear is rising, but has not reached yet the critical level. Investors gradually unwind portfolios and move to safety. These moments promise good few months to the gold market.So the fact that we've had high PPI numbers gave us some insight into the fact that we were going to get higher CPI, and there's still a lot of room there, which tells me we’ll have higher inflation again next month as well. These numbers have brought the probability of a rate hike in June up a little bit, but it won't bring it any closer than June,” said Randy Frederick from Charles Schwab.
The major risk still, that we see is sensitivity to the news of interest rates change. Although it could become not the real hazard - market makers, with any news release or statistics of higher inflation 100% start to shake the boat, scaring investors with coming interest rate change and aggressive Fed policy. It means that any statistics release potentially cares the risk of fast, sharp but short-term drawdown on the gold market. But it should not make any decisive impact on major direction that supposedly will be over only when Fed sends clear signal that inflation is not temporal anymore and real interest rates will change the direction.
Finally, by taking the global view on ongoing processes, it seems that the combination of CV-19 and artificial diversion of global supply chains (whatever the nature they have), are aimed to destroy China as major global competitor, economical and political. There is an opinion that "bottlenecks" are not natural but artificial and made intentionally to remove China as primary competitor from global arena. This is done by artificial price rising on Chinese goods via sabotage of cargo shipping, logistic chains and delays in off loading cargos in major ports. This leads to rising price on Chinese goods making them too expensive. US wants to send major production back to the US but also destroy the rival, launching chain economy disaster reaction inside the country. China economy is very fragile from social sphere point of view. Any delay and massive closing of small private firms could become a national problem, echoing across the whole domestic economy and population wealth. This is ultimate and slightly radical view on the situation, but who knows... If we're correct with this suggestion - gold has really golden times ahead.... And equity market fears look absolutely logical with this environment. Here is few scenarios, but final conclusion is up to you.
Technicals
Monthly
With the new facts and new reality, our recent mentioning of flag consolidation and that
now takes the special meaning. This week gold strongly has broken above the YPP. Price now not at overbought. Flag consolidation could be treated as reaction on COP, response to the target. Upward breakout could mean that the reaction is over. In fact, erasing of potentially bearish scenarios on weekly chart now could be treated as a bullish sign."in general, market stands in very small pullback from ATH comparing to the scale of the rally. In long term scale price action has the features of retracement, forming big flag consolidation with choppy action inside and standing above nearest 3/8 Fib level. This type of action is difficult to call as strong bearish reversal, at least for now."
August range, that is vital for short-term performance is broken up as well now. Trend still stands bearish here by far, but it needs some time to reverse. Speaking about upside target, we have very thrilling combination. Major COP is completed, but we also have all-time COP, when A point equals to ~ 40$ - fixed gold price to US dollar before the Bretton Wood. In this case all time COP agrees with YPR1 around 2165$. This is next nearest target on gold...
Weekly
Weekly trend has turned bullish and market hits nearest OP target, breaking the triangle resistance. Next logical target is 1920-1925$ area that includes larger scale OP, major Fib resistance level (which creates an Agreement, right?), and weekly Obought area:
Daily
Daily picture barely has changed since Friday. Price now stands at overbought here, after completing of local OP target. Odds suggest the technical retracement, that we actually have discussed on Friday as well. Now it seems that re-testing of 1830-1835$ support could be logical result of the pullback. Nearest upward target stands around 1915$ area and previous top, which is minor XOP of 4H chart. Next daily target is XOP at 1960$
Intraday
On intraday chart picture stands the same and it seems that DRPO pattern is growing, at least, we've got the 1st drop below 3x3 DMA. Here we're still watching for the moderate pullback to consider long entry.