Sive Morten
Special Consultant to the FPA
- Messages
- 18,655
Fundamentals
Gold market takes participation in global financial and political process in a row with other markets. Last week we've taken in consideration problems that China could met in nearest 2-3 years and this could make impact on the gold market as well.
Yesterday we've taken a look at broader situation and talked about possible financial crisis in 2020 in US, which as usual will impact the whole world. Interestingly that both researches - on China and US mostly point at the same time period. Besides, we already have said that all countries actively accumulate gold reserves. Taking it all together, it is difficult to treat it as occasion. Technical picture also doesn't exclude scenario of trend reversal within 2-3 years. It means that financial world is coming to very dramatic phase.
In shorter-term gold is driving by the same factors. As Reuters reports, it turned negative on Friday, as the U.S. dollar rose against the Chinese yuan after U.S. President Donald Trump reportedly told aides to proceed with tariffs on Chinese imports.
Trump has directed aides to place tariffs on about $200 billion of Chinese goods, according to a person familiar with the matter. Bloomberg News first reported Trump’s action.
“I think that’s what’s driving gold lower, the dollar higher and the S&P market lower,” said Michael Matousek, head trader at U.S. Global Investors. “Companies are theoretically going to make less money because they will get that tax.”
After the latest U.S.-China tariff development, the dollar index extended earlier gains against a basket of currencies, including the yuan, while the S&P 500 declined.
The months-long trade tension between Washington and Beijing has prompted investors to buy the U.S. dollar, in the belief that the United States has less to lose from the dispute.
Gold has shown a close correlation to the currency of China, the biggest gold consuming nation, analysts say.
Meanwhile, investors widely expect another U.S. interest rate increase. Higher rates make gold less attractive since it does not pay interest but costs money to store and insure.
Gold prices have declined about 12 percent from a peak of $1,365.23 in April amid the intensifying global trade tensions and rising U.S. interest rates.
In general we keep our view that short-term perspective is not friendly for gold market. US shows good statistics, probability of another 2 rate increase are rather high, and also this tendency should continue in 2019 as well. Demand for US dollar will be supported by new spiral of tariffs tensions and hard manipulation of EU export by US side.
SPDR fund shows sad picture with straight down trend of gold reserves. Despite that gold has turned to upside retracement, this makes no impact on SPDR:
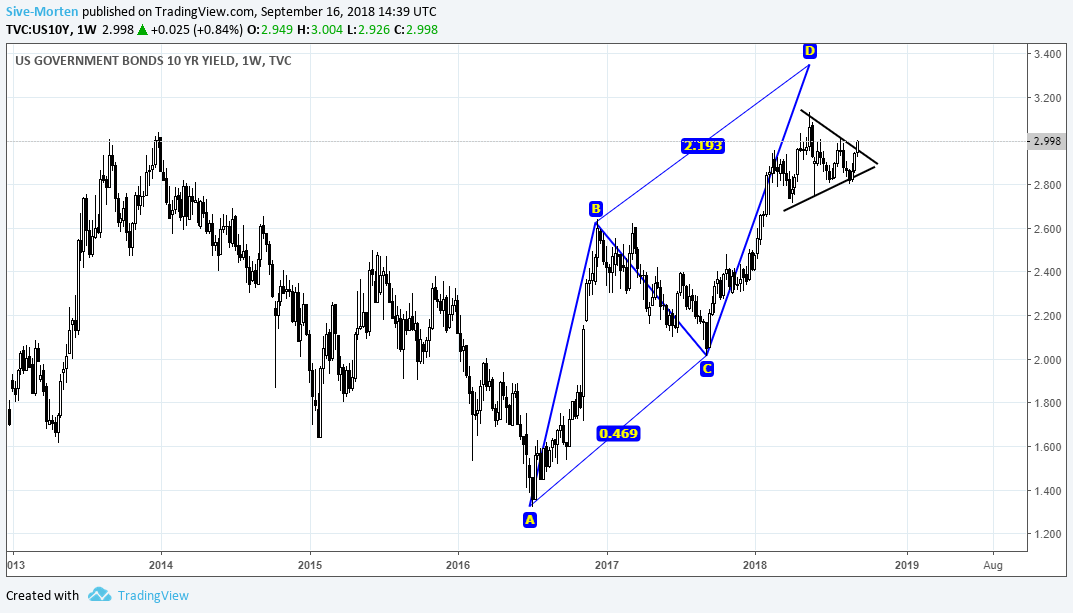
 US 10-year yields follow our scenario and have tested 3% area again:
COT Report
COT data shows that gold keeps net bearish position for 6 weeks, open interest also stands mostly without changes. It means that investors do not take aggressive action and mostly keep existed positions. So, sentiment still stands moderately bearish.

Next week we will get multiple central banks meetings and new round of Brexit negotiations. It could be very important week for gold market.
Technical
Monthly
In monthly part we keep our long-term technical scenario, that could be realized. this is not single possible scenario, but currently it seems as very probable.
Here we try to involve fundamental view in technical analysis, trying to combine patterns with real fundamental situation on gold market. So, we will take broader view, also because shorter-term perspectives was discussed in details already within a few years.
If you follow our weekly update, you should remember our explanation and why we think that gold inablility to break through 1380 resistance should be treated as bulls' defeate and gold failure. This is important in outlook of farer perspective.
Fundamental picture suggest two major things. In shorter-term US will keep dominate role in the world, because indirectly it controls EU economy as major EU companies have significant part of their business in US, or on US territory, US dollar is still world major currency and, as we've estimated above, China starts to show signs of chilling their economy. US economy itself feels good. D. Trump by restructuring of political role of US on international arena will safe a lot of "unnessary" spending, such as revolutions, support of different programms of opposition financing, military spending of different kind. This should improve US budget, reduce deficit, which also will work on support of US economy.
Second important issue, this long-term relations that stand for decades start chaning. Both of these moments, putting together, lead us to following conclusion. Within few years, 2-3 probably gold will remain under pressure of positive interest rates cycle. While gradullay, when breaking of long-term economic relations will be seen brighter and brighter and impact not only China, EU but US as well - this will be turning point for the gold, or slightly before that. Because any global crush of any kind triggers demand for gold. That is what we see from fundamentals.
It could look unbelievable, but technical picture shows approximately the same. Failure of 1380 upside breakout confirms our idea of 2-3 years of US and US Dollar domination. But at the same time gold should show preparation to reversal, and here it is. One of the scenarios that might be formed here is big 1.618 butterfly, which is bullish reversal pattern. It has 1.618 target right around gold price, which is corresponds to extraction spendings approximately. So, it is long-term breakeven point.
Finally, butterfly could become large reverse H&S pattern around all time 5/8 Fib support and ~40% of this pattern could be seen on the market. What we see on the chart nicely corresponds to current fundamental background.
Of course, political life is not static, and it could show fast turns. But right now, everything looks very harmonic.
Last week, we also have mentioned huge demand on gold from emerging countries - China, Russia and Turkey. Developed countries repatriate gold from US. It means that everybody prepares to something, which should significantly increase demand for a gold.
So, that's is our long-term view. There is softer scenario of "222" Buy pattern instead of butterfly exists, but which one will happen in reality is impossible to say right now and we will keep an eye on both.

Weekly
Weekly price action mostly stands inside the range of long August candle, when gold has hit weekly oversold. Since then we watch for patterns here and upside bounce to at least 3/8 resistance area of 1238$, which seems normal pullback in such conditions.
Despite our long term bearish trend on gold, it can't show streight down action without any pauses. And we think that one of these stops we have right now. Although the scale of this "pause" looks impressive 50-70$ per contract bounce, on weekly chart this is just 3/8 pullback, which seems normal when market hits oversold and YPS1 areas. Thus, on weekly we still watch for our directional pattern, based on the thrust down.
Weekly time frame is the one that gives us the vision for few weeks. In a longer-term view we still have large AB=CD pattern with OP around 1113 area. Sooner or later but probably it should be reached. Just because gold has dropped easily through 1215 major support and has not stopped at 1180 YPS1 but collapsed right to 1160. So, now price action stands between COP and OP target. Usually in such placement, price gravitates to OP, because in fact, it has no strong support lower, its a free space. And the only thing that keeps gold from disaster is Oversold condition, which important for us in short-term view.
Oversold suggests upside bounce at least to 3/8 resistance area - 1238$. It looks far on weekly chart, but in reality, this is just 30% and common response to reaching of OS. Since our major direction is down - we're mostly looking for chances to go short here, and upside bounce to Fib level could give us B&B "Sell". That's particular the pattern that we will be watching for here. Currently we have shape of engulfing price action and retracement back inside its body is common practice.
In shorter-term we've got a new input here - bearish grabber. It doesn't cancel scenario with upside bounce (although it could), but significantly changes possible price shape. Thus, it suggests taking out of recent lows and drop to MPS1. It means that we will have to turn in favor of Double bottom pattern on daily chart rather than simple AB=CD.

Daily
Here gold shows the same irrational behavior from bulls point of view as EUR. Take a look, on Friday gold shows sharp reversal without visible technical reasons - market has not reached neither previous tops, nor some resistance or targets, just downside reversal.
In addition we have bearish MACD divergence here. Taking in consideration weekly bearish grabber, our context turns bearish, which makes rather dangerous any attempt to go long. It means that bulls should wait when weekly grabber will either worked out or cancelled. And when clear bullish pattern will be formed here, on daily. Situation becomes attractive for intraday bears.

Intraday
Since we have grabber, we could sell against its tops while it is valid. Market stands near hourly XOP target, once it will hit it, some minor bounce could follow. Recent action is straight forward, so, it is suitable for DiNapoli directional pattern. If B&B "Sell" will be formed around 1198 Fib resistance and WPP - this will be good setup for us. Once B&B will be triggered, stops have to be moved to breakeven.

Conclusion
In long-term analysis we see thrilling agreement of fundamental and technical pictures, which should be interesting to watch within few years.
Shorter-term setup has changed to bearish, as weekly bearish grabber has been formed. It makes very dangerous any attempt to go long on daily and intraday charts.
The technical portion of Sive's analysis owes a great deal to Joe DiNapoli's methods, and uses a number of Joe's proprietary indicators. Please note that Sive's analysis is his own view of the market and is not endorsed by Joe DiNapoli or any related companies.
Gold market takes participation in global financial and political process in a row with other markets. Last week we've taken in consideration problems that China could met in nearest 2-3 years and this could make impact on the gold market as well.
Yesterday we've taken a look at broader situation and talked about possible financial crisis in 2020 in US, which as usual will impact the whole world. Interestingly that both researches - on China and US mostly point at the same time period. Besides, we already have said that all countries actively accumulate gold reserves. Taking it all together, it is difficult to treat it as occasion. Technical picture also doesn't exclude scenario of trend reversal within 2-3 years. It means that financial world is coming to very dramatic phase.
In shorter-term gold is driving by the same factors. As Reuters reports, it turned negative on Friday, as the U.S. dollar rose against the Chinese yuan after U.S. President Donald Trump reportedly told aides to proceed with tariffs on Chinese imports.
Trump has directed aides to place tariffs on about $200 billion of Chinese goods, according to a person familiar with the matter. Bloomberg News first reported Trump’s action.
“I think that’s what’s driving gold lower, the dollar higher and the S&P market lower,” said Michael Matousek, head trader at U.S. Global Investors. “Companies are theoretically going to make less money because they will get that tax.”
After the latest U.S.-China tariff development, the dollar index extended earlier gains against a basket of currencies, including the yuan, while the S&P 500 declined.
The months-long trade tension between Washington and Beijing has prompted investors to buy the U.S. dollar, in the belief that the United States has less to lose from the dispute.
Gold has shown a close correlation to the currency of China, the biggest gold consuming nation, analysts say.
Meanwhile, investors widely expect another U.S. interest rate increase. Higher rates make gold less attractive since it does not pay interest but costs money to store and insure.
Gold prices have declined about 12 percent from a peak of $1,365.23 in April amid the intensifying global trade tensions and rising U.S. interest rates.
In general we keep our view that short-term perspective is not friendly for gold market. US shows good statistics, probability of another 2 rate increase are rather high, and also this tendency should continue in 2019 as well. Demand for US dollar will be supported by new spiral of tariffs tensions and hard manipulation of EU export by US side.
SPDR fund shows sad picture with straight down trend of gold reserves. Despite that gold has turned to upside retracement, this makes no impact on SPDR:
COT data shows that gold keeps net bearish position for 6 weeks, open interest also stands mostly without changes. It means that investors do not take aggressive action and mostly keep existed positions. So, sentiment still stands moderately bearish.
Technical
Monthly
In monthly part we keep our long-term technical scenario, that could be realized. this is not single possible scenario, but currently it seems as very probable.
Here we try to involve fundamental view in technical analysis, trying to combine patterns with real fundamental situation on gold market. So, we will take broader view, also because shorter-term perspectives was discussed in details already within a few years.
If you follow our weekly update, you should remember our explanation and why we think that gold inablility to break through 1380 resistance should be treated as bulls' defeate and gold failure. This is important in outlook of farer perspective.
Fundamental picture suggest two major things. In shorter-term US will keep dominate role in the world, because indirectly it controls EU economy as major EU companies have significant part of their business in US, or on US territory, US dollar is still world major currency and, as we've estimated above, China starts to show signs of chilling their economy. US economy itself feels good. D. Trump by restructuring of political role of US on international arena will safe a lot of "unnessary" spending, such as revolutions, support of different programms of opposition financing, military spending of different kind. This should improve US budget, reduce deficit, which also will work on support of US economy.
Second important issue, this long-term relations that stand for decades start chaning. Both of these moments, putting together, lead us to following conclusion. Within few years, 2-3 probably gold will remain under pressure of positive interest rates cycle. While gradullay, when breaking of long-term economic relations will be seen brighter and brighter and impact not only China, EU but US as well - this will be turning point for the gold, or slightly before that. Because any global crush of any kind triggers demand for gold. That is what we see from fundamentals.
It could look unbelievable, but technical picture shows approximately the same. Failure of 1380 upside breakout confirms our idea of 2-3 years of US and US Dollar domination. But at the same time gold should show preparation to reversal, and here it is. One of the scenarios that might be formed here is big 1.618 butterfly, which is bullish reversal pattern. It has 1.618 target right around gold price, which is corresponds to extraction spendings approximately. So, it is long-term breakeven point.
Finally, butterfly could become large reverse H&S pattern around all time 5/8 Fib support and ~40% of this pattern could be seen on the market. What we see on the chart nicely corresponds to current fundamental background.
Of course, political life is not static, and it could show fast turns. But right now, everything looks very harmonic.
Last week, we also have mentioned huge demand on gold from emerging countries - China, Russia and Turkey. Developed countries repatriate gold from US. It means that everybody prepares to something, which should significantly increase demand for a gold.
So, that's is our long-term view. There is softer scenario of "222" Buy pattern instead of butterfly exists, but which one will happen in reality is impossible to say right now and we will keep an eye on both.
Weekly
Weekly price action mostly stands inside the range of long August candle, when gold has hit weekly oversold. Since then we watch for patterns here and upside bounce to at least 3/8 resistance area of 1238$, which seems normal pullback in such conditions.
Despite our long term bearish trend on gold, it can't show streight down action without any pauses. And we think that one of these stops we have right now. Although the scale of this "pause" looks impressive 50-70$ per contract bounce, on weekly chart this is just 3/8 pullback, which seems normal when market hits oversold and YPS1 areas. Thus, on weekly we still watch for our directional pattern, based on the thrust down.
Weekly time frame is the one that gives us the vision for few weeks. In a longer-term view we still have large AB=CD pattern with OP around 1113 area. Sooner or later but probably it should be reached. Just because gold has dropped easily through 1215 major support and has not stopped at 1180 YPS1 but collapsed right to 1160. So, now price action stands between COP and OP target. Usually in such placement, price gravitates to OP, because in fact, it has no strong support lower, its a free space. And the only thing that keeps gold from disaster is Oversold condition, which important for us in short-term view.
Oversold suggests upside bounce at least to 3/8 resistance area - 1238$. It looks far on weekly chart, but in reality, this is just 30% and common response to reaching of OS. Since our major direction is down - we're mostly looking for chances to go short here, and upside bounce to Fib level could give us B&B "Sell". That's particular the pattern that we will be watching for here. Currently we have shape of engulfing price action and retracement back inside its body is common practice.
In shorter-term we've got a new input here - bearish grabber. It doesn't cancel scenario with upside bounce (although it could), but significantly changes possible price shape. Thus, it suggests taking out of recent lows and drop to MPS1. It means that we will have to turn in favor of Double bottom pattern on daily chart rather than simple AB=CD.
Daily
Here gold shows the same irrational behavior from bulls point of view as EUR. Take a look, on Friday gold shows sharp reversal without visible technical reasons - market has not reached neither previous tops, nor some resistance or targets, just downside reversal.
In addition we have bearish MACD divergence here. Taking in consideration weekly bearish grabber, our context turns bearish, which makes rather dangerous any attempt to go long. It means that bulls should wait when weekly grabber will either worked out or cancelled. And when clear bullish pattern will be formed here, on daily. Situation becomes attractive for intraday bears.
Intraday
Since we have grabber, we could sell against its tops while it is valid. Market stands near hourly XOP target, once it will hit it, some minor bounce could follow. Recent action is straight forward, so, it is suitable for DiNapoli directional pattern. If B&B "Sell" will be formed around 1198 Fib resistance and WPP - this will be good setup for us. Once B&B will be triggered, stops have to be moved to breakeven.
Conclusion
In long-term analysis we see thrilling agreement of fundamental and technical pictures, which should be interesting to watch within few years.
Shorter-term setup has changed to bearish, as weekly bearish grabber has been formed. It makes very dangerous any attempt to go long on daily and intraday charts.
The technical portion of Sive's analysis owes a great deal to Joe DiNapoli's methods, and uses a number of Joe's proprietary indicators. Please note that Sive's analysis is his own view of the market and is not endorsed by Joe DiNapoli or any related companies.