Gold

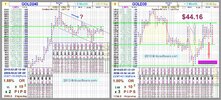
Current development argues that a short term top is at least formed at 1123.4, with mild bearish divergence condition in 4 hours MACD, after Gold hits upper channel resistance. Intraday bias is now mildly on the downside for 4 hours 55 EMA (now at 1095.4 first. Sustained trading below will target a test on the lower channel support (now at 1053.2). On the upside, however, above 1123.4 again will indicate that recent rally is still in progress for 61.8% projection of 681 to 1007.7 from 931.3 at 1133.2.

In the bigger picture, the long term up trend in Gold is still in progress. Rise from 681 would likely develop into another set of five wave sequence with first wave completed at 1007.7, second wave triangle consolidation completed at 931.3. Rise from 931.3 is expected to extend to 61.8% projection of 681 to 1007.7 from 931.3 at 1133.2 first and then 100% projection at 1258 next. On the downside, break of 1026.9 support will suggest that a top is formed and bring consolidation. But we'll hold on to the bullish view as long as 931.3 key support holds.[oilngold]

"P&F GOLD30 Box Size500X3 or(1.42%) HI/LO
Data 1122.7 - 984.99 ~ 2 Month ~ 58.6 Day
Database 2028 records 1118.29 (Last Close)
2009-09-16 08~00
2009-11-13 22~30
(GMT+01:00) Paris
BJF Trading Group chart"

1120.00|~5OO||________________________________x_______|0.24%|13.71%
1115.00|~1OOO|____________________________x_o_x_o_x_o_|0.69%|13.2%
1110.00|~15OO|____________________________x___x_o_x___|1.13%|12.69%
1105.00|~2OOO|____________________________x_____o_____|1.58%|12.18%
1100.00|~25OO|____________________________x___________|2.02%|11.68%
1095.00|~3OOO|____________________________x___________|2.47%|11.17%
1090.00|~35OO|____________________________x___________|2.91%|10.66%
1085.00|~4OOO|____________________________x___________|3.36%|10.15%
1080.00|~45OO|____________________________x___________|3.8%|9.65%
1075.00|~5OOO|____________________________x___________|4.25%|9.14%
1070.00|~55OO|________________x___________x___________|4.69%|8.63%
1065.00|~6OOO|________________x_o_x___x___x___________|5.14%|8.12%
1060.00|~65OO|____________x___x_o_x_o_x_o_x___________|5.58%|7.62%
1055.00|~7OOO|____________x_o_x_o_x_o_x_o_x___________|6.03%|7.11%
1050.00|~75OO|____________x_o_x_o_x_o___o_x___________|6.48%|6.6%
1045.00|~8OOO|____________x_o___o_______o_x___________|6.92%|6.09%
1040.00|~85OO|____________x_____________o_x___________|7.37%|5.58%
1035.00|~9OOO|____________x_____________o_x___________|7.81%|5.08%
1030.00|~95OO|____________x_____________o_____________|8.26%|4.57%
1025.00|~1OOO|____________x___________________________|8.7%|4.06%
1020.00|~1O5O|x___________x___________________________|9.15%|3.55%
1015.00|~11OO|x_o_x_______x___________________________|9.59%|3.05%
1010.00|~115O|x_o_x_o_____x___________________________|10.04%|2.54%
1005.00|~12OO|__o_x_o_x___x___________________________|10.48%|2.03%
1000.00|~125O|__o___o_x_o_x___________________________|10.93%|1.52%
995.00|~13OO||______o_x_o_x___________________________|11.37%|1.02%
990.00|~135O||______o_x_o_____________________________|11.82%|0.51%
985.00|~14OO||______o_________________________________|12.27%|0%
980.00|~145O||________________________________________|12.71%|-0.51%
Column|~15OO||3_4_3_6_4_3_143_5_5_4_3_3_7_171_3_3_2_1_|
Count

=============================
 

Attachments

  • BJF-Trading-Group-091114gold_h4.PNG
    BJF-Trading-Group-091114gold_h4.PNG
    156.7 KB · Views: 4
  • BJF-Trading-Group-091114gold_h4.zip
    26.4 KB · Views: 0
A long time gold bull, Eric Sprott says that gold is picking up momentum and analysts are saying that it's not too late to get in even though gold hit a new high last week and is up 26% year to date.
 
Gold reaches as high as 1227.5 so far and at this point, intraday bias remains on the upside for mentioned target of 61.8% projection of 1026.9 to 1196 from 1130.1 at 1233.7. Break will target medium term projection level at 1258. On the downside, below 1208 minor support will indicate that an intraday top is in place and bring pull back, probably to 4 hours 55 EMA (now at 1182.6) before staging another rise.
In the bigger picture, rise from 681 is expected to develop into a set of five wave sequence with first wave completed at 1007.7, second wave triangle consolidation completed at 931.3. Rise from 931.3 is treated as the third wave and there is no indication of completion yet. Such rally is still expected to continue and target 100% projection of 681 to 1007.7 from 931.3 at 1258. We'll hold on to this bullish view as long as 1072 resistance turn supported holds.[oilngold]

"P&F GOLD10080 Box Size3200X2 or(8.66%) CLOSE
Data 1226.37 - 251.7 ~ 215 Month ~ 6545 Day
Database 942 records 1203.55 (Last Close)
1991-12-29 00~00
2009-11-29 00~00
(GMT+01:00) Paris
BJF Trading Group chart"

1216.00|~32OO|____________________________________________________________|0.85%|383.11%
1184.00|~64OO|__________________________________________________________x_|3.45%|370.4%
1152.00|~96OO|__________________________________________________________x_|6.06%|357.69%
1120.00|~128O|__________________________________________________________x_|8.67%|344.97%
1088.00|~16OO|__________________________________________________________x_|11.28%|332.26%
1056.00|~192O|__________________________________________________________x_|13.89%|319.55%
1024.00|~224O|__________________________________________________________x_|16.5%|306.83%
992.00|~256O||__________________________________x_______________x_______x_|19.11%|294.12%
960.00|~288O||__________________________________x_o_x___________x_o_x___x_|21.72%|281.41%
928.00|~32OO||__________________________________x_o_x_o_________x_o_x_o_x_|24.33%|268.69%
896.00|~352O||__________________________________x_o_x_o_________x_o_x_o___|26.94%|255.98%
864.00|~384O||__________________________________x_o_x_o_x_______x_o_______|29.55%|243.27%
832.00|~416O||__________________________________x_o___o_x_o_____x_________|32.16%|230.55%
800.00|~448O||__________________________________x_____o_x_o_x___x_________|34.77%|217.84%
768.00|~48OO||__________________________________x_____o_x_o_x_o_x_________|37.38%|205.13%
736.00|~512O||__________________________________x_____o___o_x_o___________|39.99%|192.41%
704.00|~544O||______________________x___________x_________o_______________|42.59%|179.7%
672.00|~576O||______________________x_o_________x_________________________|45.2%|166.98%
640.00|~6O8O||______________________x_o_x___x___x_________________________|47.81%|154.27%
608.00|~64OO||______________________x_o_x_o_x_o_x_________________________|50.42%|141.56%
576.00|~672O||______________________x_o___o_x_o___________________________|53.03%|128.84%
544.00|~7O4O||______________________x_____o_______________________________|55.64%|116.13%
512.00|~736O||______________________x_____________________________________|58.25%|103.42%
480.00|~768O||______________________x_____________________________________|60.86%|90.7%
448.00|~8OOO||__________________x___x_____________________________________|63.47%|77.99%
416.00|~832O||______________x___x_o_x_____________________________________|66.08%|65.28%
384.00|~864O||__x___x_______x_o_x_o_______________________________________|68.69%|52.56%
352.00|~896O||__x_o_x_o_____x_o___________________________________________|71.3%|39.85%
320.00|~928O||o___o___o_x___x_____________________________________________|73.91%|27.14%
288.00|~96OO||________o_x_o_x_____________________________________________|76.52%|14.42%
256.00|~992O||________o_x_o_______________________________________________|79.13%|1.71%
224.00|~1O24||________o___________________________________________________|81.73%|-11.01%
Column|~1O56||1_2_2_2_5_3_2_5_2_3_2_104_2_3_3_2_135_4_7_4_5_3_2_8_4_3_2_9_|
Count


BJF-Trading-Group-GOLD_H4and5min_091204.xls
 
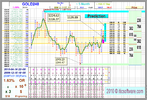
Gold's recovery stalled after hitting 38.2% retracement of 1227.5 to 1075.2 at 1133.4 and with 4 hours MACD crossed below signal line, intraday bias is turned neutral. With 1115.9 minor support intact, another rise cannot be ruled out and above 1141 will target 61.8% retracement at 1169.3 next. On the downside, however, break of 1115.9 minor support will argue that recovery from 1075.2 might have completed and will flip intraday bias back to the downside for retesting this support.
In the bigger picture, rise from 681 is expected to develop into a set of five wave sequence with first wave completed at 1007.7, second wave triangle consolidation completed at 931.3. Rise from 931.3 is treated as the third wave and has possibly completed at 1227.5 after missing 100% projection of 681 to 1007.7 from 931.3 at 1258. Deeper pull back could now be seen to 1026.9/1072 support zone, or even further to retest 1000 psychological level. But downside should be contained well above 931.3 support and bring up trend resumption to another high above 1227.5.[oilngold]

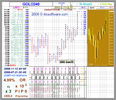
"P&F GOLD240 Box Size1780X3 or(5.6%) HI/LO
Data 1226.37 - 681.4 ~ 16 Month ~ 476.5 Day
Database 2011 records 1122.27 (Last Close)
2008-09-19 00~00
2010-01-08 12~00
(GMT+01:00) Paris
BJF Trading Group chart"

1228.20|~1780||____________________________________________|-0.15%|80.25%
1210.40|~3560||______________________________________x_o___|1.3%|77.63%
1192.60|~5340||__________________________________x___x_o___|2.75%|75.02%
1174.80|~7120||__________________________________x_o_x_o___|4.21%|72.41%
1157.00|~89O0||__________________________________x_o_x_o___|5.66%|69.8%
1139.20|~1O680|__________________________________x_o___o_x_|7.11%|67.19%
1121.40|~12460|__________________________________x_____o_x_|8.56%|64.57%
1103.60|~14240|__________________________________x_____o_x_|10.01%|61.96%
1085.80|~16O20|__________________________________x_____o___|11.46%|59.35%
1068.00|~178O0|__________________________________x_________|12.91%|56.74%
1050.20|~19580|__________________________________x_________|14.37%|54.12%
1032.40|~21360|__________________________________x_________|15.82%|51.51%
1014.60|~23140|__________________________________x_________|17.27%|48.9%
996.80|~24920||______________________x___________x_________|18.72%|46.29%
979.00|~267O0||______________________x_o_____x___x_________|20.17%|43.67%
961.20|~28480||______________________x_o_x___x_o_x_________|21.62%|41.06%
943.40|~3O260||______________________x_o_x_o_x_o_x_________|23.07%|38.45%
925.60|~32O40||______x_______________x_o_x_o_x_o_x_________|24.53%|35.84%
907.80|~33820||__x___x_o_____________x_o_x_o_x_o___________|25.98%|33.23%
890.00|~356O0||__x_o_x_o_____________x_o___o_x_____________|27.43%|30.61%
872.20|~37380||__x_o_x_o_________x___x_____o_______________|28.88%|28%
854.40|~39160||__x_o_x_o_________x_o_x_____________________|30.33%|25.39%
836.60|~4O940||o___o___o_________x_o_x_____________________|31.78%|22.78%
818.80|~42720||o_______o_____x___x_o_______________________|33.23%|20.16%
801.00|~445O0||________o_____x_o_x_________________________|34.69%|17.55%
783.20|~46280||________o_____x_o_x_________________________|36.14%|14.94%
765.40|~48O60||________o_x___x_o_x_________________________|37.59%|12.33%
747.60|~49840||________o_x_o_x_o___________________________|39.04%|9.72%
729.80|~51620||________o_x_o_x_____________________________|40.49%|7.1%
712.00|~534O0||________o_x_o_______________________________|41.94%|4.49%
694.20|~55180||________o___________________________________|43.39%|1.88%
676.40|~56960||____________________________________________|44.85%|-0.73%
Column|~58740||2_4_4_5_134_3_6_4_7_3_106_4_5_6_4_163_4_8_3_|
Count


BJF-Trading-Group-GOLD_30min
 
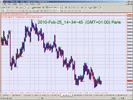
As discussed before, Gold's choppy recovery from 1044.5 should have completed at 1131.5 already after failing to sustain above 1126.4 resistance. Intraday bias remains on the downside for the moment for 1044.5 low and below to extend the whole correction from 1227.5. On the upside, above 1108.8 minor resistance will turn intraday bias neutral again. Also, note that break of 1131.5 resistance now should confirm that fall from 1227.5 has completed with three waves down to 1044.5 and should bring retest of this high.

In the bigger picture, outlook remains broadly unchanged. Price actions from 1227.5 are treated as corrections to rise from 931.3 only. Hence, even in case of another fall, downside is expected to be contained by 100% projection of 1227.2 to 1075.2 from 1163 at 1010.7, which is close to 1000 psychological level and bring long term up trend resumption. Decisive break of 1163 resistance will indicate that such correction has already completed and the long term up trend is set to resume for another high above 1227.5.[Written by Oil N' Gold]

"P&F GOLD1440 Box Size30X2 or(7.98%) CLOSE
Data 1215.1 - 288.39 ~ 96 Month ~ 2943 Day
Database 2000 records 1094.73 (Last Close)
2002-02-04 00~00
2010-02-25 00~00 (GMT+01:00) Paris
BJF Trading Group chart"

1200.00|~3OOO|____________________________________X____|1.24%|316.1%
1170.00|~6OOO|____________________________________Xo___|3.71%|305.7%
1140.00|~9OOO|____________________________________XoX__|6.18%|295.3%
1110.00|~12OO|====================================XoXoX|8.65%|284.9%
1080.00|~15OO|____________________________________Xo_oX|11.12%|274.49%
1050.00|~18OO|====================================X==o=|13.59%|264.09%
1020.0|~21OOO|____________________________________X____|16.06%|253.69%
990.00|~24OOO|________________X_____________X_____X____|18.53%|243.29%
960.00|~27OOO|________________Xo__X_________Xo__X_X____|20.99%|232.88%
930.00|~3OOOO|________________XoX_Xo________XoX_XoX____|23.46%|222.48%
900.00|~33OOO|______________X_XoXoXoX_X_____XoXoXo_____|25.93%|212.08%
870.00|~36OOO|______________XoXoXoXoXoXo__X_Xo_oX______|28.4%|201.67%
840.00|~39OOO|______________Xo_o_o_oXoXo__XoX__o_______|30.87%|191.27%
810.00|~42OOO|______________X______oXo_oX_Xo___________|33.34%|180.87%
780.00|~45OOO|______________X______oX__oXoX____________|35.81%|170.47%
750.00|~48OOO|______________X______oX__oXo_____________|38.28%|160.06%
720.00|~51OOO|______________X______o___oX______________|40.75%|149.66%
690.00|~54OOO|________X___X_X__________o_______________|43.21%|139.26%
660.00|~57OOO|________XoX_XoX__________________________|45.68%|128.86%
630.00|~6OOOO|________XoXoXo___________________________|48.15%|118.45%
600.00|~63OOO|________XoXoX____________________________|50.62%|108.05%
570.00|~66OOO|______X_XoXo_____________________________|53.09%|97.65%
540.00|~69OOO|______XoXo_______________________________|55.56%|87.25%
510.00|~72OOO|______Xo_________________________________|58.03%|76.84%
480.00|~75OOO|______X__________________________________|60.5%|66.44%
450.00|~78OOO|____X_X__________________________________|62.97%|56.04%
420.00|~81OOO|__X_XoX__________________________________|65.43%|45.64%
390.00|~84OOO|__XoXo___________________________________|67.9%|35.23%
360.00|~87OOO|X_Xo_____________________________________|70.37%|24.83%
330.00|~9OOOO|XoX______________________________________|72.84%|14.43%
300.00|~93OOO|Xo_______________________________________|75.31%|4.03%
270.00|~96OOO|_________________________________________|77.78%|-6.38%
Column||||||||32423262654342925533486337424264234214232|
Count|||||||||____________________________________O____|
 

Attachments

  • BJF-Trading-Group-Cold0225.jpg
    BJF-Trading-Group-Cold0225.jpg
    341.7 KB · Views: 4
  • bjf-trading-group-gold0225.gif
    bjf-trading-group-gold0225.gif
    51 KB · Views: 4
  • BJF-Trading-Group-Cold0225.zip
    544.5 KB · Views: 0
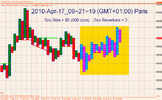
Gold is still bounded in choppy sideway trading below 1170.7 and intraday bias remains neutral. Another fall might be seen but downside should be contained by 38.2% retracement of 1084.8 to 1170.7 at 1137.9 and bring rally resumption. Break of 1170.7 will target 100% projection of 1044.5 to 1145.8 from 1084.8 at 1186 level next.
In the bigger picture, price actions from 1227.5 are treated as correction to rise from 931.3 only, no doubt. The lack of impulsive structure of rise from 1044.5 argues it's possibly part of consolidation from 1227.5, rather than resumption of the long term up trend. Hence upside will likely be limited by 1227.5 high and bring at least one more fall before the consolidation concludes. On the downside, below 1084.8 support will indicate that the third leg of consolidations has started and should then target 1044.5 again.

"P&F GOLD1440 Box Size 30X2 or(7.89%) HI/LO
Data 1226.37 - 295.35 ~ 97 Month ~ 2943 Day
Database 2000 records 1137.11 (Last Close)
2002-03-26 00~00
2010-04-16 00~00 (GMT+01:00) Paris
BJF Trading Group chart"

1230.00|~3O|_______________________________|-0.3%|316.46%
1200.00|~6O|==========================Xo===|2.15%|306.3%
1170.00|~9O|__________________________Xo___|4.6%|296.14%
1140.0|~12O|==========================XoX=X|7.04%|285.98%
1110.0|~15O|__________________________XoXoX|9.49%|275.83%
1080.0|~18O|__________________________Xo_oX|11.94%|265.67%
1050.0|~21O|==========================X==o=|14.38%|255.51%
1020.0|~24O|__________________________X____|16.83%|245.35%
990.00|~27O|____X_________________X___X____|19.27%|235.2%
960.00|~3OO|____Xo__X_____________XoX_X____|21.72%|225.04%
930.00|~33O|____XoX_Xo______X_____XoXoX____|24.17%|214.88%
900.00|~36O|____XoXoXo__X_X_Xo____Xo_oX____|26.61%|204.72%
870.00|~39O|____Xo_o_o__XoXoXo__X_X__o_____|29.06%|194.57%
840.00|~42O|____X____oX_Xo_o_o__XoX________|31.51%|184.41%
810.00|~45O|____X____oXoX____oX_Xo_________|33.95%|174.25%
780.00|~48O|____X____o_oX____oXoX__________|36.4%|164.09%
750.00|~51O|____X______o_____oXo___________|38.84%|153.94%
720.00|~54O|X___X____________oX____________|41.29%|143.78%
690.00|~57O|Xo__X____________o_____________|43.74%|133.62%
660.00|~6OO|XoX_X__________________________|46.18%|123.46%
630.00|~63O|XoXoX__________________________|48.63%|113.31%
600.00|~66O|XoXoX__________________________|51.08%|103.15%
570.00|~69O|Xo_o___________________________|53.52%|92.99%
540.00|~72O|X______________________________|55.97%|82.83%
510.00|~75O|X______________________________|58.41%|72.68%
480.00|~78O|X______________________________|60.86%|62.52%
450.00|~81O|X______________________________|63.31%|52.36%
420.00|~84O|X______________________________|65.75%|42.2%
390.00|~87O|X______________________________|68.2%|32.05%
360.00|~9OO|X______________________________|70.65%|21.89%
330.00|~93O|X______________________________|73.09%|11.73%
300.00|~96O|X______________________________|75.54%|1.57%
270.00|~99O|_______________________________|77.98%|-8.58%
Column||||||1533142236235222384242632315233|
Count|||||||5___4_____________________1____|
 

Attachments

  • BJF-Trading-Group-Gold_0417.pdf
    166.1 KB · Views: 4
  • BJF-Trading-Group-Gold_0417.PNG
    BJF-Trading-Group-Gold_0417.PNG
    210.5 KB · Views: 4
  • bjf-trading-group-gold_0417-2.gif
    bjf-trading-group-gold_0417-2.gif
    28.4 KB · Views: 3
Last edited:
Gold' fall from 1266.5 resumes by taking out 1175.1 and reaches as slow as 1156.9 so far. Short term outlook will now remain bearish as long as 1203.9 resistance holds and we'd expect deeper decline to 1124.3 support next.

"P&F GOLD30 Box Size $6X3 or(1.49%) HI/LO
Data 1265.02 - 1157.88 ~ 2 Month ~ 62.92 Day
Database 2056 records 1161.33 (Last Close)
2010-05-26 16~00
2010-07-28 14~00 (GMT+01:00) Paris
_https://docs.google.com/View?id=dcftkq53_160f5rf86gg#GOLD30
BJF Trading Group MDunleavy chart"

1260.00|~6$||__________________x_+_____________|0.4%|8.82%
1254.00|~12$|__________x_o_x_o___o_+___________|0.87%|8.3%
1248.00|~18$|______x___x_o_x_____o___+_________|1.35%|7.78%
1242.00|~24$|______x_o_x_o_x_____o_____+_______|1.82%|7.27%
1236.00|~3O$|______x_o_x_o_x___+_o_______+_____|2.29%|6.75%
1230.00|~36$|______x_o_x_o___+___o_________+___|2.77%|6.23%
1224.00|~42$|__x___x_o_x___+_____o___________+_|3.24%|5.71%
1218.00|~48$|o_x_o_x_o___+_______o_____________|3.72%|5.19%
1212.00|~54$|o_x_o_x___+_________o_____x_______|4.19%|4.67%
1206.00|~6O$|o___o_x_+___________o_x___x_o_____|4.67%|4.16%
1200.00|~66$|____o_+_____________o_x_o_x_o_x___|5.14%|3.64%
1194.00|~72$|____+_______________o_x_o_x_o_x_o_|5.61%|3.12%
1188.00|~78$|____________________o___o___o_x_o_|6.09%|2.6%
1182.00|~84$|____________________________o_x_o_|6.56%|2.08%
1176.00|~9O$|____________________________o_+_o_|7.04%|1.56%
1170.00|~96$|____________________________+___o_|7.51%|1.05%
1164.0|~1O2$|________________________________oV|7.99%|0.53%
1158.0|~1O8$|________________________________oV|8.46%|0.01%
1152.0|~114$|________________________________+V|8.93%|-0.51%
Column|||||||3_3_4_8_5_6_5_4_1_1_1_3_3_4_6_4_7V|
Count||||||||____________________2____________V|


BJF-Trading-Group-GOLD0728-Mane.PNG
BJF-Trading-Group-GOLD0728-Large.PNG

BJF Trading Group. Excel Chart. Full size attached.
 

Attachments

  • BJF-Trading-Group-GOLD0758.zip
    164.5 KB · Views: 0
I predict bearish trend...
Trade Idea: GOLD - Sell (Stop Limit) at 1356; Target: 1296 ; Stop: 1368.
See the details on the charts.

"P&F GOLD10080 Box Size40X2 or(9.76%) HI/LO
Data 1387.03 - 251.7 ~ 233.81 Month ~ 6874 Day
Database 989 records 1358.95 (Last Close)
1991-12-29 00~00
2010-10-24 00~00 (GMT+01:00) Paris
BJF Trading Group MDunleavy chart"

1400.00|~4O|__________________________________________+_|456.22%
1360.00|~8O|__________________________________________x_|440.33%
1320.0|~120|__________________________________________x_|424.43%
1280.0|~160|______________________________________+___x_|408.54%
1240.0|~2O0|______________________________________x_+_x_|392.65%
1200.0|~240|______________________________x_______x_o_x_|376.76%
1160.0|~280|______________________________x_o_x___x_o___|360.87%
1120.0|~320|______________________________x_o_x_o_x_____|344.97%
1080.0|~360|______________________________x_o___o_______|329.08%
1040.0|~4O0|______________________________x_____________|313.19%
1000.0|~440|______________x___________x___x___________+_|297.30%
960.00|~480|______________x_o_x_______x_o_x_________+___|281.41%
920.00|~520|______________x_o_x_o_x___x_o_x_______+_____|265.51%
880.00|~560|______________x_o___o_x_o_x_o_______+_______|249.62%
840.00|~6O0|______________x_____o_x_o_x_______+_________|233.73%
800.00|~640|______________x_____o_x_o_x_____+___________|217.84%
760.00|~680|______________x_____o___o_x___+_____________|201.95%
720.00|~720|______x_______x_________o___+_______________|186.05%
680.00|~760|______x_o_____x___________+_________________|170.16%
640.00|~8O0|______x_o_x___x_________+___________________|154.27%
600.00|~840|______x_o_x_o_x_______+_____________________|138.38%
560.00|~880|______x_o___o_______+_______________________|122.49%
520.00|~920|______x___________+_________________________|106.60%
480.00|~960|______x_________+___________________________||90.70%
440.0|~1O00|______x_______+_____________________________||74.81%
400.0|~1O40|__x___x_____+_______________________________||58.92%
360.0|~1O80|__x_o_x___+_________________________________||43.03%
320.0|~1120|____o_x_+___________________________________||27.14%
280.0|~1160|____o_+_____________________________________||11.24%
240.0|~1200|____+_______________________________________||-4.65%
Column|~||||O_2_3_1_4_2_2_1_3_2_5_4_5_7_3_8_3_2_2_4_2_5_|
Count|~|||||______1_______1_____________________________|

10oct312031.png
10oct312033.png


BJF Trading Group. Excel Chart. Full size attached.
 

Attachments

  • 10Oct312305.pdf
    72.9 KB · Views: 0
Back
Top