howtoreadchart
Recruit
- Messages
- 0
Hello, I am Oleg Alexandrov, Market Analyst and Chart Reader. In this thread, I will share my approach to Read the Charts as a book.
What is Chart Reading
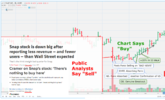
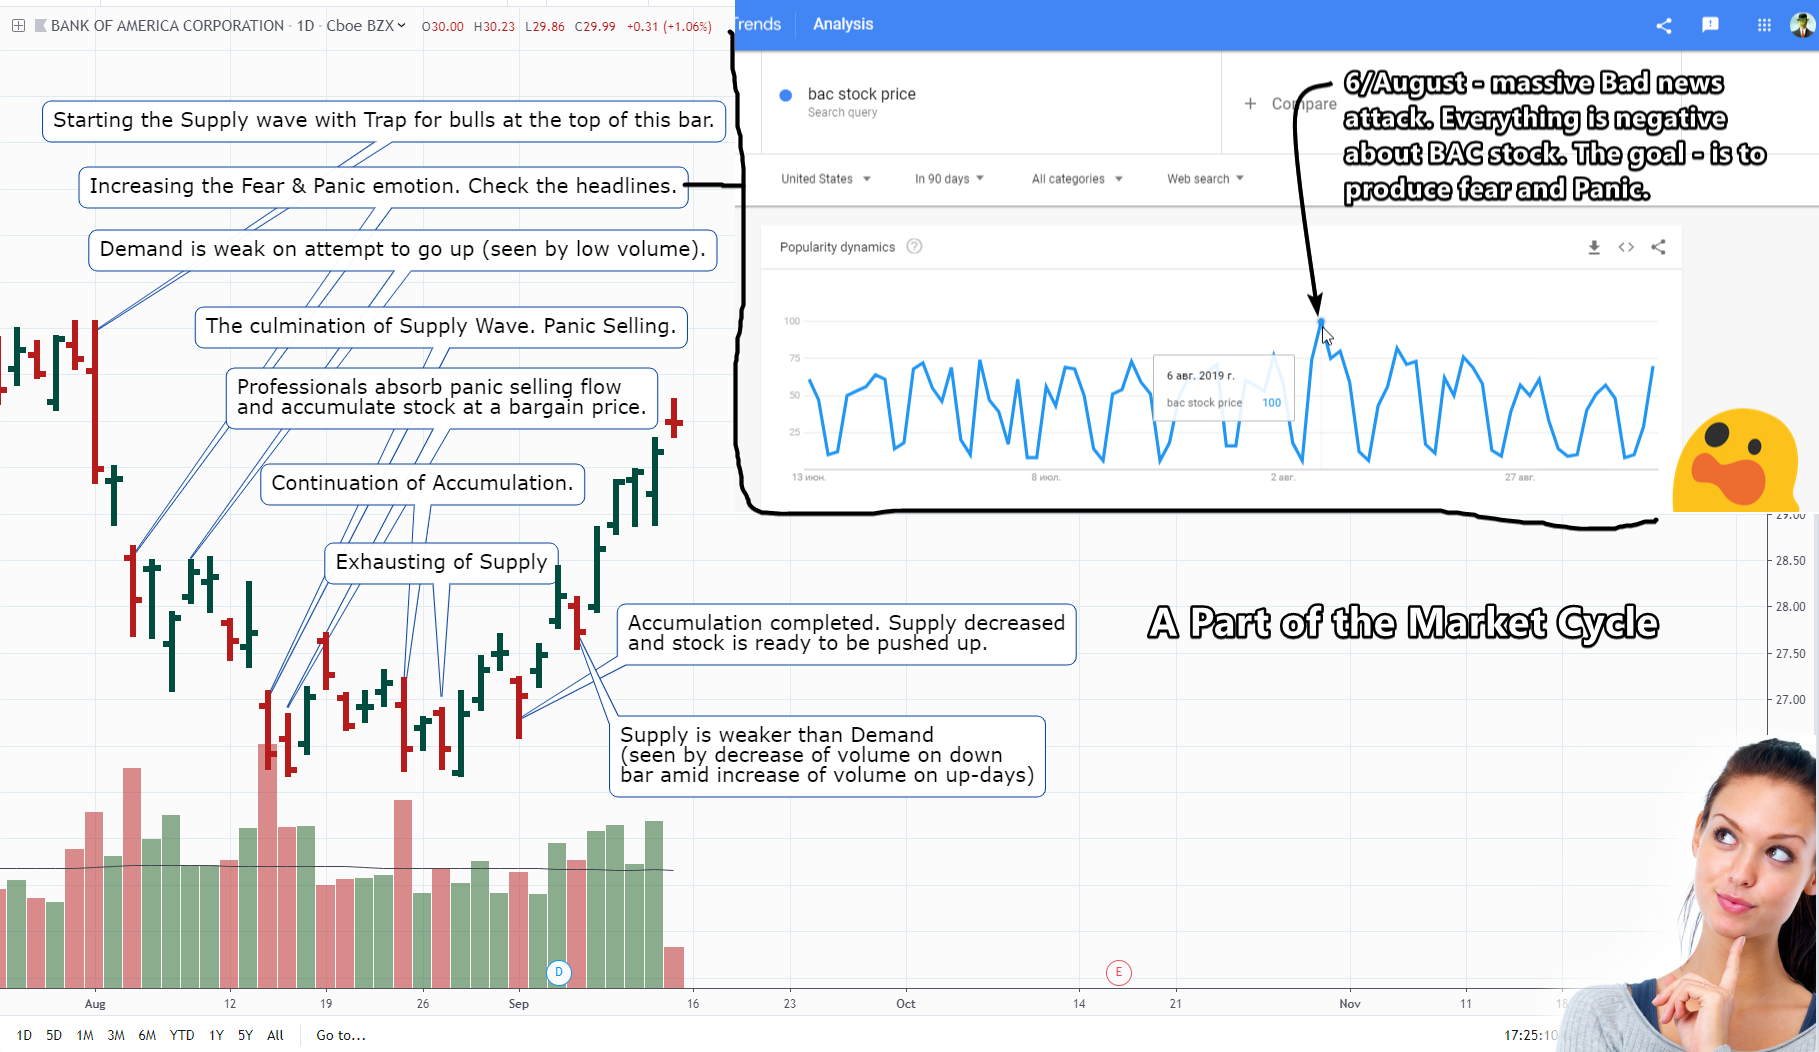
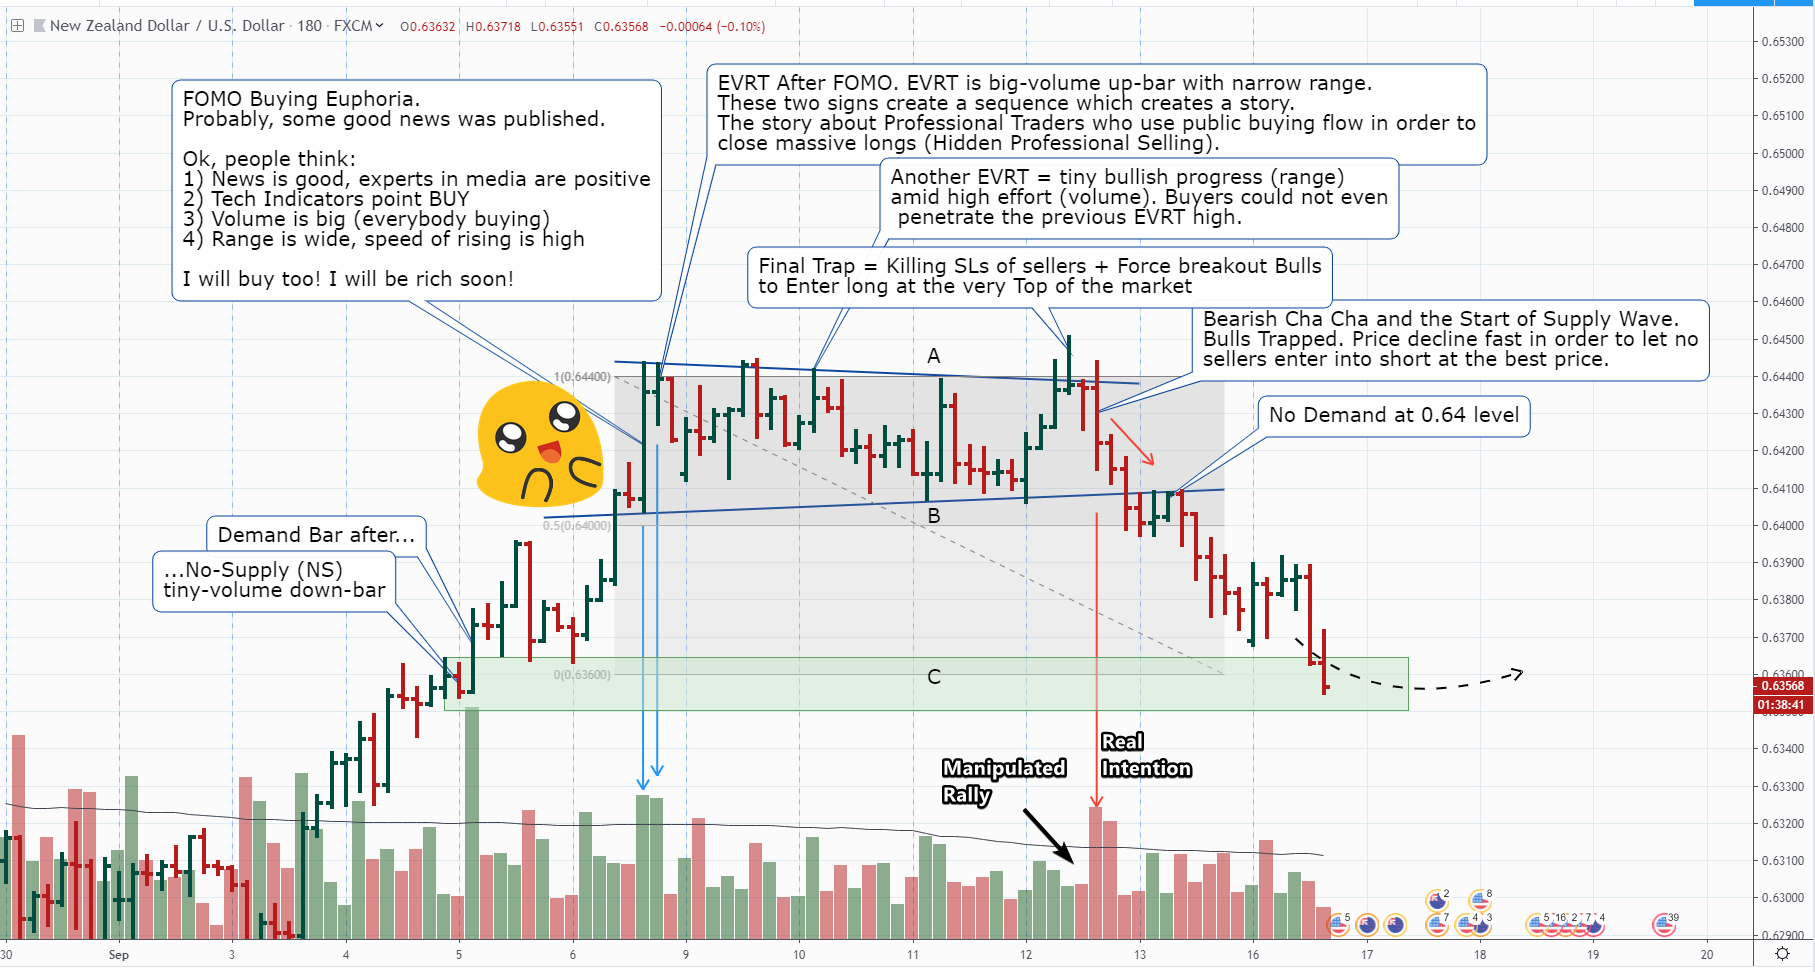
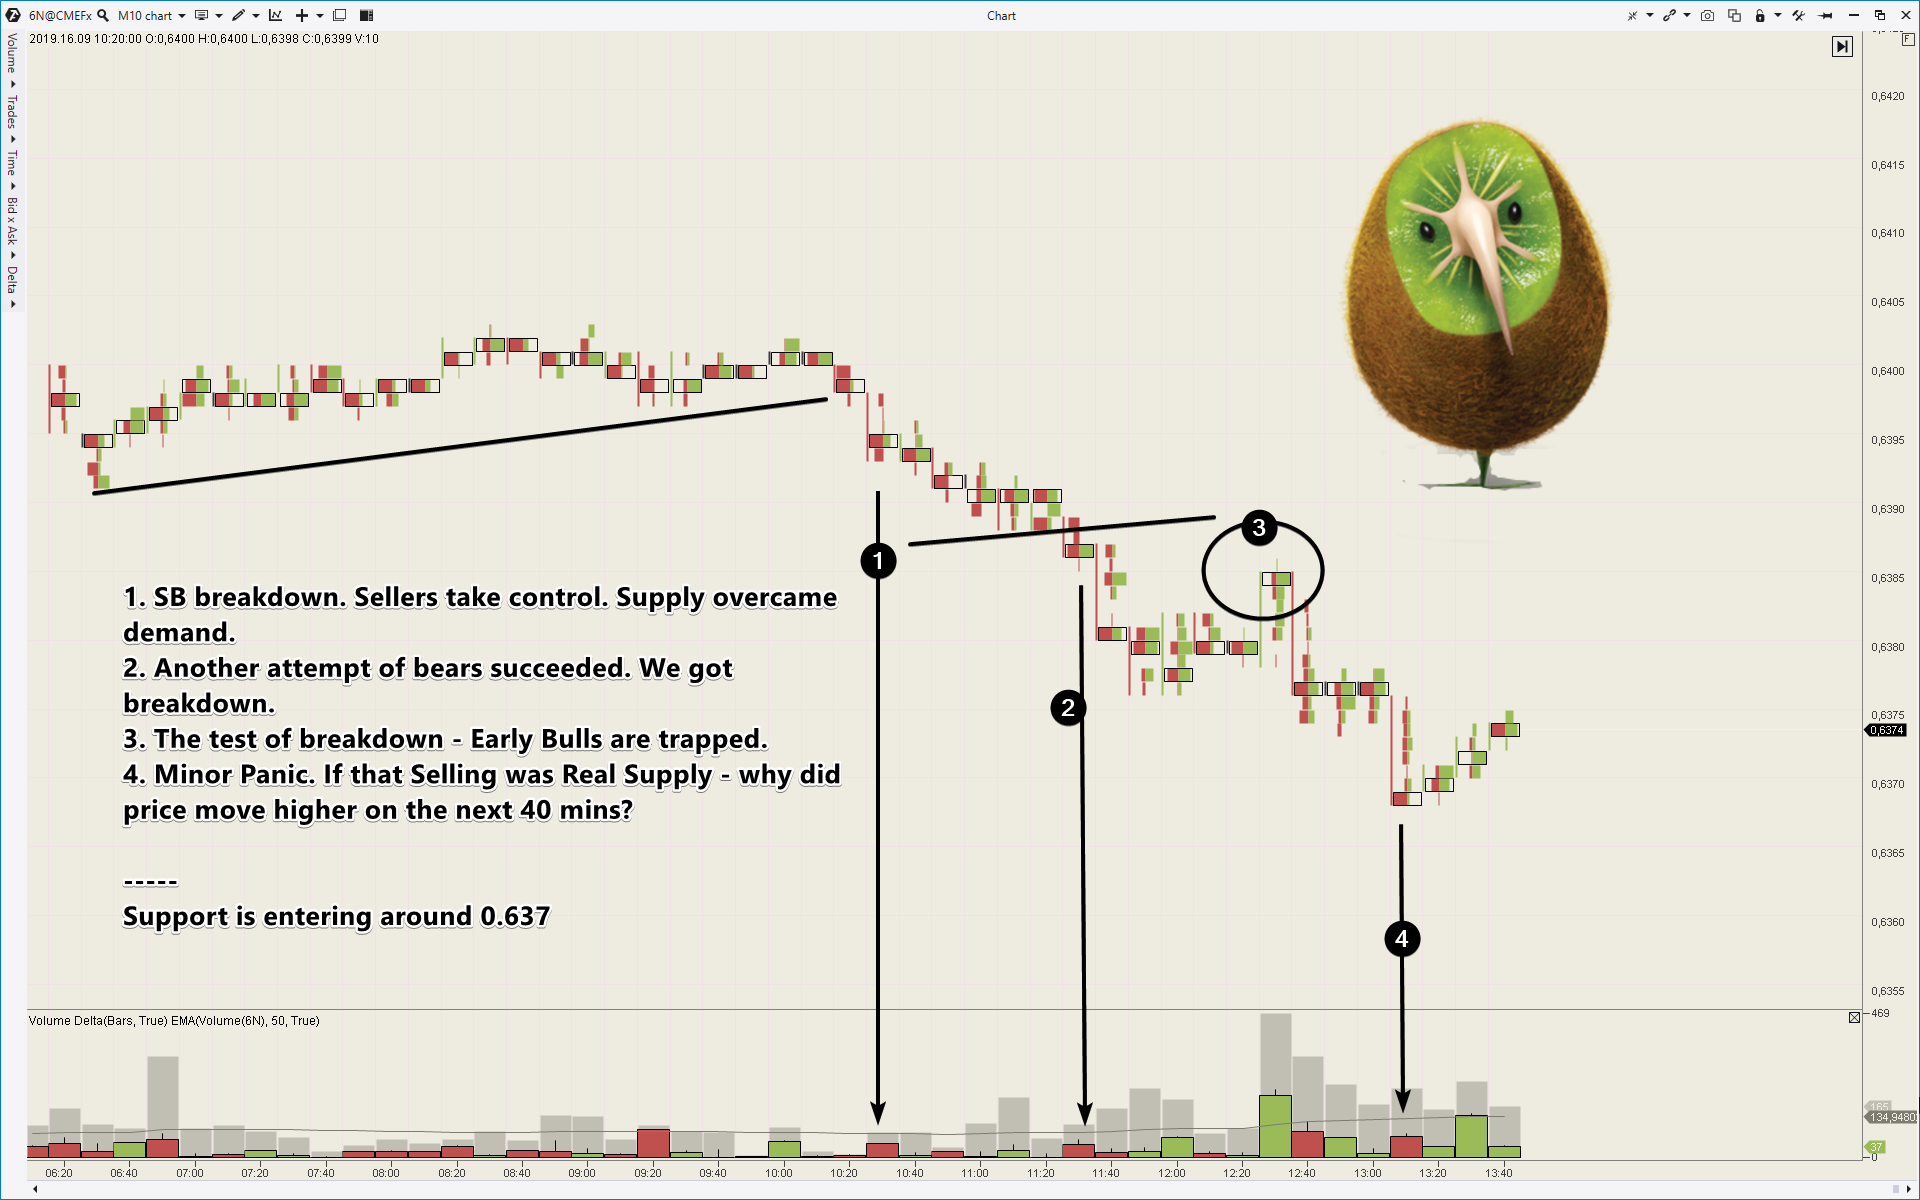
This is reading the Story of the neverending battle between buyers and sellers. By analyzing price & volume relationship, Chart Reader extracts the latest data of balance between Demand and Supply. Thus, he becomes capable to understand the Current Character of the market. Playing in harmony with the Market Character - this is the way to decrease risk and increase profits.
Warning. The main goal of the Market is to make as many fools as possible. Bernard Baruch.
Thanks for your interest. Now let's go to the practice of Chart Reading. Chart Never Lies.
What is Chart Reading
This is reading the Story of the neverending battle between buyers and sellers. By analyzing price & volume relationship, Chart Reader extracts the latest data of balance between Demand and Supply. Thus, he becomes capable to understand the Current Character of the market. Playing in harmony with the Market Character - this is the way to decrease risk and increase profits.
Warning. The main goal of the Market is to make as many fools as possible. Bernard Baruch.
Thanks for your interest. Now let's go to the practice of Chart Reading. Chart Never Lies.