howtoreadchart
Recruit
- Messages
- 0
#Gold Overview. Mixed Data from 3 Sources.
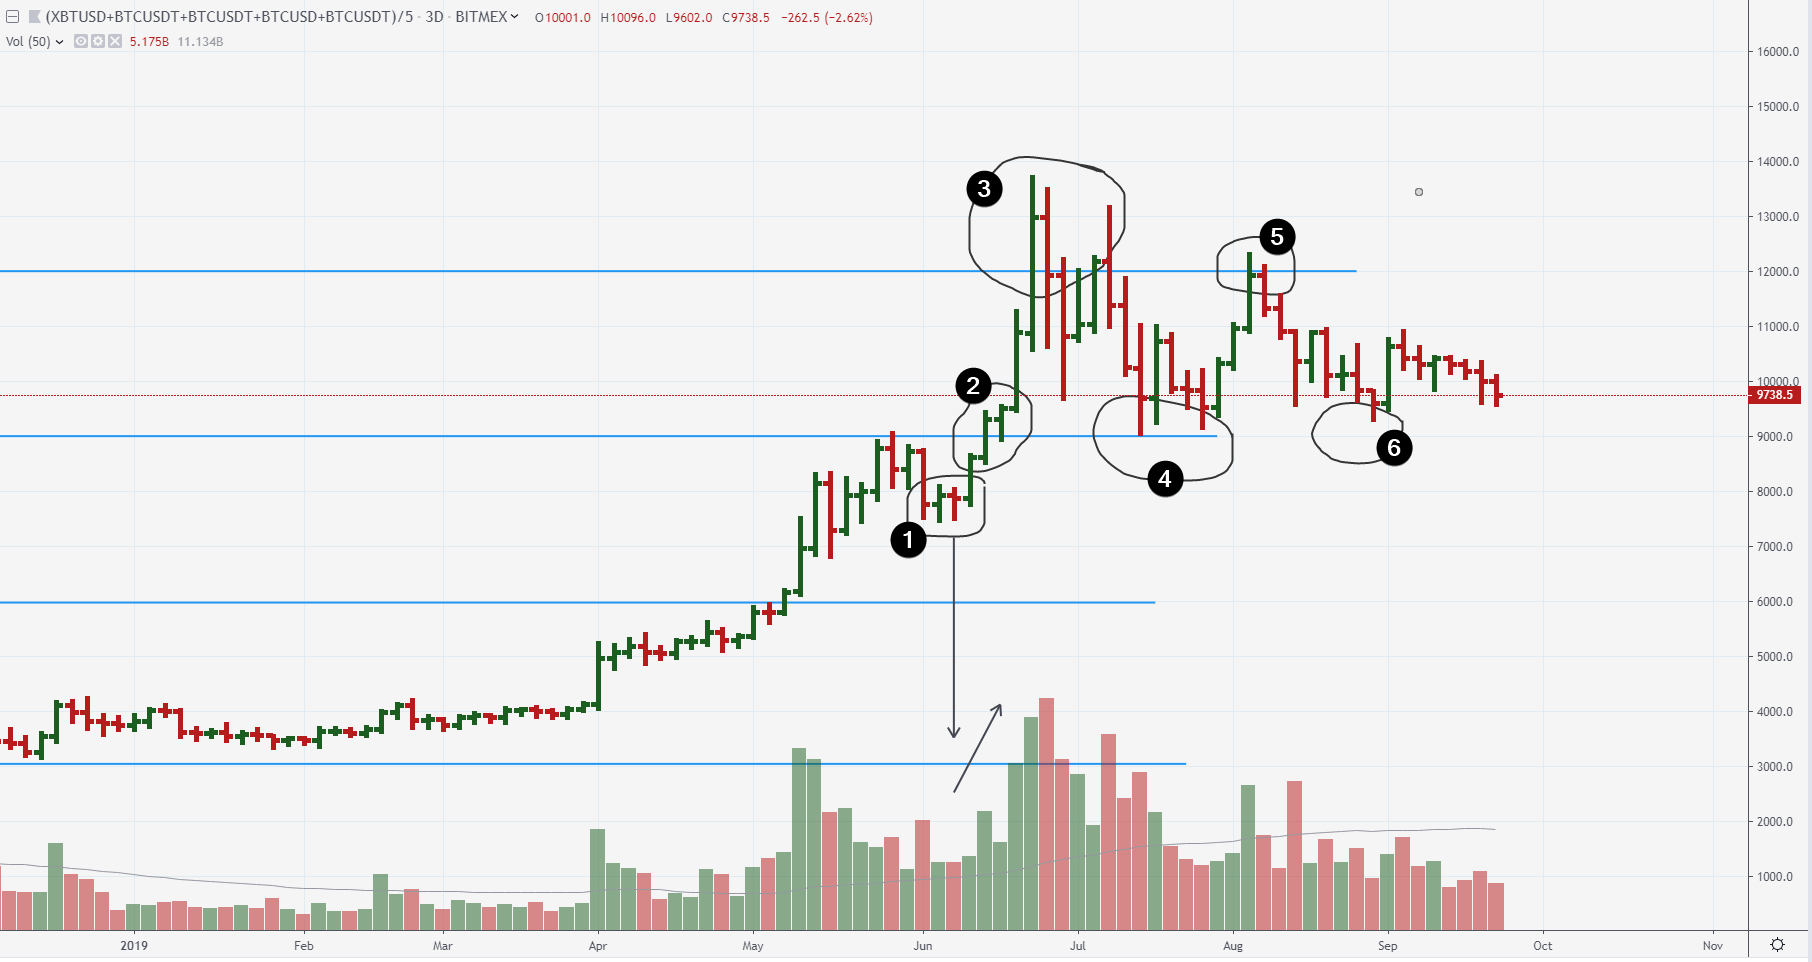
Fake (or False) breakout is one of the most tricky things in trading. This is how the market (professional side) make fools (losses for retail traders). The number of Fake Breakouts increase at the psycho levels (round numbers). Look at 1550 blue line. We had very clear breakout divided into 2 parts:
1) Evening of 04 Sept (Blue arrow). Everything looks bullish, but look at the response
2) Red Arrows point at price falling amid an increase in volume. This is a genuine Supply activity after Non-professional bulls were trapped above 1550. (Check the history - you will find Minor Trap Up-moves before Major Break Down in the 90% of cases, even on news events).
On the following days we got Stop-Loss-Killing above 1525 level (circled) and the test of center line of the upward channel.
Well, what is next? Actually, market is quite balanced. We have support from bottom line of up-trend channel with Demand Surge (green line) on the background. But if the bulls are really strong, we should see some sort of quick bounce from the line of support. Instead, price is chilling around 1500.
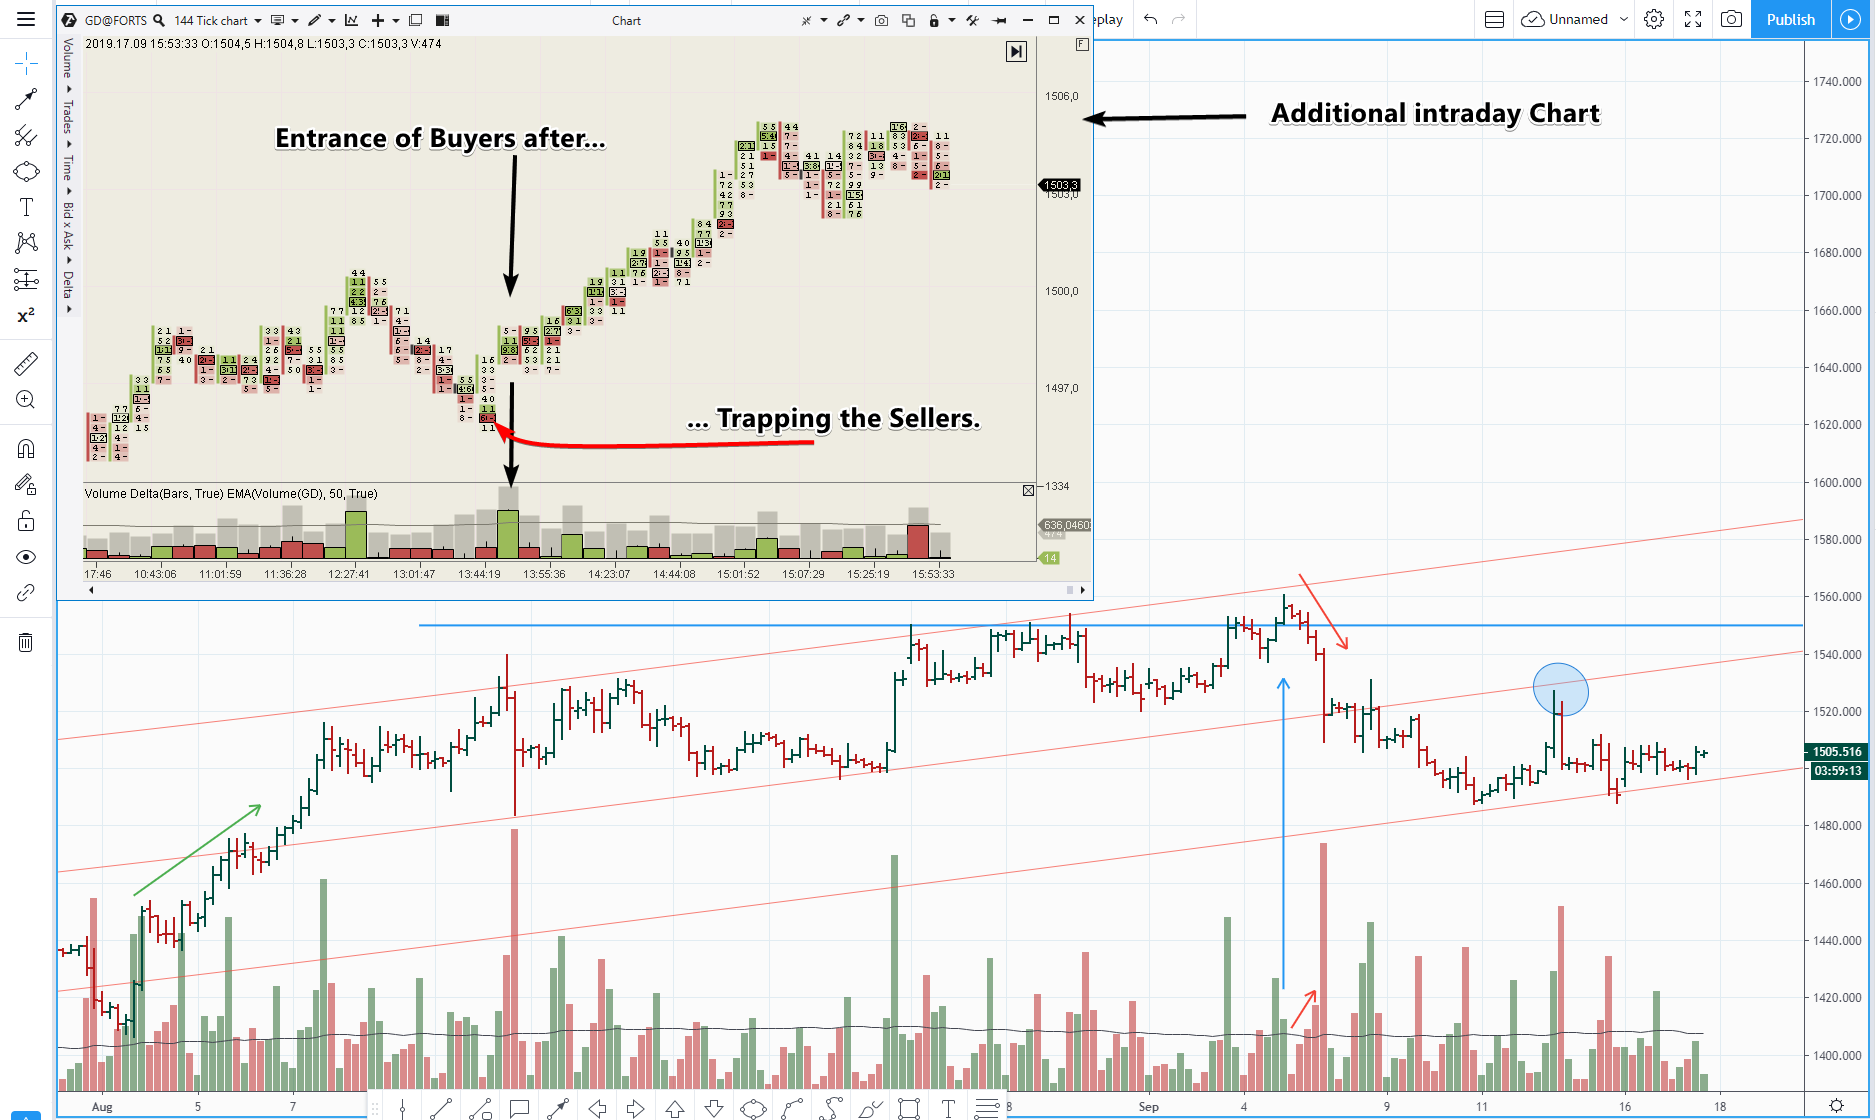
Intraday clusters (see additional chart) show the attempt of bulls to drive price up (after Trap for bears). But this bullish attempt can be quickly exhausted with mentioned signs of weakness above 1520. So, short-term outlook is neutral.
https://i.imgur.com/wKybzAB.png
Fake (or False) breakout is one of the most tricky things in trading. This is how the market (professional side) make fools (losses for retail traders). The number of Fake Breakouts increase at the psycho levels (round numbers). Look at 1550 blue line. We had very clear breakout divided into 2 parts:
1) Evening of 04 Sept (Blue arrow). Everything looks bullish, but look at the response
2) Red Arrows point at price falling amid an increase in volume. This is a genuine Supply activity after Non-professional bulls were trapped above 1550. (Check the history - you will find Minor Trap Up-moves before Major Break Down in the 90% of cases, even on news events).
On the following days we got Stop-Loss-Killing above 1525 level (circled) and the test of center line of the upward channel.
Well, what is next? Actually, market is quite balanced. We have support from bottom line of up-trend channel with Demand Surge (green line) on the background. But if the bulls are really strong, we should see some sort of quick bounce from the line of support. Instead, price is chilling around 1500.
Intraday clusters (see additional chart) show the attempt of bulls to drive price up (after Trap for bears). But this bullish attempt can be quickly exhausted with mentioned signs of weakness above 1520. So, short-term outlook is neutral.
https://i.imgur.com/wKybzAB.png