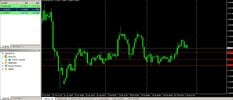
hi I am confuse when I trying to practice with chart on historical data like put lines support resistance trends and channels for example on 4h chart and then check bigger time frame and here start my confusing because i see many candles from the future which I don t want to see yet. I dont know how to manage with it? Do you have some ways or your own way how to avoid this confusion?
You are using an out of date browser. It may not display this or other websites correctly.
You should upgrade or use an alternative browser.
You should upgrade or use an alternative browser.
how you do analysis?
- Thread starter PatrykM
- Start date
iMusingKiMi
Sergeant
- Messages
- 896
hi I am confuse when I trying to practice with chart on historical data like put lines support resistance trends and channels for example on 4h chart and then check bigger time frame and here start my confusing because i see many candles from the future which I don t want to see yet. I dont know how to manage with it? Do you have some ways or your own way how to avoid this confusion?
I believe you are trying to practice on fractal trading. If you trade for everyday for instance that I used to trade London Session 0800 - 1800, you should go for 4H Support and Resistance and go lower to 30 mins and hourly time frame instead of larger time frame. For channel, draw it on lower time frame instead of 4H, because for session trader to draw channel on 4H, you are too late to understand the context. Many people tell you they trade as per price action, but they use large time frame. Price Action is to defined a trader to trade on immediate price movement on the market, not hourly or 4H movement. Larger than 4H is more suitable for Swing Trader.
thanks for reply  but already I do not trade only practice with lines (I am reading Sive forex course,already im finish lines and start candlesticks) and I want to learn step by step. To be honest I didn t know what is fractal trading when I read your message I checked something about it.
hi I am confuse when I trying to practice with chart on historical data like put lines support resistance trends and channels for example on 4h chart and then check bigger time frame and here start my confusing because i see many candles from the future which I don t want to see yet. I dont know how to manage with it? Do you have some ways or your own way how to avoid this confusion?
basic knowledge of candle formation would reduce these confusion. using different time frame are sometimes give another different analysis, but make sure you move from bigger to lower time frame, dont do the opposite ways.
some traders has an issue with candle color, it may silly thought, but it worth a try, wipe out those candle color.

I bet your confusion should reduce while watch such single color candlestick.
or simply use line chart while drawing trendline especially at higher TF.
stephane
Private, 1st Class
- Messages
- 114
hi I am confuse when I trying to practice with chart on historical data like put lines support resistance trends and channels for example on 4h chart and then check bigger time frame and here start my confusing because i see many candles from the future which I don t want to see yet. I dont know how to manage with it? Do you have some ways or your own way how to avoid this confusion?
Do it the other way around. Start analyzing bigger times frames, place your S/R, channels whatever, then on another chart do the same with a smaller
TF. And again and again. Analyze the three TFs that are just above your trading TFs, then look at all of them and try to guess what levels are really important, and even more important, what is taking place with that paire " trending ? Bouncing? Ranging? From where to where?". then define your trading plan (if I see this, I enter short, it is valid as long as we are under/above that level, but on the other side if I see this I enter long, valid etc etc ...). there are times when you will want to take only shorts or only longs.
I look at daily time frame, wait for any candle stick pattern that I use to get signal from, then I trade them using proper money management.
I do pretty much the same but I use the four-hour chart and candlesticks too.
Similar threads
- Replies
- 0
- Views
- 1K
- Replies
- 5
- Views
- 670
New Forex Stuff
Trade The Forex Master Pattern Method
- Replies
- 1
- Views
- 18K
- Replies
- 11
- Views
- 295
- Replies
- 11
- Views
- 258