Sive Morten
Special Consultant to the FPA
- Messages
- 18,654
Attention. My analysis is based on JPY/USD, not on usual USD/JPY. It means that
My chart is reverse to yours . My support is your resistance and so on.
To receive numbers and levels in common formation, you need to use the formula:
1/MY QUOTE*10000
Example. My level of resistance 118.42
Usual level of support= 1/118.42*10 000 = 84.44
My chart is reverse to yours . My support is your resistance and so on.
To receive numbers and levels in common formation, you need to use the formula:
1/MY QUOTE*10000
Example. My level of resistance 118.42
Usual level of support= 1/118.42*10 000 = 84.44
Monthly
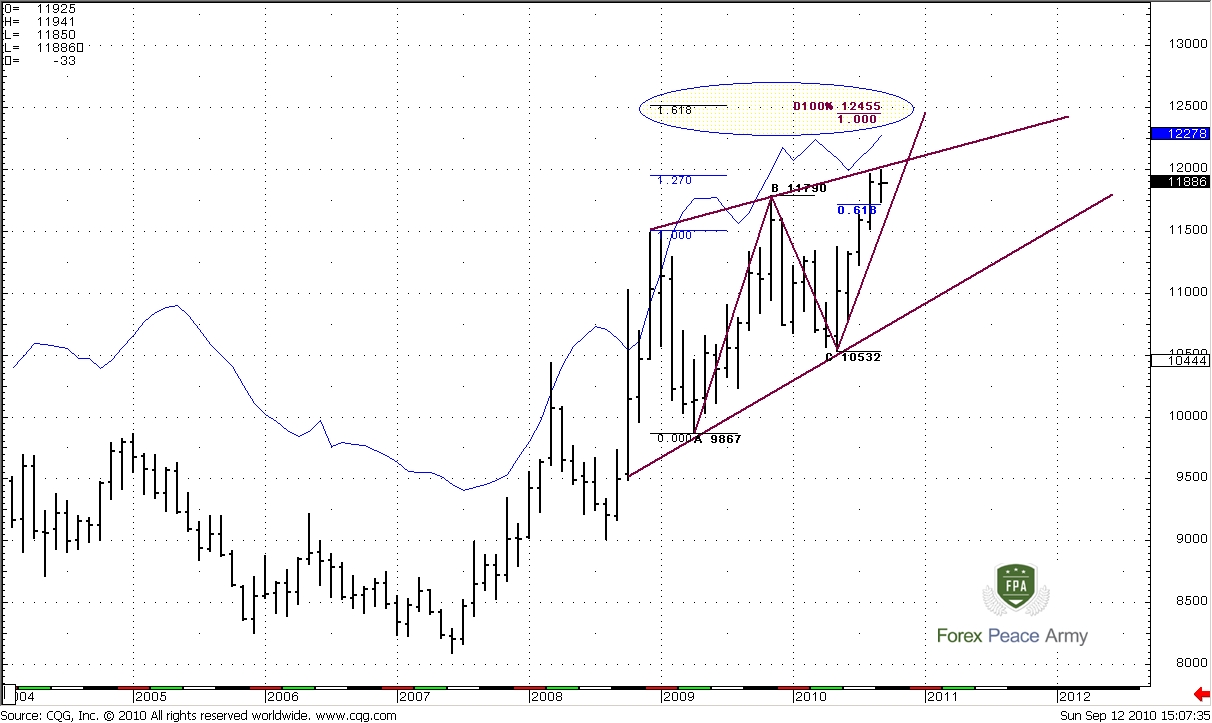
On monthly chart trend is bullish (your trend, guys is bearish rather). Price moves to the upside gradually. Market shows very good AB-CD pattern with target around 124.55 (your quote, guys will be 1/124.55*10000 = 80.28). Market has passed through 0.618 expansion, and move above it. The speed of AB and CD leg is the same, so this AB-CD move is very harmonic, that can lead to some resistance at 124.55 area. Also there is some divergence with MACD indicator, but you know my attitude to this signal. Also – 122.78 is a monthly overbought area that is precisely at the target of AB-CD pattern.
At the same time, market is forming bearish wedge pattern and now has reached some resistance – the upper border of the wedge, 1.27 expansion from one of the retracements lower and, that is most important deep 0.88 Fib resistance from the previous high around 126 area. So, market should stay above 117.20 (0.618 expansion of ABC-bottom pattern) for possibility of moving to 124.5 stays intact. If market will retrace lower from current resistance, then, probably, we can reach the lower border of the wedge.
Weekly
On the weekly time frame market shows nice up thrust, good separation from green line (3x3 DMA), trend is bullish. If market will show some pullback – 115.20-115.30 is a strong area of Fib Confluence support. Also, as you can see, the red line of MACD Predictor shows that trend remains bullish until 114.73 that is just below this area. So, personally, I think that this is good level for possible start of upward momentum trade. Although it’s impossible to say now, when it can start – after possible move to upside (due to monthly analysis) or already during the next week, because market has reached resistance.
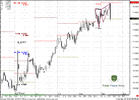
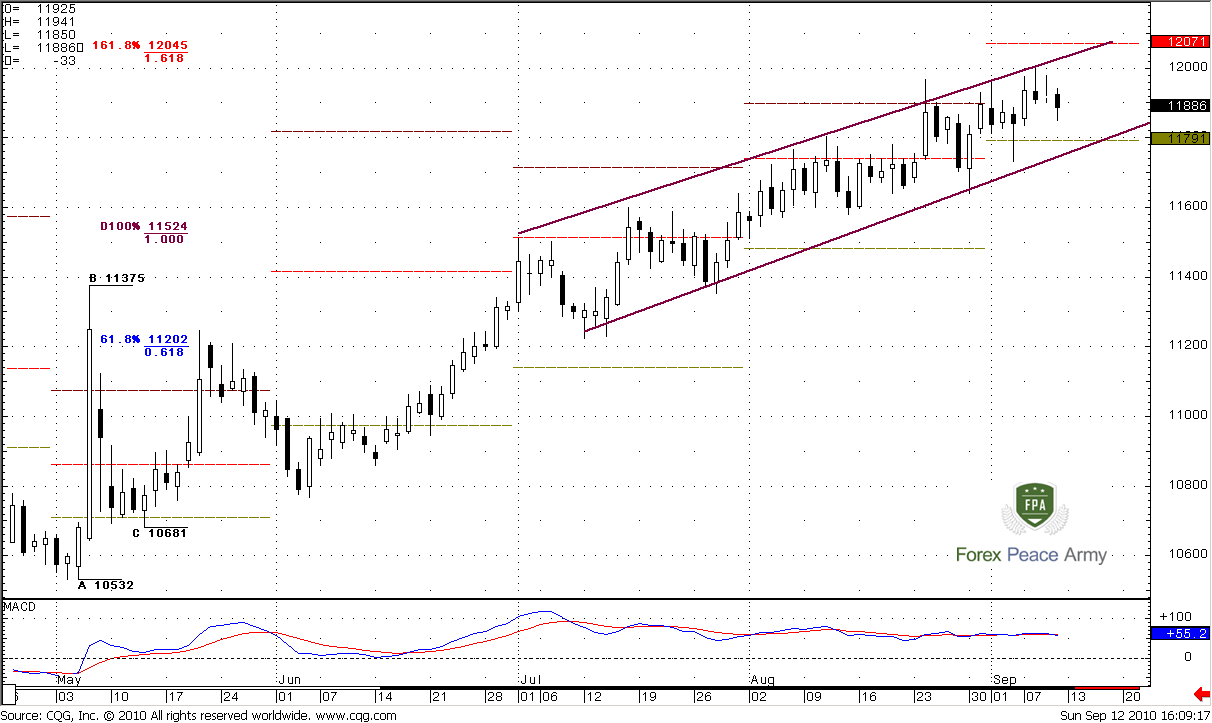
Daily
There is couple of interesting moments here. First of all, market gradually moves higher since July. I suppose that everybody sees bearish divergence with MACD and bearish wedge that is forming inside this channel. In spite of this market continues its move to upside. And this makes me think that market should reach 1.618 expansion and monthly pivot resistance 1 and strong resistance just above the market around 120.50-120.70 area. Also take a note, how market moves between monthly pivot point and pivot resistance 1. I do not exclude some retracement lower, but I expect that market should reach 120.50 area.
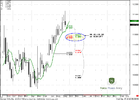
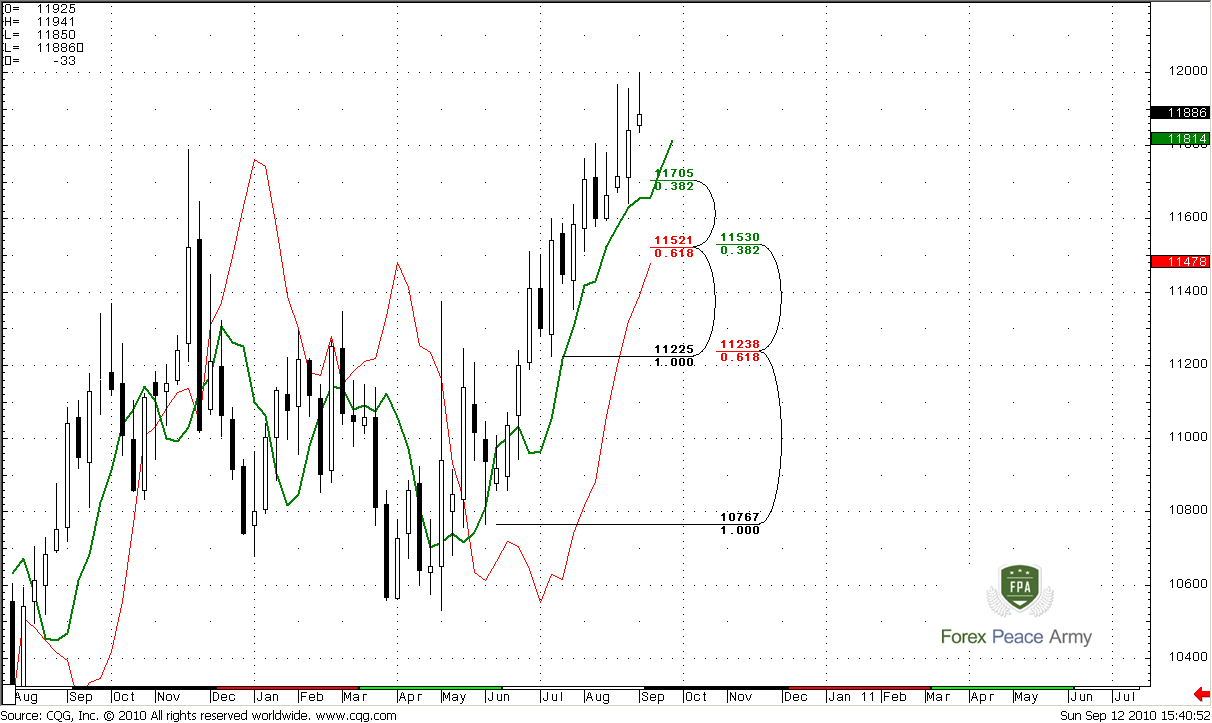
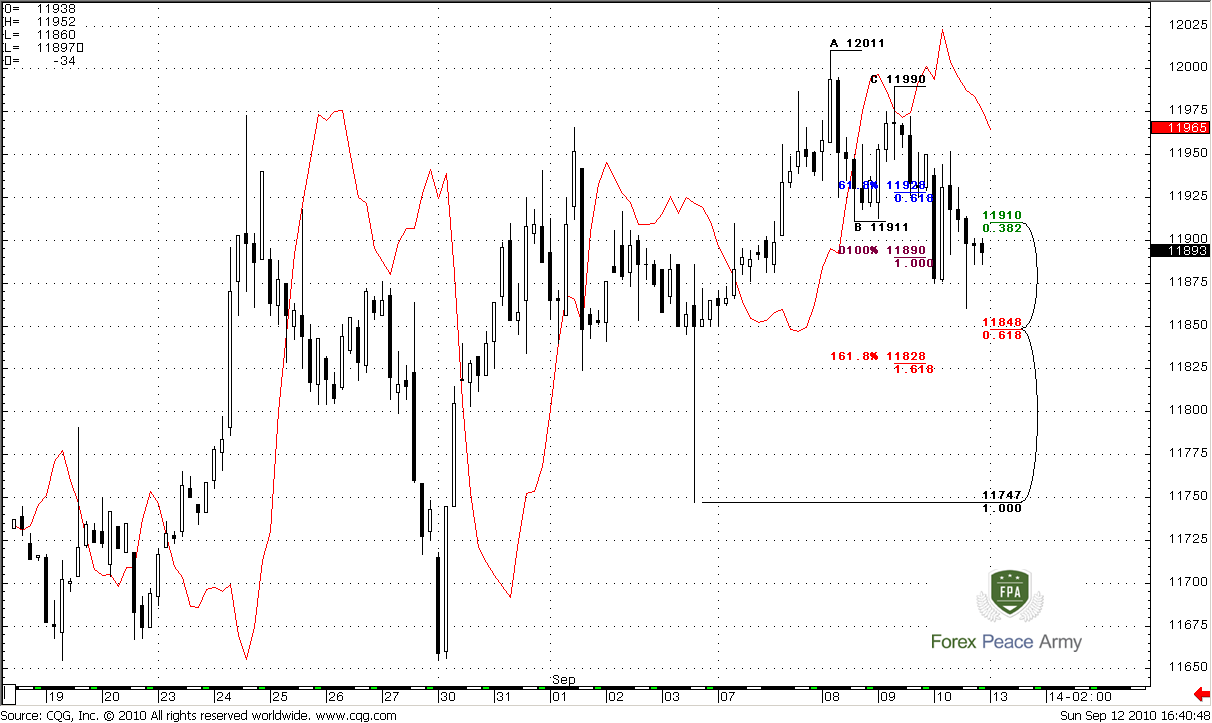
4- Hour
Although I’ve expected that market can reach 120.50 area during previous week due butterfly pattern, market has not quite reached it and started retracement lower. At the same time, looks like market is moving in price channel as “2 steps forward 1 step back”, and makes deep 0.618 retracements. 4-hour trend is bearish now, market has reached 100% expansion from ABC-top pattern, retraced, and continued move to the downside. 161.8% expansion is very close to 5/8 Fib support, that makes an Agreement at 118.28-118.48. If we will follow the logic of previous moving in price channel, another leg up should start from this area.
First of all, there is obvious that high rate of Yen presses on the market participants, because of possibility of intervention. Due to this market shows very blur price action. There are two interesting moments right now. On the monthly chart we should track the wedge price action. If market will turn to the down side - then we can see the excellent possibility for upward weekly momentum trade.
At the same time, on shorter time frame, we should watch fro 118.20-118.50 area. If market will hold there, then, probably, market will continue it’s up move inside the channel and should reach 120.50 level.
The technical portion of Sive's analysis owes a great deal to Joe DiNapoli's methods, and uses a number of Joe's proprietary indicators. Please note that Sive's analysis is his own view of the market and is not endorsed by Joe DiNapoli or any related companies.
")