Sive Morten
Special Consultant to the FPA
- Messages
- 18,621
Attention. My analysis is based on JPY/USD, not on usual USD/JPY. It means that
My chart is reverse to yours . My support is your resistance and so on.
To receive numbers and levels in common formation, you need to use the formula:
1/MY QUOTE*10000
Example. My level of resistance 118.42
Usual level of support= 1/118.42*10 000 = 84.44
My chart is reverse to yours . My support is your resistance and so on.
To receive numbers and levels in common formation, you need to use the formula:
1/MY QUOTE*10000
Example. My level of resistance 118.42
Usual level of support= 1/118.42*10 000 = 84.44
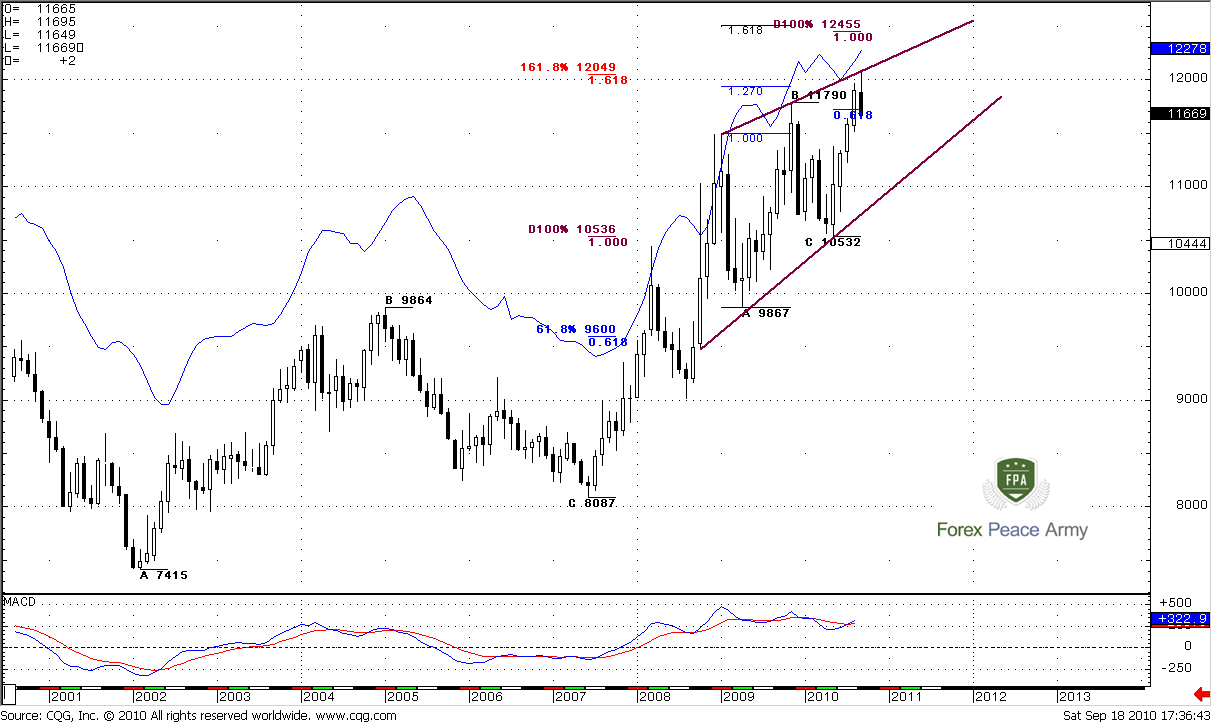
Monthly
Monthly time frame does not tell us much. Market continues its move in the wedge. On monthly chart trend is bullish (your trend, guys is bearish rather). Price moves to the upside gradually. Market shows very good AB-CD pattern with target around 124.55 (your quote, guys will be 1/124.55*10000 = 80.28) and has reached 0.618 expansion target before intervention of BoJ. From the other side we should note that just before this recent pattern, there was the same kind of pattern that ended with just 0.618 target (the previous high inside the wedge), so I’m not sure that market will reach 124.55 area, especially if BoJ will continue its pressure on Yen rate.
As I’ve said, market is forming bearish wedge pattern and now has reached some resistance – the upper border of the wedge, 1.27 expansion from one of the retracements lower and, that is most important deep 0.88 Fib resistance from the previous high around 126 area. Also market has reached 1.618 target from one of the ABC-bottom patterns. And now I incline to down move in the wedge rather then upper break out of it. Besides, market should not show deep retracement after reaching .0618 expansion if it intends to reach 124.55 but market already shows some signs of weakness.
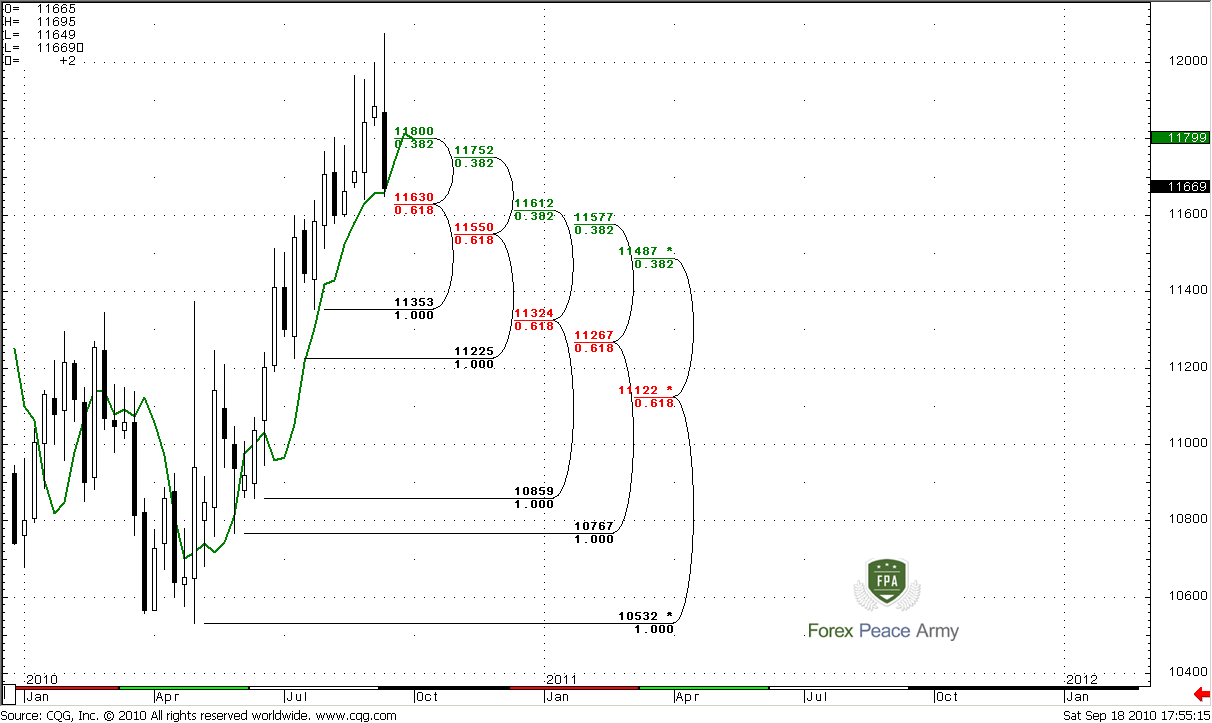
Weekly
The most interesting situation right now is on this time frame. As you can see later (on daily chart), market has reached strong resistance area and shows down thrust, that was enforced by intervention. On the weekly time frame market shows nice up thrust, good separation from green line (3x3 DMA), trend is bullish, but this is not big deal in our context. So, we have excellent context for momentum or DiNapoli B&B trade. First of all we have to see 1-3 closes below weekly 3x3 DMA. And I suspect, that if this up move will start at all, it will start either from 115.70-115.77 area, or from major 3/8 Fib support - 114.87. Anyway, on a lower time frame we will be able to track price action – may be we will see some AB-CD pattern, that will make an Agreement with one or another Fib support, or something that will help us to estimate level with more precision. But the context on weekly time frame is nice.
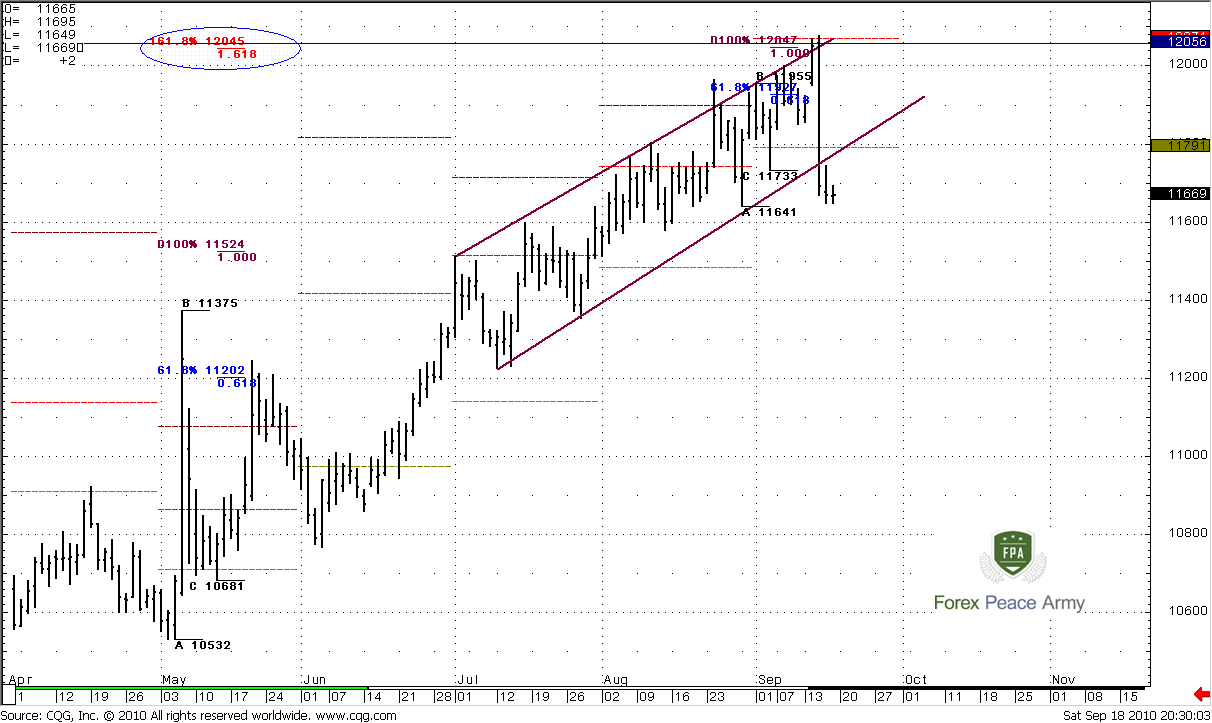
Daily
Daily time frame makes weekly context even stronger. Market has reached 1.618 expansion from ABC-bottom pattern, completed recent AB-CD “Sell” and our 1.27 Butterfly “Sell” pattern at 1.2956 area. Additional resistance has come from monthly pivot resistance 1. Due to intervention market just collapsed and broke channel to the downside. Personally, I think, that sell a retracement of this huge bar is a bad idea… We can count on some retracement to the upside, because of previous move up was solid and long-term. Let’s look at the lower time frame to estimate possible levels that suitable for enter short.
4- Hour
I think that here you can estimate good level by yourself. If you will not be able to do this – read my comments below the chart
")
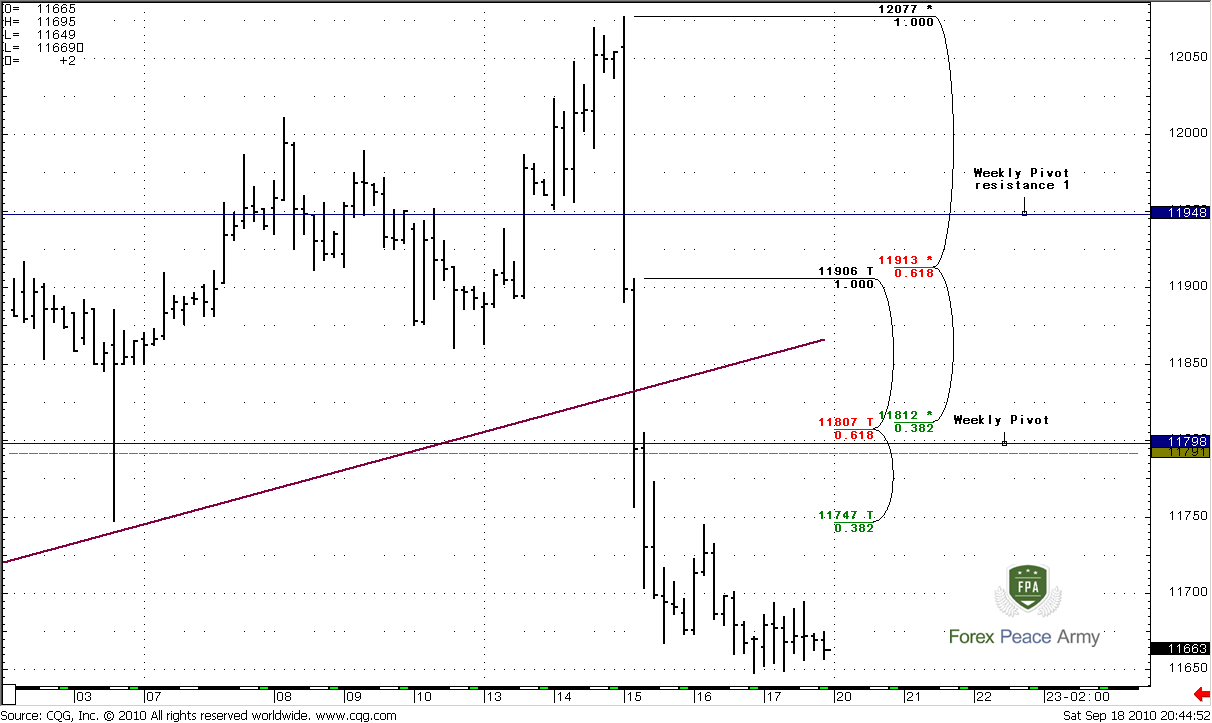
Ok, obviously that I like 118.07-118.12 area. It includes Confluence resistance, monthly pivot, weekly pivot and border of daily channel. Besides, this down move was really strong, so I do not expect that retracement should be deep. It can be even shallower – till first 117.47 resistance level. Anyway, look for some AB-CD moves that will end at one of these levels. 119.13-119.48 also strong resistance – combination of Fib resistance and weekly pivot resistance 1. But this will not be good sign to move there, because in this case market will return in the channel, and I do not expect it now.
Yen gives us nice possibilities for trading. If you are a position trader – wait downward move on weekly chart till the levels that we’ve talked about, then you can establish Long position. Also I do not see any problem in joining with strong down move. I think that we can enter short from 118.07-118.12 area with target of possible weekly support. I hope you understand how daily “Short” trade combines with possible weekly “Buy” trade. There is no contradiction here.
The technical portion of Sive's analysis owes a great deal to Joe DiNapoli's methods, and uses a number of Joe's proprietary indicators. Please note that Sive's analysis is his own view of the market and is not endorsed by Joe DiNapoli or any related companies.