Sive Morten
Special Consultant to the FPA
- Messages
- 18,644
Attention. My analysis is based on JPY/USD, not on usual USD/JPY. It means that
My chart is reverse to yours . My support is your resistance and so on.
To receive numbers and levels in common formation, you need to use the formula:
1/MY QUOTE*10000
Example. My level of resistance 118.42
Usual level of support= 1/118.42*10 000 = 84.44
My chart is reverse to yours . My support is your resistance and so on.
To receive numbers and levels in common formation, you need to use the formula:
1/MY QUOTE*10000
Example. My level of resistance 118.42
Usual level of support= 1/118.42*10 000 = 84.44
Monthly
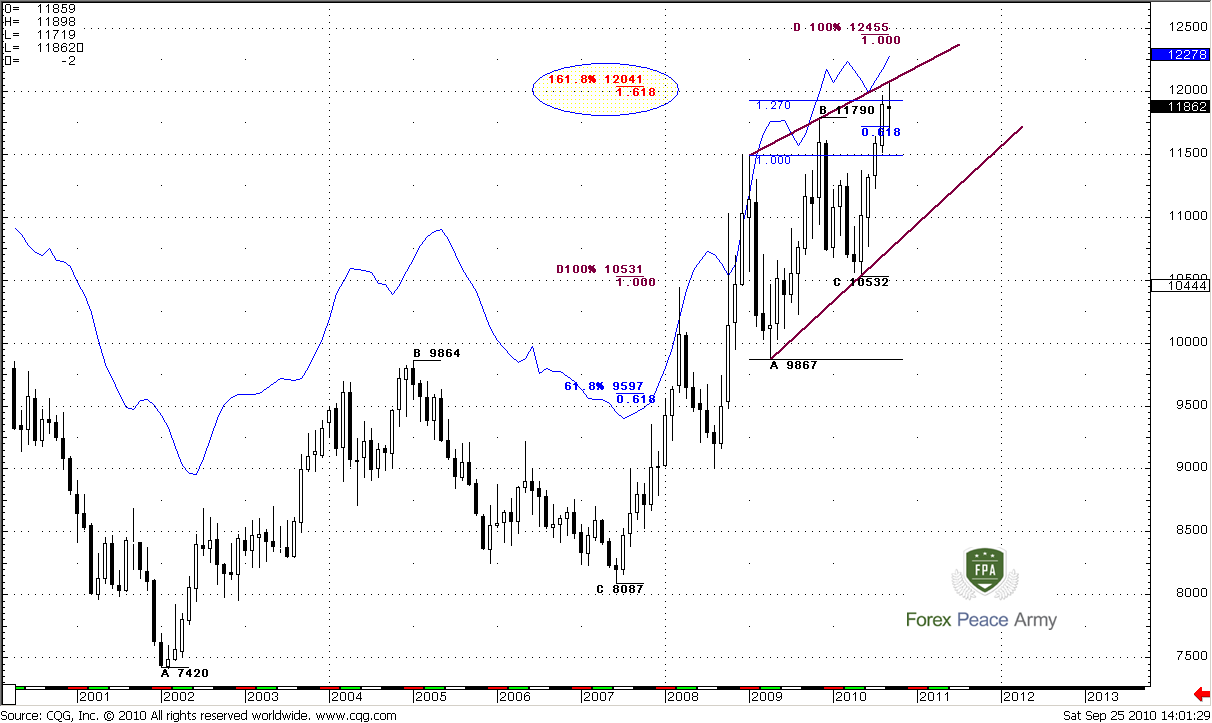
Monthly time frame does not tell us much. Market continues its move in the wedge. On monthly chart trend is bullish (your trend, guys is bearish rather). Price moves to the upside gradually. Market shows very good AB-CD pattern with target around 124.55 (your quote, guys will be 1/124.55*10000 = 80.28) and has reached 0.618 expansion target before intervention of BoJ. From the other side we should note that just before this recent pattern, there was the same kind of pattern that ended with just 0.618 target (the previous high inside the wedge), so I’m not sure that market will reach 124.55 area, especially if BoJ will continue its pressure on Yen rate. But currently make a note, how market recovers after intervention.
As I’ve said, market is forming bearish wedge pattern and now has reached some resistance – the upper border of the wedge, 1.27 expansion from one of the retracements lower and, that is most important deep 0.88 Fib resistance from the previous high around 126 area. Also market has reached 1.618 target from one of the ABC-bottom patterns. For the time being, market stays above 0.618 expansion target, and if it still intends to reach 124.55, it should not show deep retracement.
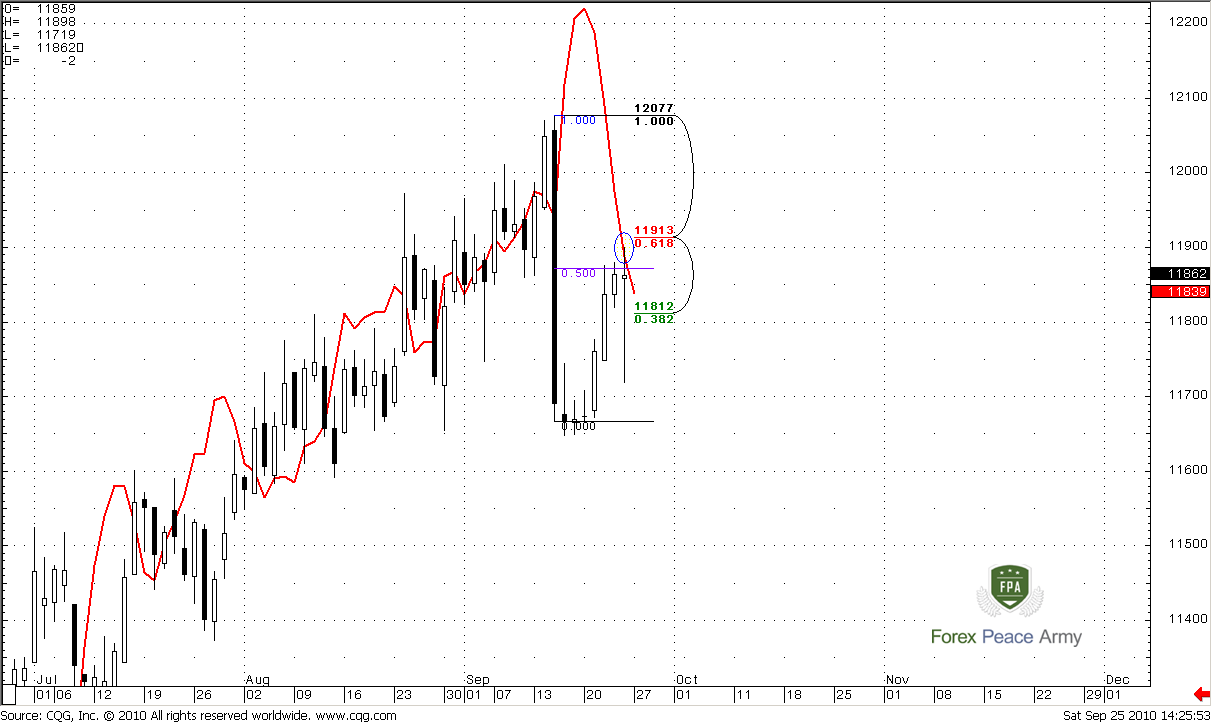
Weekly
There are two important moments on this time frame that I would like to talk about. First, look at larger ellipse and the green line. We have no penetration of this green line that is 3x3 DMA. So, currently we have no supposition for DRPO or B&B Directional trades. Second, now look at red line – this is MACD Predictor and yes, this is MACD failure signal. Usually this kind of signal tells that previous highs at 120.76 should be taken out. Monthly trend remains bullish, weekly trend bullish, so our trading plan should foresee continuation of up move. But we have some problem with daily time frame…
Weekly#1
Daily
The main problem with daily time frame is that we have the same signal as on weekly, but in opposite direction. Sometimes it happens and market calmly change the trend, but nevertheless this fact worries me a bit. In contradiction I can say, that market was strong during previous week – it has closed above monthly and weekly pivots and almost has reached 0.618 resistance area from the high. Also it has touched 50% resistance from intervention bar. Also take a note of a strong last bar – market totally negated the strong sell-off on Friday.
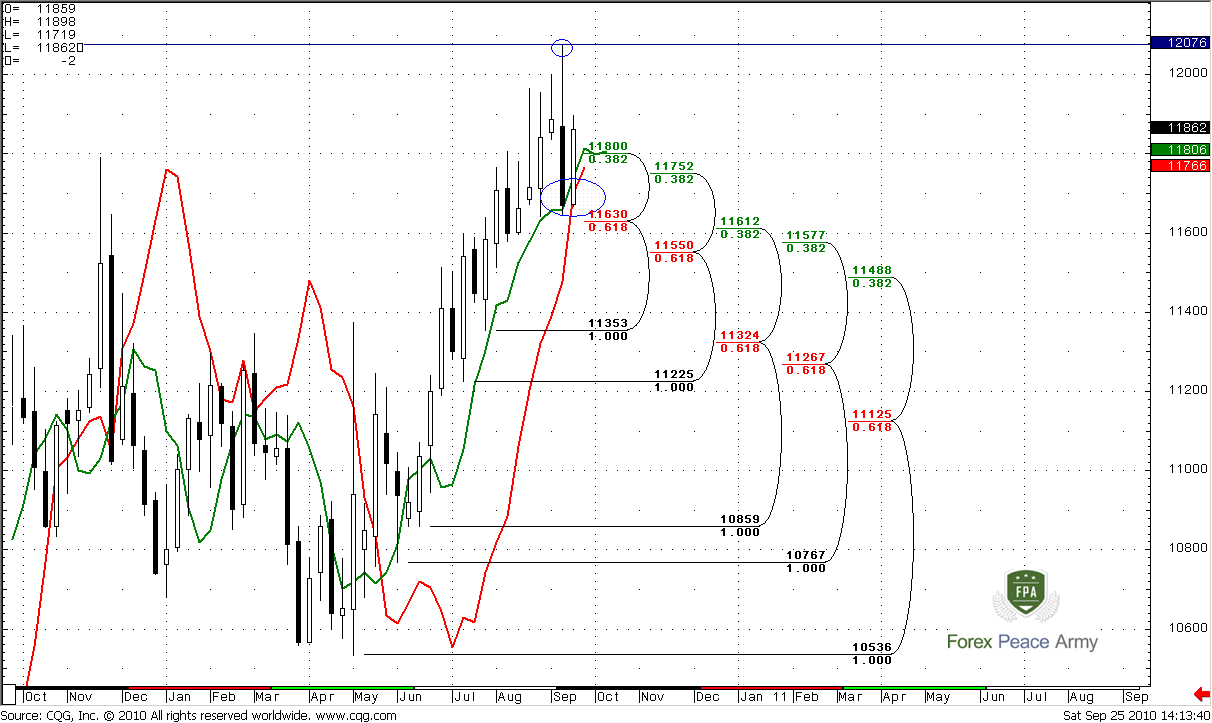
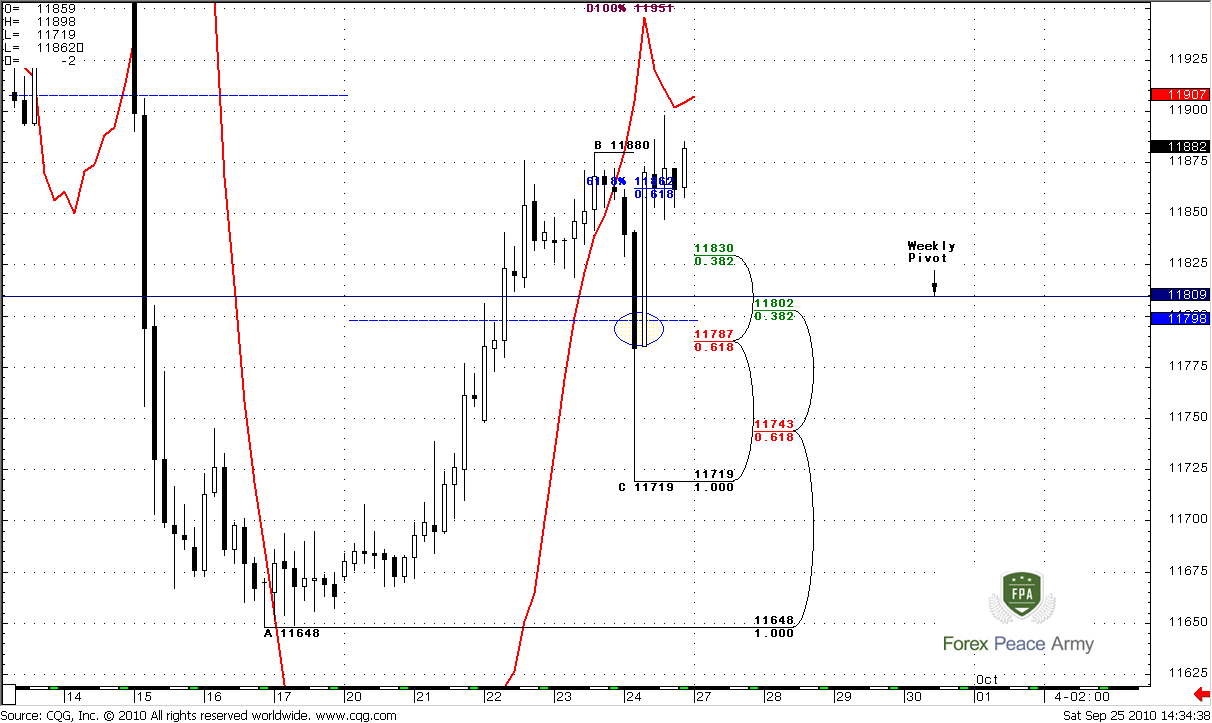
4- Hour
Here we can see, how fast market has returned back after sell-off. Weekly Pivot has held this move down as a Fib support. Now market has reached 0.618 expansion target. Trend turns bearish, but price action does not confirm that and it makes me think that personally I incline to up move then down move. I think that excellent area for enter long is 117.87-118.10 – 4-hour confluence support and weekly pivot point. In general, I do not want to see deep retracement, and the lows at 116.48 should hold anyway. Otherwise our upward context will fail.
In general, I expect up move on JPY/USD and according to signals, the previous highs should be taken out by the price. Although daily MACD failure signal adds some mess in context, 4-hour price action shows that market has strength and I still think that enter on a Long side of the market is preferable. Personally, I like 117.87-118.10 area. Anyway, previous lows should hold, otherwise our upward context will fail.
The technical portion of Sive's analysis owes a great deal to Joe DiNapoli's methods, and uses a number of Joe's proprietary indicators. Please note that Sive's analysis is his own view of the market and is not endorsed by Joe DiNapoli or any related companies.