Live Forex Day Trading - Forex Day Trading Room

Hello,
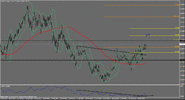
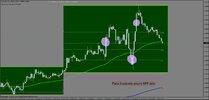
Today we saw very choppy and in some pair quite volatile price action. I was looking again for a short in the GBP/USD but I had to wait for a new setup since the pair did not break down yesterday. As a requirement for a setup I like to see a pair taking out the previous daily range. In case of the GBP/USD it was yesterday’s low. Cable fell a bit more than I liked at the start of the session since I saw limited downside potential after a retrace. The first push brought the pair already pretty close to my initial target at the support level around 1.5990. I had to wait with a short for a retrace to the hourly 20 EMA. That retrace happened sooner than I anticipated and I was unsure if we see a reversal day or not. Nevertheless I took a short at 1.6047 but with half size and a tight 10 pip stop above the hourly 20 EMA. I decided to close the trade for +12 pips which was in hindsight the wrong decision. Cable dropped about 70 pips before recovering a bit. 1.5850 remain the target here in the daily chart. Btw the black lines in the chart are possible price movement projections I make at the beginning of a session. It came pretty close to reality as you can see.
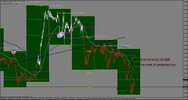
gbpusdjan16th2013.jpg

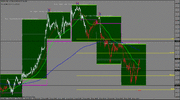
The GBP/JPY setup worked pretty well. The 141.00 target got hit. Personally I got out at 141.60 since I used a tight trailing stop after the Frankfurt open. The entry was 142.76 but that trade was not announced by me I just showed the setup yesterday.
GBP/JPY Forex Trading Strategy January 15th 2013 | Live Forex Day Trading
gbpjpyjan16th2013.gif

Regards,
Marco
 
Hello,
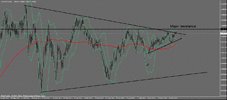
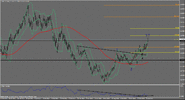
Today I want to take a look at the AUD/USD. This pair has been not very exciting so far this year and the longer term charts suggest that this might be the case for the rest of the year as well. The pair has traded most days in fairly tight ranges with a few exceptions. One exception has be the run to the upside after the ECB announcement not to cut rates but that was just in sympathy with the EUR/USD and that general risk-on sentiment which followed. Overall the pair did not really manage to break higher. If we look at the daily chart we see that the pair approached the major resistance level around 1.0620 but did not get past that yet. There is also the major trend line from the large triangle pattern which did not see a significant break yet. If the pair can break these resistance levels there is potential for a decent run to the upside otherwise I will fall back in the range of the triangle pattern. I would wait for a break of 1.0620 and a re-test for a long. The other option on the daily timeframe would be a short if today’s daily candle ends bellows yesterdays close. You might maybe wait for the Chinese GDP numbers as well which are due in the Asia session later. Stop would be tight (about 20 pips) above 1.0620 and the target 1.0350 where we have the 200 simple MA.

audusdjan16th2013daily.gif

In the 15min chart we are in a short setup right now. The pair broke yesterday low and we have also a bearish cross between the hourly/30 min 20 EMA and the hourly 100 EMA. The pair also retraced to the MA cluster. You could look for a short here with a stop above the trend line (1.0570) and a target at 1.0475 ahead of the next technical support. Again you might want to wait for the Chinese GDP data later which certainly will have an effect on the Aussie. The other option would be to trade it with smaller size. I will stay on the sideline since I don’t the Asia session and the number is too important to ignore.

audusdjan16th2013.gif

Regards,
Marco
 
Hello,
EUR/USD finally was able to break the 1.3400-1.3250 range to the upside on Friday. Since my bias was bullish on the daily chart that break to the upside did not come to a surprise for me. I was looking for a break of that 1.3400 level and a re-test to get in long. The problem with that kind of plan is that sometimes the market does not want to see a re-test of a breakout level and then the good move goes without you. To avoid this kind of scenario you can get in with part of the initial planed position and take the other part on a re-test or a retrace to your preferred retracement levels. It is also likely that more stops built up above/under a range the longer the range holds. Therefore it is likely that the breakout trade really gets the punch with the stop hunting once the range breaks. If you take a look at the 15min chart you see that the EUR/USD broke the previous daily high and made a pullback to the hourly 20 EMA/pivot area in the Asia session for a possible entry based on the strategy I have shown in my last two posts at lifeforexdaytrading.com. In this case I would have not liked that entry much because of the range but nevertheless it proved to be a perfect entry point. Since I did not want to miss a possible move to the 100% Fibonacci expansion from that ECB move (1.3490) I decided to take a ½ size long at 1.3410 and planned to add another half position on a retrace to the hourly 20 EMA. My initial stop was pretty wide with 1.3332 and the initial target was 1.3490. The price moved in my favor slowly but steady and at the end of the live room session I closed the trade for +39 pips. I thought we see a bit of a retrace for a possible re-entry. The price pulled back a bit and I added my ½ position at 1.3420 again. That entry was based on the 5min chart since that area was a re-test of a little consolidation. A news move brought the pair very quickly back up to 1.3460 but I thought we would see my target soon so I did not get out. The pair was not really able to break above 1.3460 so I began to trail my stop closer. In the end I closed the trade for +48 pips at 1.3468.

eurusd252013.jpg

Not so much news here in the daily chart if you followed my previous posts. We are still in wave 3 on the weekly chart with a 100% Fibonacci expansion target at 1.3780 and in wave 5 on the daily chart with a 161.8% target at 1.3590. The inverse head and shoulder pattern has a target around 1.4100. We will see how far wave 5 can go here. I certainly remain bullish. The possible huge short squeeze in EUR/AUD in the coming weeks could also lend fuel to EUR/USD. EUR/AUD has a great bottom formation here on the daily chart with huge upside potential.

eurusd252013daily.gif

Regards,
Marco
 
Hello,
Since I was “advertising” the EUR/AUD a bit yesterday as a possible catalyst for a run in EUR/USD I will take a look the charts again in that pair. The EUR/AUD chart might be my favorite daily chart out there right now. From a fundamental basis there is also a strong case to make here for a long. Marco funds had to be ready for a worst case scenario in Europe and a possible meltdown of the European Union. Therefore they hedged exposures in Europe with shorts in Euro cross pairs. EUR/AUD lost half of its value during that run and I think we are at a turnaround point here. The funds cannot get out at once but slowly unwind their positions. This should cause a structural shift in the market. Getting short in the troublesome Euro made sense and putting the money where growth is as well. China did good, commodities as well and therefore Australia. But now there are doubts if the run in commodities will continue and confidence in the Eurozone is also getting a bit of a grip. The fear of a possible meltdown in the European banking system is fading away and Euro gained ground against every currency. But since the EUR/AUD had such so an amazing run to the downside I think there are still macro funds out there which are short from much higher levels. To unwind these positions will take some time but the structural shift should lend the pair support for the coming month.

On the 15min chart the par already had a good run as you can see in the chart below. The pair already hit the 100% Fibonacci expansion level from the ECB move. A possible good entry point was on January 24th on the retrace back to the hourly 20 EMA (green line) but I missed it. The next touch of the hourly 20 EMA came today but 260 pips higher. Nevertheless I took an optional long here in the Live room but only with ¼ size at 1.2807. I will just trail the stop 20 pips behind the daily pivot.

euraudjan28th2013.gif

On the daily chart the pair is in wave 3 of the large first impulse wave. The 100% FE target comes around 1.3400. The short term target is 1.3010 where we have some technical resistance by the swing high back in September. The chart looks a lot like EUR/USD with the inverse head and shoulder pattern here but the potential is better if you keep in mind where the pair came from.

euraudjan28th2013daily.gif

Regards,
Marco
 
Hello,
I did not expect much price action here in front of the FOMC meeting today. Even my bias on the Euro was bullish I traded with caution here in the last couple of day with small size. The Euro saw some early strength in the European session and I thought it would pull back into a tight range before the FOMC. I was long EUR/USD , AUD/USD and EUR/AUD from the day before but all with just ¼ size. As you know from my previous post I was looking for 1.3580 in EUR/USD which is the 161.8 Fibonacci expansions in the daily chart. (EUR/USD Forex Trading Room Update January 29th 2013 | Live Forex Day Trading)
Nevertheless I closed my position at 1.3510 today in the European live trading room session. In hindsight it was a mistake but I was really not expecting such strong momentum today and was looking for a re-entry on a pullback. That pullback just never occurred. In the end I closed all positions for +76 pips including a 15 pip loss in the AUD/USD. As you can see EUR/USD hit my target now. The EUR/AUD also moved another 100 pips after my exit in the room. Considering these trades have been on ¼ size only a small gain here for the moves we got. It is getting tricky now with fresh long positions in the EUR/USD. It could be the end here for the smaller wave 5 even my final target for that pair is 1.3780 which is the 100% FE level for the large wave 3. I would like to see some retrace now back around 1.3300 before I feel comfortable with long again.

eurusdjan30th2013daily.gif

EUR/AUD had an even better run here today. The structural shift from the funds switching from short to long is the reason for these moves. I explained this behavior in more detail a few days ago. While I am a bit cautious on the EUR/USD now I think that the EUR/AUD has still great upside potential near term. The pair breached the 1.3000 resistance with ease and there is not much in the way until 1.3700. My Fibonacci projections of the impulse waves give me now a 1.3300-1.3400 target. I am still long from 1.2903 on my own account and will add on dips. I hope I can find a decent entry level for the members as well again.

euraudjan30th2013daily.gif

Regards,
Marco
 
Hello,

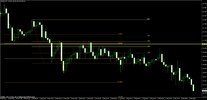
This post is just a short reminder that it can be very tricky to trade around the NFP numbers. Some people like to trade the number because the high volatility also brings opportunity but most traders decide to stay aside until the dust settles. Fridays NFP numbers were a mixed bag and the market did not know what to do with the given data. One on hand the number came in line but and previous numbers also got revised to the upside. On the other hand it is not hard to get decent numbers at such low level and there is not real improvement to be seen here. Not a catastrophic number but not bad enough to give the FED a reason for more QE. The USD got a bit stronger on a first relief reaction but then the market realized the number was not that good and the USD reversed. Late profit taking before the weekend reversed the reverse again. It was easy to get caught in the whipsaw price action. We got three false breakouts in the EUR/USD around the NFP numbers while the latest one is not really one yet until it breaks the 1.3580 area. If I would trade these breakouts I would do it only with small size. Usually it is the better choice just to stay away from the NFP numbers unless you are a real expert. Otherwise you could find yourself trapped in trade which can suddenly work against you.

eurusdfeb3rd2013.jpg

The daily chart remains bullish of course. We are getting very close to my 1.3780 target. I could even see 1.4000 here in the near future. That does not mean we could not see a retrace to 1.3300 before. We are in overbought conditions and the profit on Friday made Friday’s daily candle look a bit bearish. We have the ECB meeting minutes next week. The ECB did hint at their last meeting that there is no rate cut planned in the near future but I bet some might get worried about Euro getting stronger at such a pace.

eurusdfeb3rd2013daily.gif

Regards,
Marco
 
Hello,
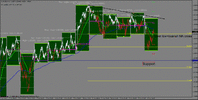
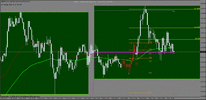
The market was still quite volatile considering it has been a Monday. I decided to scalp the JPY pairs this morning since they move directional lately especially if you look for short term momentum trades. I don’t want to go over every trade but I managed to get +25 pips in GBP/JPY, +17 pips in EUR/JPY and +14 pips in USD/JPY in the live trading room. I only want to show the GBP/JPY here as an exemplary trade. GBP/JPY breached the Asia session highs in the morning and retraced nicely back to the 50% Fibonacci retracement level as you can see in the chart below. As momentum picked up again I went long at 145.92 with ½ size with a 25 pip SL and added another half position at 146.03. I exited the first position at 146.17 and the second at 146.28. You can see my first exit was at the 100 Fibonacci expansion level. The price went up the 161.8 FE level in the end.

gbpjpyfeb4th2013.gif

Regards,
Marco
 
Hello,
The volatility in the European session remains at a good level compared to the moves we have seen last year. I hope it stays that way at least until the summer. It is easier to go with a scalp approach now than it was a couple of weeks ago. The European live trading room session is supposed to be from 2 am-5 am EST but if I hit my 50 pips daily target or hit a 50 pip loss I quit trading. (I should say around 50 pips) Today I was done trading after 90 minutes when I got +75 pips. Most of that came with a trade in the EUR/JPY. (The other one was an AUD/USD short). I am only going to write about the EUR/JPY trade though since it was nice price action setup.

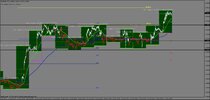
The EUR/JPY is still in a nice uptrend in the longer term charts. Obviously the higher timeframes are in some overbought conditions but you never know how far a trend can go. So it is pretty clear that trading against the trend is more risky than going with the trend. Nevertheless I decided to trade against the major trend this morning. You see in the 5min chart below a 123 move with a lower high and a lower low right around the London open. I was looking for a re-test of the 127.00 area for a short. This is a classic support becomes resistance scenario. You can also see that the price almost exactly retraced to the 50% Fibonacci level of wave 3. I wanted to trade wave 5 down with a target to around 126.50. Is this case 126.50 was not particularly important- I just wanted to get about 50 pips with an initial risk of 26 pips. As you can see my entry was 127.01. This was on 1 and ½ of my usual size since I added ½ at the same entry price. I scaled out of position three times for +60 full pips. As you can see the pair hit the 161.8% Fibonacci expansion of impulse wave 1 later.

eurjpyfeb6th2013.jpg

Regards,
Marco
 
Back
Top