4x4Ever
Private, 1st Class
- Messages
- 56
I'm starting this new thread here to show my market sentiment and correlation studies. I am just new to trying to use these types of studies so any feedback, critic, or corrections is welcome 
February 16, 2012
I am using these studies along with the technical analysis provided by Mr. Sive Morten for trading and training purposes.
In this first segment I'm going to look at the S&P on the larger time frames to see if we can get a good idea where this market/index is heading and how it might show us a shift in market sentiment. It appears to me that markets have been running on a "risk appetite" theme for quite sometime as you will see but I think we may be seeing the start of a shift to "risk aversion". At least in the near to maybe mid term.
S&P 500 - Monthly:
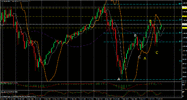
On the monthly chart here I've drawn fib retracements, extensions. The fib retracements (in light blue) mark the high and lows of the last big bear cycle (or risk aversion). Coincidentally these highs (end of 2007) and lows (start of 2009) are also all time high and lows for this market. *at least on the data I have available from my broker which dates back to 1996*.
The fib extensions are in White and Yellow and correspond to the same colour ABC moves shown. In both of these moves the market has reached 61.8 extensions. In particular the first swing (white abc) has just recently reached this 61.8 resistance. This is the area the market is currently trading in.
So from this we could say that some major targets have been accomplished, and possibly this market could at least show some pull back in the near future. Last time these levels were tested the market pulled back quite quickly and quite deeply to around 78.6 support of the yellow ABC.
Other points for the possible reversal are; *The 1st ABC pattern and the 2nd are about equal in number of bars (length of time to form) but the 1st showed very little pull back before taking off to complete the 61.8 expansion while the 2nd shows a much deeper pull back. Also the inclination of the AB moves up are lower (slower) in the 2nd. Weakening trend??
Currently on the Monthly the confirmed trend is Bearish but the unconfirmed trend is Bullish for February if we close at/above current levels. Possibility of stop grabber exists here.
Patterns:
* as stated above, possible stop grabber forming?? Or it could be a real trend shift from monthly bearish to bullish?? Only time will tell.
* it appears that we could have a double top formation in progress. This top is also being formed around the current weekly pivot point and in close proxemity to another possible up target, the 78.6 fib resistance.
* also there is quite possibly a DRPO Sell pattern forming here. If market was to jump up past our yellow B point and then close back below 3x3 (and MACD) we would have a very beautiful looking DRPO Sell.

Obviously a case can be made for further push up as well. Since we have possible targets above the market with 100% expansions. But personally I see alot of grounds for bearish patterns to form here. Which could include also a W&R of these recent highs. All we can do is watch and wait to see what will unfold.
FYI - Daily and Monthly trends are both Bearish but Weekly Trend is Bullish
I'm out of time so I'll extend this analysis later but hopefully this helps or you at least found it interesting. Take care out there and Happy Pip'N! (o:
~Markus
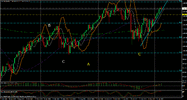
S&P Weekly:

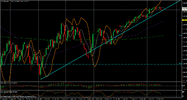
S&P Daily:

February 16, 2012
I am using these studies along with the technical analysis provided by Mr. Sive Morten for trading and training purposes.
In this first segment I'm going to look at the S&P on the larger time frames to see if we can get a good idea where this market/index is heading and how it might show us a shift in market sentiment. It appears to me that markets have been running on a "risk appetite" theme for quite sometime as you will see but I think we may be seeing the start of a shift to "risk aversion". At least in the near to maybe mid term.
S&P 500 - Monthly:
On the monthly chart here I've drawn fib retracements, extensions. The fib retracements (in light blue) mark the high and lows of the last big bear cycle (or risk aversion). Coincidentally these highs (end of 2007) and lows (start of 2009) are also all time high and lows for this market. *at least on the data I have available from my broker which dates back to 1996*.
The fib extensions are in White and Yellow and correspond to the same colour ABC moves shown. In both of these moves the market has reached 61.8 extensions. In particular the first swing (white abc) has just recently reached this 61.8 resistance. This is the area the market is currently trading in.
So from this we could say that some major targets have been accomplished, and possibly this market could at least show some pull back in the near future. Last time these levels were tested the market pulled back quite quickly and quite deeply to around 78.6 support of the yellow ABC.
Other points for the possible reversal are; *The 1st ABC pattern and the 2nd are about equal in number of bars (length of time to form) but the 1st showed very little pull back before taking off to complete the 61.8 expansion while the 2nd shows a much deeper pull back. Also the inclination of the AB moves up are lower (slower) in the 2nd. Weakening trend??
Currently on the Monthly the confirmed trend is Bearish but the unconfirmed trend is Bullish for February if we close at/above current levels. Possibility of stop grabber exists here.
Patterns:
* as stated above, possible stop grabber forming?? Or it could be a real trend shift from monthly bearish to bullish?? Only time will tell.
* it appears that we could have a double top formation in progress. This top is also being formed around the current weekly pivot point and in close proxemity to another possible up target, the 78.6 fib resistance.
* also there is quite possibly a DRPO Sell pattern forming here. If market was to jump up past our yellow B point and then close back below 3x3 (and MACD) we would have a very beautiful looking DRPO Sell.

Obviously a case can be made for further push up as well. Since we have possible targets above the market with 100% expansions. But personally I see alot of grounds for bearish patterns to form here. Which could include also a W&R of these recent highs. All we can do is watch and wait to see what will unfold.
FYI - Daily and Monthly trends are both Bearish but Weekly Trend is Bullish
I'm out of time so I'll extend this analysis later but hopefully this helps or you at least found it interesting. Take care out there and Happy Pip'N! (o:
~Markus
S&P Weekly:

S&P Daily:

Last edited: