My personal FX pairs and XAUUSD analysis

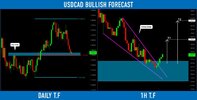
#USDCAD: Time For Pullback

USDCAD reached a key level.
Testing that, the price broke and closed above the resistance line of a falling wedge pattern.

I expect a pullback now.
Goals: 1.355 / 1.3577
 

Attachments

  • usdcad.jpg
    usdcad.jpg
    119 KB · Views: 3
#AUDNZD: Waiting For Breakout

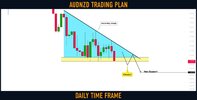
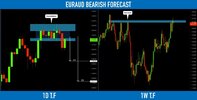
⚠️AUDNZD is trading in a bearish trend.
The price is currently accumulating within a descending triangle formation.

1.067 - 1.069 is its neckline.
If the price breaks and closes below that on a daily, probabilities will be high that the market will drop lower.
Next support will be 1.0627
 

Attachments

  • audnzd.jpg
    audnzd.jpg
    80.6 KB · Views: 3
#GBPUSD: Your Detailed Trading Plan For This Week

⚠️GBPUSD is approaching a key daily structure resistance.
The price is currently stuck with a rising wedge pattern.

To catch a bearish move from that, watch a reaction of the price to the support of the wedge.
If the price breaks and closes below that on a daily, a bearish move will be expected
at least to 1.225.

Alternatively, a bullish breakout of the underlined resistance will push the price much higher.
 

Attachments

  • gbpusd.jpg
    gbpusd.jpg
    70.4 KB · Views: 3
S&P500 Index (#SPY): Bullish Outlook Explained

S&P500 Index is trading in a rising channel on a daily.
The price was approaching a solid resistance cluster on Thursday and Friday.
The market managed to break that and successfully closed above.

I believe that the Index may go higher this week.
Next goal for buyers will be 4155
For Additional confirmation use: the Half Trend Indicator
 

Attachments

  • spy.jpg
    spy.jpg
    99.5 KB · Views: 3
Crude Oil (#WTI): Have You Seen That GAP?

With a sudden OPEC decision to cut oil production rate,
WTI Oil opened with a huge gap up.

The price is currently testing a solid horizontal supply cluster.
What we know about gaps is the fact that in 80% of the time they tend to be filled.
I believe that sellers will push the price from the underlined resistance and initiate a bearish move.

Goals will be 78.57 - middle of the gap, 75.75 - gap open.
 

Attachments

  • wti.jpg
    wti.jpg
    99.6 KB · Views: 4
#NZDUSD: Bullish Setup Explained

NZDUSD reached a solid horizontal support.
The price was steadily falling within a bullish flag pattern.
Once the underlined structure was reached, the market bounced
and broke the resistance of the flag.

I believe the pair will go higher now.
Goals: 0.6267 / 0.62895
 

Attachments

  • nzdusd.jpg
    nzdusd.jpg
    102.2 KB · Views: 3
EURAUD: Bearish Outlook

EURAUD is trading on a key weekly structure resistance.
Once the underlined area was reached, the pair started to trade within a horizontal range for 9 consequent trading days.
Its support was finally broken yesterday.

I think that the pair may drop now.
Targets: 1.593 / 1.5717
For Additional confirmation use: the Ichimoku Cloud Indicator
 

Attachments

  • euraud.jpg
    euraud.jpg
    113.1 KB · Views: 3
Dollar Index (#DXY): Waiting For Breakout

Dollar Index is trading in a minor bearish trend on a daily.
The market is steadily falling within a falling parallel channel.

The Index is currently approaching a solid horizontal support.
I believe that the fall will resume after its breakout.
To confirm that, we will need a daily candle close below 101.9.

A bearish continuation will be expected to 101.0 support then.
For Additional confirmation use: the Momentum Indicator
 

Attachments

  • dxy.jpg
    dxy.jpg
    105.3 KB · Views: 4
Back
Top