My personal FX pairs and XAUUSD analysis

#CADJPY: Bullish Outlook Explained

CADJPY formed a cute double bottom on a key horizontal support on 4H.
Its neckline was broken during the Asian session.

I believe that the pair will most likely bounce.
Target - 98.3
 

Attachments

  • cadjpy.jpg
    cadjpy.jpg
    88.9 KB · Views: 1
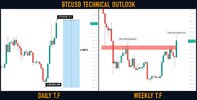
Bitcoin (#BTCUSD) has just broken a new yearly high!

Bulls are pushing Bitcoin again.
The price have updated a new high and currently approaching 27000 level.

From a technical perspective, we see a breakout attempt of a major weekly resistance cluster.
The weekly candle closes in 2 days. Closing above the underlined area, Bitcoin will open a potential
for a further bullish continuation.
 

Attachments

  • btc.jpg
    btc.jpg
    69.7 KB · Views: 1
Gold (#XAUUSD): Your Trading Plan For This Week

⚠️Gold is unstoppable.
The market closed, forming a high momentum bullish candle on a daily.
The price is currently approaching a solid resistance cluster.

To catch a bullish continuation, watch 1977 - 2000 area.
If the price breaks and closes above that, probabilities will be high,
that the market will go much higher.

Next goal for buyers will be 2050.
 

Attachments

  • gold.jpg
    gold.jpg
    116 KB · Views: 1
#EURCAD: Time to Grow!
Update for my Friday's post on EURCAD.
The price has perfectly respected a horizontal key level on a daily:
after a formation of a double bottom pattern on 4H, its neckline was successfully broken.

Now, a bullish continuation is expected.
Targets: 1.469 / 1.4735
For additional confirmation use: VWAP MT4 Indicator
 

Attachments

  • eurcad.jpg
    eurcad.jpg
    66 KB · Views: 2
#NZDUSD: Classic Top-Down Setup

NZDUSD is approaching a solid horizontal daily resistance.
We see a strong bearish reaction from that:
the price formed a rising wedge pattern and a head and shoulders pattern,
the support of the wedge and the neckline of h&s were successfully broken.

I believe that the pair may drop.
Goals: 0.6237 / 0.622
 

Attachments

  • nzdusd.jpg
    nzdusd.jpg
    110.3 KB · Views: 1
Dow Jones Index (#US30): Key Levels to Watch This Week

Here is my latest structure analysis and key levels to watch this week on ⚠️Dow Jones.

Support 1: 31420 - 31830 area
Support 2: 30690 - 30900 area
Support 3: 30070 - 30360 area

Resistance 1: 32250 - 32610 area
Resistance 2: 33430 - 33660 area

The market is currently stuck between Support 1 & Support 2.
The market participants are awaiting the interest rate decision on Wednesday.
It will most likely clarify the future direction of the market with a breakout.

Consider the underlined structures for pullback/breakout trading.
 

Attachments

  • us30.jpg
    us30.jpg
    117.8 KB · Views: 1
GBPCHF broke and closed above a major falling trend line on a daily.
The broken trend line turned into a key vertical support now.
Probabilities will be high, that a bullish movement will initiate from that.

Next goals for buyers: 1.1423 / 1.151
For Additional confirmation use: Leading Indicators
 

Attachments

  • gbpchf.jpg
    gbpchf.jpg
    101.8 KB · Views: 1
GOLD (#XAUUSD): Detailed Structure Analysis

Here is my detailed structure analysis for ⚠️Gold.

Resistance 1: 1998.0 - 2010.0 area
Resistance 2: 2050.0 - 2070.0 area

Support 1: 1949.0 - 1960.0 area
Support 2: 1875.0 - 1904.0 area
Support 3: 1854.0 - 1859.0 area
Support 4: 1804.0 - 1813.0 area

Consider these structures for pullback / breakout trading.
 

Attachments

  • gold.jpg
    gold.jpg
    128 KB · Views: 1
AUDNZD reached a solid horizontal structure resistance.
The price formed a doji candle on 4h and a double top pattern on 1H time frame.
The neckline of the double top has just been broken.

I expect a retracement to 1.0767 / 1.0744
For Additional confirmation use: Swing Trading Indicators
 

Attachments

  • audnzd.jpg
    audnzd.jpg
    105.5 KB · Views: 1
#GBPNZD: Classic Bullish Setup Explained

GBPNZD formed a huge ascending triangle formation on a daily time frame.
Its neckline was broken yesterday.

Probabilities are high that the price will grow now.
Goal - 1.998
For Additional confirmation use: Trend Indicators
 

Attachments

  • gbpnzd.jpg
    gbpnzd.jpg
    100.1 KB · Views: 1
Back
Top