My personal FX pairs and XAUUSD analysis

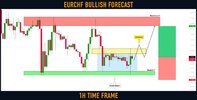
#EURCHF: Your Trading Plan For Today

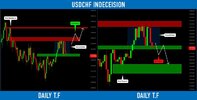
⚠️EURCHF is currently consolidating.
The pair is trading within a wide intraday trading range.
Currently, the price is approaching its lower boundary.

To buy the pair with a confirmation, watch a double bottom pattern.
0.994 - 0.9943 is its neckline.
Wait for an hourly candle close above that (it will confirm a breakout),
buy aggressively or on a retest then.

Target will be 0.996

If the price sets a new lower low, the setup will be invalid.
Also use RSI Indicator for confirmation.
 

Attachments

  • eurchf.jpg
    eurchf.jpg
    107.7 KB · Views: 1
#CADCHF: Important Breakout

CADCHF was coiling for more than a month within a wide horizontal trading range on a daily.
Its support was finally broken yesterday.

I believe that the pair will keep falling now.
Next support - 0.679
 

Attachments

  • cadchf.jpg
    cadchf.jpg
    111.6 KB · Views: 2
#USDCHF: Bearish Move From Key Level

USDCHF looks overbought to me,
The price formed a double top pattern approaching a key structure resistance.
Its neckline has been just broken.

Probabilities are high that we will see a correctional movement on the pair.
Goals: 0.935 / 0.931
 

Attachments

  • usdchf.jpg
    usdchf.jpg
    63.7 KB · Views: 2
#CADJPY: Classic Trend-Following Setup

CADJPY broke and closed below a support line of a bearish flag pattern.
Taking into consideration, that the pair is trading in a bearish trend,
that violation may trigger a sell off.

I expect a bearish continuation to 97.05 / 96.1
 

Attachments

  • cadjpy.jpg
    cadjpy.jpg
    100.8 KB · Views: 2
#USDCHF: Detailed Technical Outlook

⚠️USDCHF is currently consolidating.
The price is stuck between 2 horizontal key levels that compose a range.

0.9425 - 0.946 is the resistance of the range.
0.9285 - 0.9306 is the support of the range.

Depending on the reaction of the price to its boundaries,
I see 2 potential scenarios:

1️⃣If the price breaks and closes above the resistance of the range,
a bullish continuation will be expected at least to 0.9537.

2️⃣If the price breaks and closes below the support of the range,
a bearish move will be expected to 0.9193 support.

Wait for a breakout, that will clarify the future direction of the market.
Also use Directional Indicator for confirmation!
 

Attachments

  • usdchf.jpg
    usdchf.jpg
    120.9 KB · Views: 2
Binance Coin (#BNBUSD): Very Bearish Outlook! Here is Why:

Have you seen that huge head & shoulders pattern that was formed
on Binance Coin on a daily.

After yesterday's fundamentals, the price successfully violated its neckline and closed below that.
Probabilities are high now, and the market will keep falling.

Goals: 256 / 243
 

Attachments

  • bnbusd.jpg
    bnbusd.jpg
    56.8 KB · Views: 2
Gold (#XAUUSD): Important Bullish Clue on a Weekly

Gold has nicely respected a major weekly structure support.
The market formed a bullish engulfing candle after the test of structure,
and then we saw a very nice rejection from that.

It looks like Gold may go higher.
Next resistance 1925.

Remember, that weekly time frame chart unveils a long-term perspective.
So it may take weeks, before the price reaches the target.
 

Attachments

  • gold.jpg
    gold.jpg
    94.2 KB · Views: 1
#GBPAUD: Time For Pullback

GBPAUD reached a key daily structure resistance.
The market was nicely rejected from that on 4H first,
then, a bearish engulfing candle was formed.

I expect a retracement from that structure.
Goal - 1.804
 

Attachments

  • gbpaud.jpg
    gbpaud.jpg
    97.3 KB · Views: 1
S&P500 Index (#SPY) Bearish Outlook Explained

S&P500 reached a solid horizontal key level.
The price formed a tiny double top on that and a doji candle.
Now, bears are pushing.

I expect a fall to 3886 / 3851
 

Attachments

  • 500.jpg
    500.jpg
    57.4 KB · Views: 0
Back
Top