Sive Morten
Special Consultant to the FPA
- Messages
- 18,644
Attention. My analysis is based on JPY/USD, not on usual USD/JPY. It means that
My chart is reverse to yours . My support is your resistance and so on.
To receive numbers and levels in common formation, you need to use the formula:
1/MY QUOTE*10000
Example. My level of resistance 118.42
Usual level of support= 1/118.42*10 000 = 84.44
My chart is reverse to yours . My support is your resistance and so on.
To receive numbers and levels in common formation, you need to use the formula:
1/MY QUOTE*10000
Example. My level of resistance 118.42
Usual level of support= 1/118.42*10 000 = 84.44
Monthly
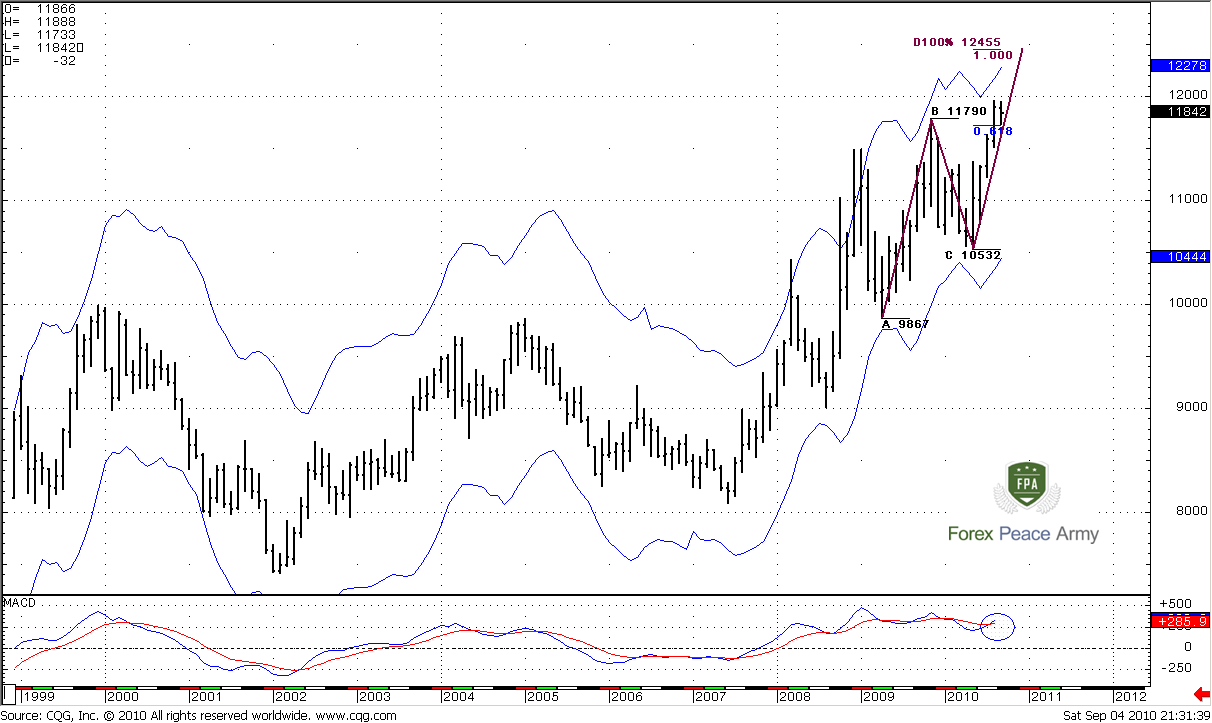
On monthly chart trend is bullish (your trend, guys is bearish rather). The higher the rate of Yen, the more probable becomes an intervention of BoJ. So, market move to the upside gradually. Market shows very good AB-CD pattern with target around 124.55 (your quote, guys will be 1/124.55*10000 = 80.28). Market has passed through 0.618 expansion, and move above it. The speed of AB and CD leg is the same, so this AB-CD move is very harmonic, that can lead to some resistance at 124.55 area. Also there is some divergence with MACD indicator, but you know my attitude to this signal. Also – 122.78 is a monthly overbought area that is precisely at the target of AB-CD pattern.
Some of you, may be think about 3-drive sell pattern, but personally, I do not clarify this price action as 3-drive, because tops not match the conditions of 3-drive.
Weekly
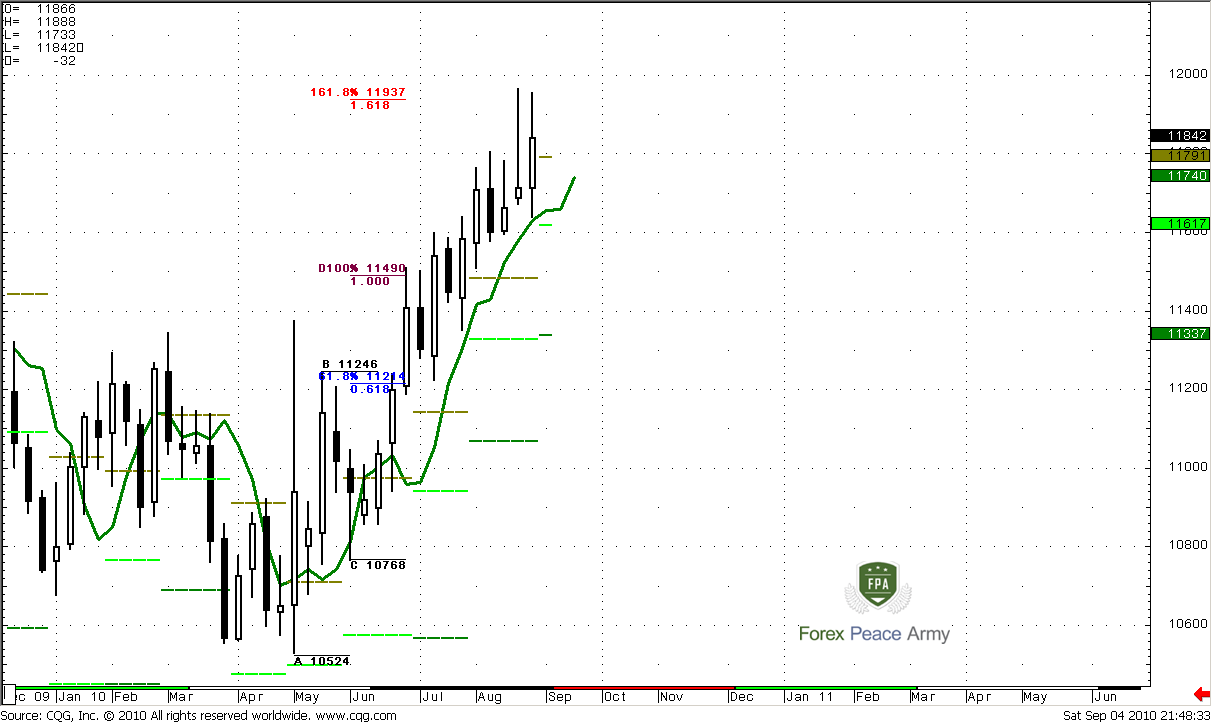
On the #1 weekly chart you can see solid thrust up. Market action shows good separation from 3x3 DMA, and sufficient number of up candles, even after penetration of 3x3 in the beginning of the move. The next important moment is that market has reached 1.618% expansion of ABC-bottom pattern. So, we can count on some pull back. Particularly, I hint at possible momentum trade that potentially can lead to monthly target.
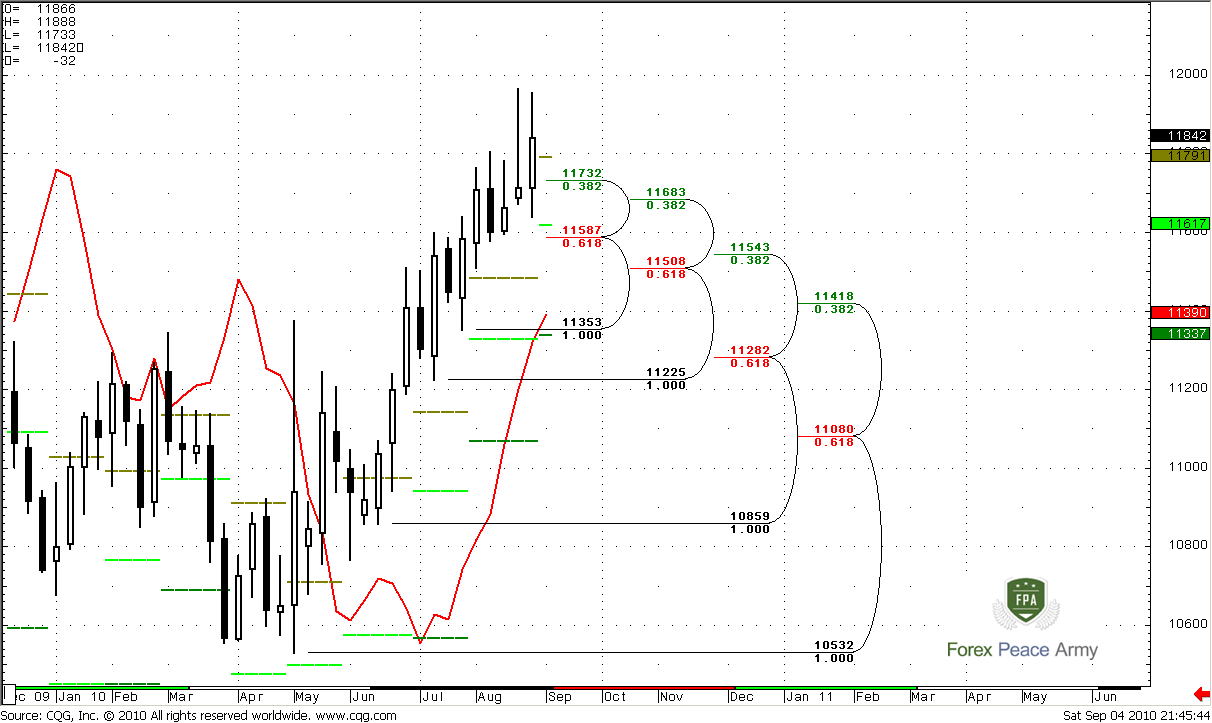
On chart #2 we can see that trend is definitely bullish, and it will be bullish until 113.90 area. For the momentum trade it should be relatively deep penetration of 3x3, but not so deep as leading to trend shifting to bearish. So, there are 2 levels are suitable for this purpose. 115.87-116.17 – Fib support and monthly pivot support 1 and 115.08-115.43 – Confluence support area. The second area is preferable, and I suspect that it will be reached not during the next week, may be we need couple of weeks to reach it, if market intends to make a retracement at all…
Daily
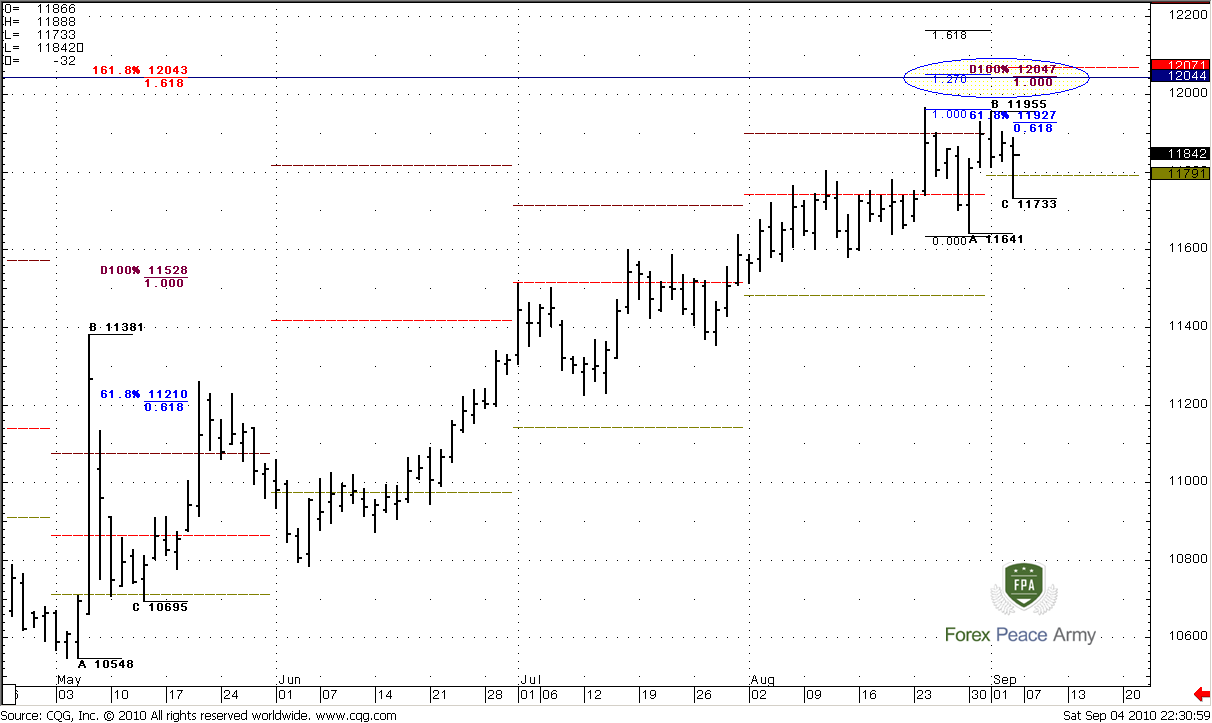
Daily chart is very difficult to analyze right now. Looks like people continue to buy Yen, but with cautions and with aware of possible intervention. I do not see a big deal with identification trend, because it very choppy, and currently it bearish. The more important, to my mind, is a price action in the channel. The upper swings usually stop by weekly pivot resistance 1, and downward move – by support 1. So, for the next week weekly Pivot support 1 at 116.70 with Fib support around 116.83. The resistance 1 at 119.84. So, I can make a conclusion that currently market is suitable for intraday scalp trade only, because there are no signals on longer time frame. Personally, I prefer the downward brake of this channel and as level of support I like 115.08-115.18 Confluence support. Also this is a weekly pivot support 2.
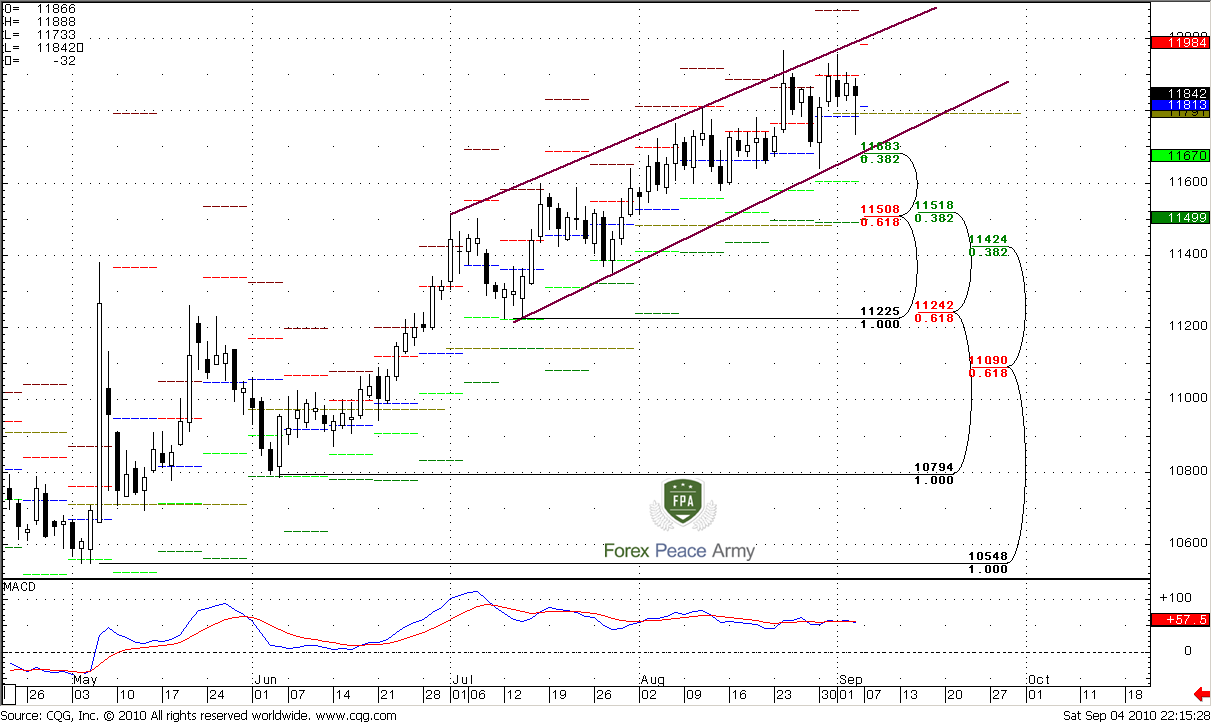
If market will show move to the upside – then there is a solid resistance just above the market – 120.43-120.71. It includes 1.618% expansion, 1.27 expansion from recent retracement, monthly pivot resistance 1 and 100% expansion from recent ABC-bottom pattern. So, if market will show upper breakout of the channel – then it probably will fail somewhere around this area.
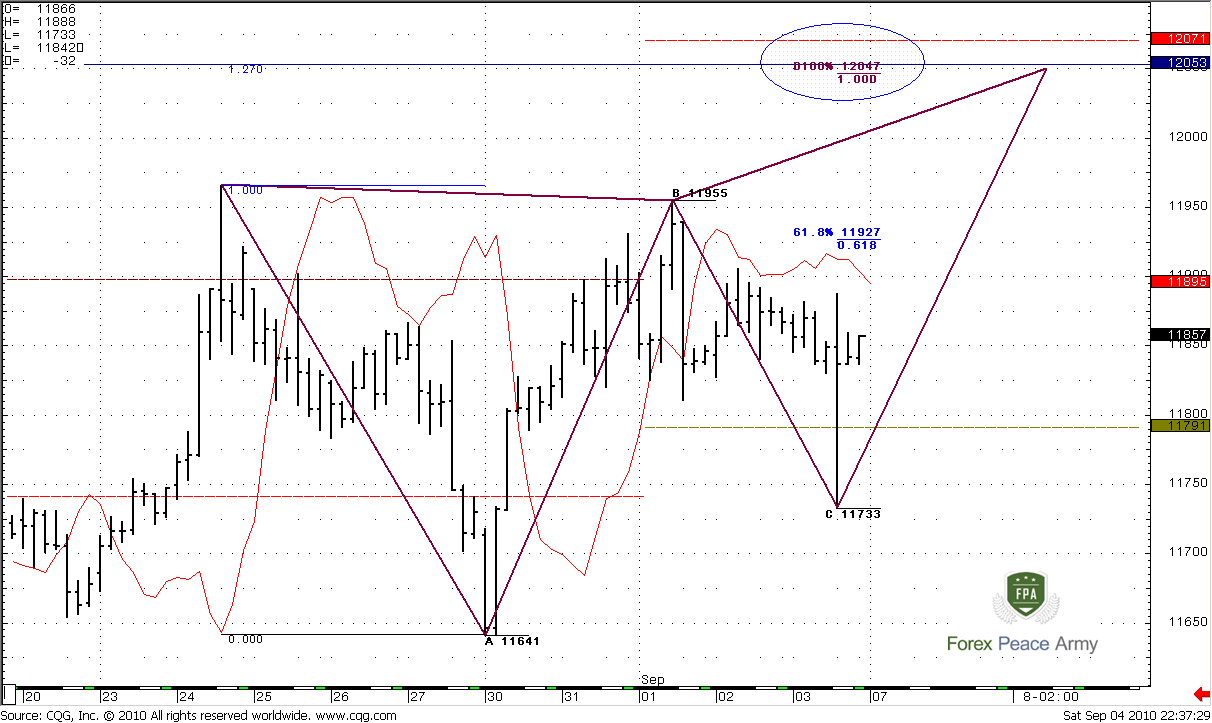
4- Hour
I post this fragment of daily chart with more details, so that it will be clear for you. This can be a possible trading plan for Monday or Tuesday. You can see that 4-hour trend currently bearish, but market does not confirm it. First of all, we have to see the trend shifting to bullish. Just below the market is a strong support area – 117.91- 118.13 monthly pivot point and weekly pivot. If market will hold above this area and trend will shift up, then, probably we can take this trade with target at 120.50. But better way to enter – wait while the weekly pivot will be approved at US trading session on Tuesday, because Monday is a holiday.
That’s being said, there is very contradictory price action in different time frames. From long term perspective, I think that market can reach 124.55 area. But currently we should expect a pullback. It can come during next week or may be on week after that. This pullback can start right at the beginning of the week or there short-term upper break out failure to 120.50 can precede it.
The right way to act here is to track 4- hour trend. If it will turn bullish and Pivot area will hold – then we will reach 120.50 before the possible pullback to the down side. IF not – wait for daily channel breakout and sell the first retracement to the upside. The nearest target is 115.20 area. I think that we can even sell at 120.50, if there will be some signs of weakness.
The technical portion of Sive's analysis owes a great deal to Joe DiNapoli's methods, and uses a number of Joe's proprietary indicators. Please note that Sive's analysis is his own view of the market and is not endorsed by Joe DiNapoli or any related companies