Antony_NPBFX
NPBFX Representative (unconfirmed)
- Messages
- 1,092
AUD/USD: Australian dollar is strengthening 17.10.2018
Good afternoon, dear forum visitors!
NPBFX offers the latest release of analytics on the AUD/USD for a better understanding of the current market situation and more efficient trading.
Current trend
AUD continues growing moderately against USD, updating local highs of October 3. The reason for the development of "bullish" dynamics of the instrument is in technical factors, as well as in the overall decline in risk-taking interest of traders amid worsening US relations with China and Saudi Arabia.
On Tuesday, the RBA meeting minutes were published but they did not disclose anything new to investors. RBA officials noted the acceleration of GDP due to an increase in investment in subsoil use and consumption growth, employment growth, and a decrease in unemployment. The current policy of the regulator will continue to support the Australian economy; there are no convincing arguments for raising interest rates.
Today, the pair is trading in both directions, waiting for new drivers. The published MI Leading Index was worse than analysts' expectations and fell by 0.1% MoM against 0.0% MoM in the previous month.
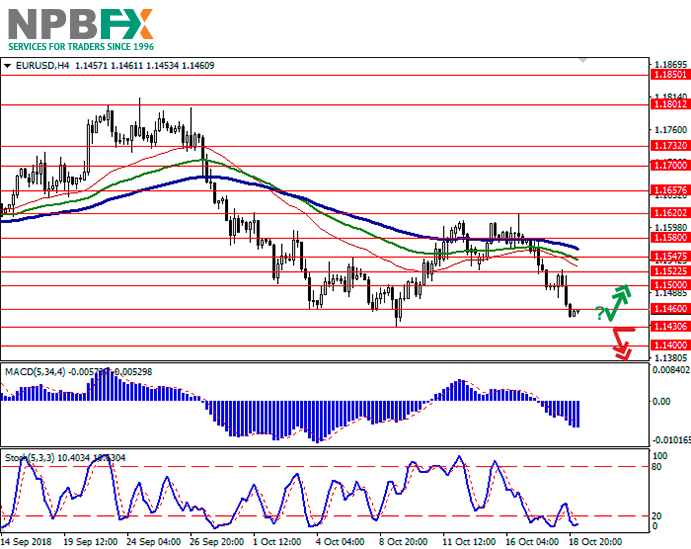
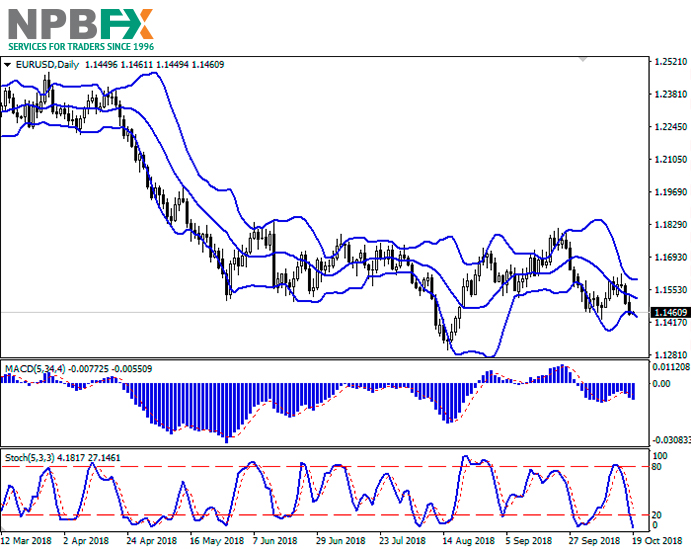
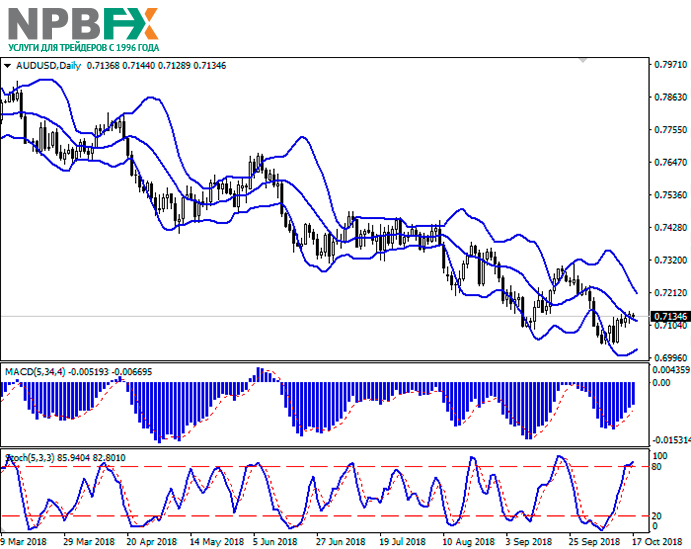
Support and resistance
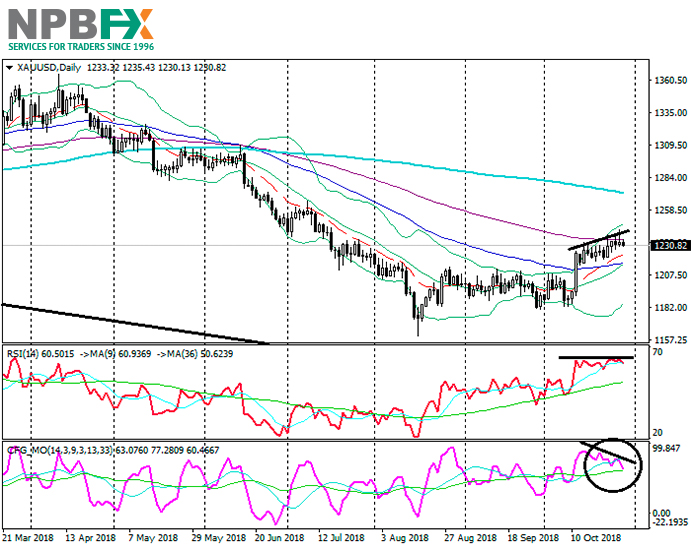
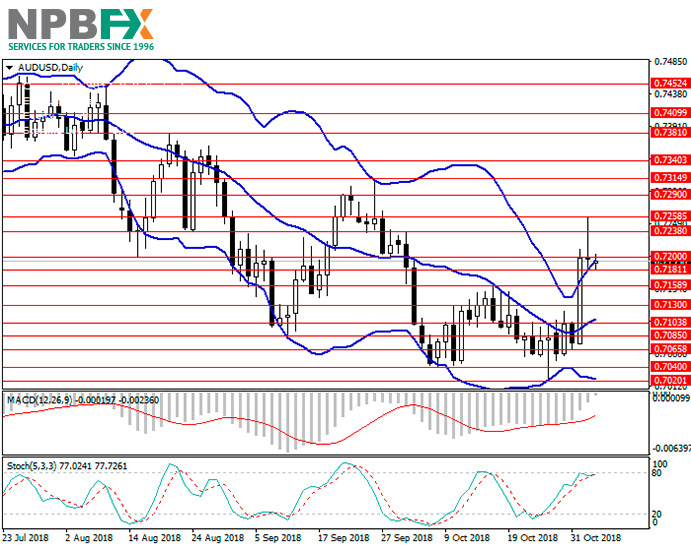
Bollinger Bands in D1 chart demonstrate a gradual decrease. The price range is narrowing, reflecting the flat dynamics of trading in the medium term. MACD indicator is growing keeping a stable buy signal (located above the signal line). Stochastic keeps its upward direction but is approaching its maximum levels, which reflects the overbought AUD in the ultra-short term.
Existing long positions should be kept until the situation clears up.
Resistance levels: 0.7150, 0.7175, 0.7200, 0.7234.
Support levels: 0.7130, 0.7100, 0.7068, 0.7039.
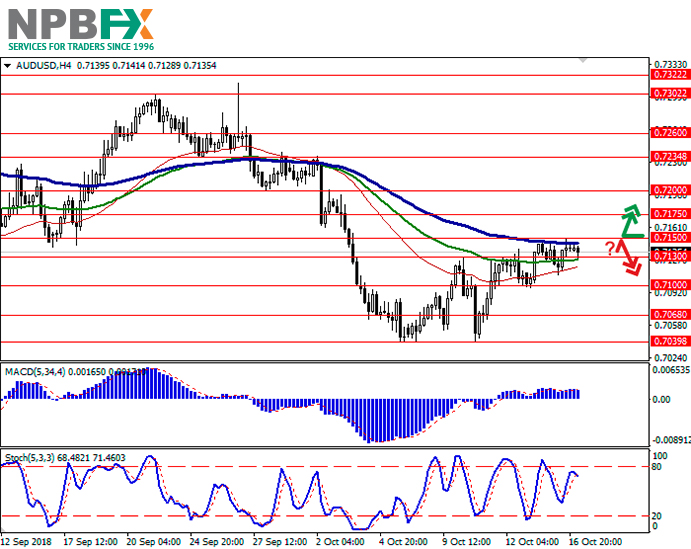
Trading tips
To open long positions, one can rely on the breakout of 0.7150. Take profit — 0.7200 or 0.7234. Stop loss — 0.7120 or 0.7110. Implementation period: 1-3 days.
The rebound from 0.7150 as from resistance with the subsequent breakdown of 0.7130 can become a signal to begin correctional sales with target at 0.7068 or 0.7039. Stop loss — 0.7160. Implementation period: 2-3 days.
Use more opportunities of the NPBFX analytical portal: analytics
You can find more actual analytical reviews on other popular currency pairs, metals and CFDs on the NPBFX online portal. Daily analytics with charts, current market prognoses and trading scenarios in the Feed section are available. Get free and unlimited access to the online portal after registering on the official website of NPBFX Company.
If you have any questions about trading instruments, you can always ask an analyst in the online chat on the portal and get a free consultation of an experienced specialist.
Use the current recommendations of analysts on AUD/USD and trade efficiently with NPBFX.
Good afternoon, dear forum visitors!
NPBFX offers the latest release of analytics on the AUD/USD for a better understanding of the current market situation and more efficient trading.
Current trend
AUD continues growing moderately against USD, updating local highs of October 3. The reason for the development of "bullish" dynamics of the instrument is in technical factors, as well as in the overall decline in risk-taking interest of traders amid worsening US relations with China and Saudi Arabia.
On Tuesday, the RBA meeting minutes were published but they did not disclose anything new to investors. RBA officials noted the acceleration of GDP due to an increase in investment in subsoil use and consumption growth, employment growth, and a decrease in unemployment. The current policy of the regulator will continue to support the Australian economy; there are no convincing arguments for raising interest rates.
Today, the pair is trading in both directions, waiting for new drivers. The published MI Leading Index was worse than analysts' expectations and fell by 0.1% MoM against 0.0% MoM in the previous month.
Support and resistance
Bollinger Bands in D1 chart demonstrate a gradual decrease. The price range is narrowing, reflecting the flat dynamics of trading in the medium term. MACD indicator is growing keeping a stable buy signal (located above the signal line). Stochastic keeps its upward direction but is approaching its maximum levels, which reflects the overbought AUD in the ultra-short term.
Existing long positions should be kept until the situation clears up.
Resistance levels: 0.7150, 0.7175, 0.7200, 0.7234.
Support levels: 0.7130, 0.7100, 0.7068, 0.7039.
Trading tips
To open long positions, one can rely on the breakout of 0.7150. Take profit — 0.7200 or 0.7234. Stop loss — 0.7120 or 0.7110. Implementation period: 1-3 days.
The rebound from 0.7150 as from resistance with the subsequent breakdown of 0.7130 can become a signal to begin correctional sales with target at 0.7068 or 0.7039. Stop loss — 0.7160. Implementation period: 2-3 days.
Use more opportunities of the NPBFX analytical portal: analytics
You can find more actual analytical reviews on other popular currency pairs, metals and CFDs on the NPBFX online portal. Daily analytics with charts, current market prognoses and trading scenarios in the Feed section are available. Get free and unlimited access to the online portal after registering on the official website of NPBFX Company.
If you have any questions about trading instruments, you can always ask an analyst in the online chat on the portal and get a free consultation of an experienced specialist.
Use the current recommendations of analysts on AUD/USD and trade efficiently with NPBFX.