NPBFX - making money with us since 1996!

WTI Crude Oil: oil prices are falling 14.11.2018

Good afternoon, dear forum visitors!

NPBFX offers the latest release of analytics on the WTI Crude Oil for a better understanding of the current market situation and more efficient trading.

Current trend

Yesterday, oil prices renewed the year’s lows. The commodity markets have been declining for the 6th week in a row due to the sharp increase in oil production, despite the current OPEC agreement. The published report of the cartel reflected an increase in forecasts for 2018 and 2019, as well as a sharp increase in the current level of production in October against September.

US "black gold" production increases significantly, too. Earlier this month, the Department of Energy announced that the country reached peak volumes of 11.346 million barrels per day. In this case, according to President Donald Trump, prices on the market should be much lower. Based on these considerations, Trump criticized Saudi Arabia’s intention to cut production and try to stabilize the market situation in the coming month.

Support and resistance

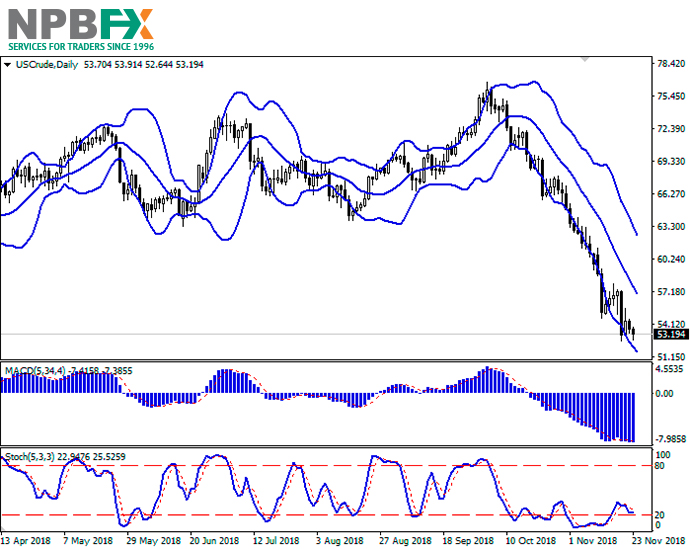
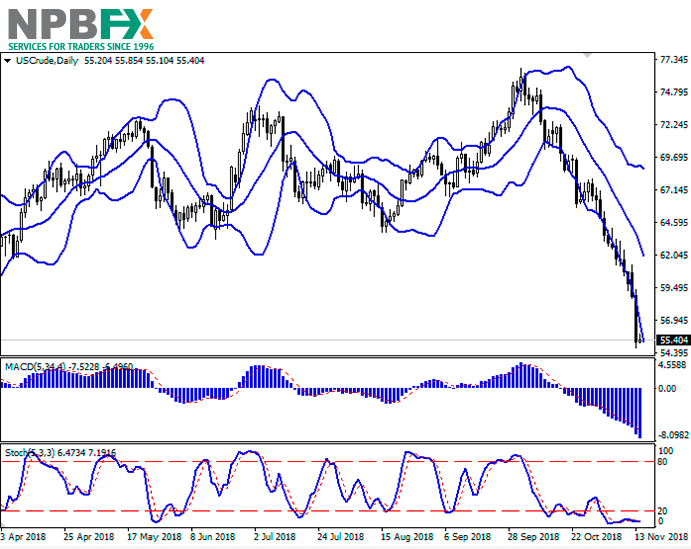
On the daily chart, Bollinger bands are steadily declining. The price range is widening but not as fast as the “bearish” moods are developing. MACD is falling, keeping a strong sell signal (the histogram is below the signal line). Stochastic has been close to its lows for several weeks, reflecting that the instrument is strongly oversold in the short and super short term.

A correction impulse formation is possible at the end of the current trading week.

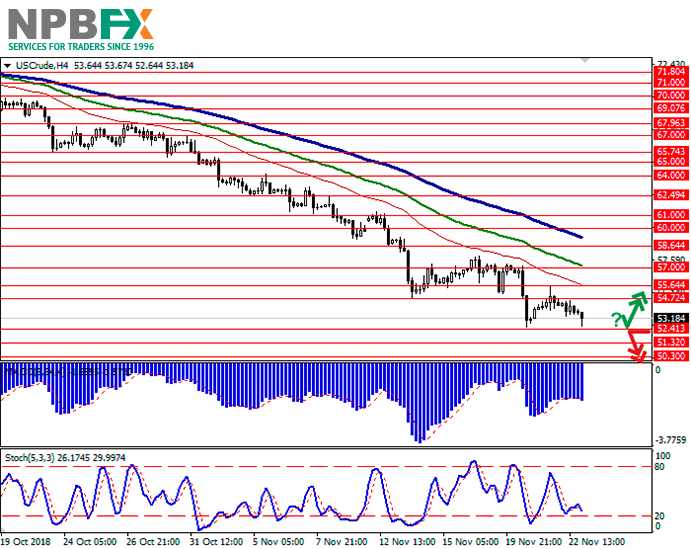
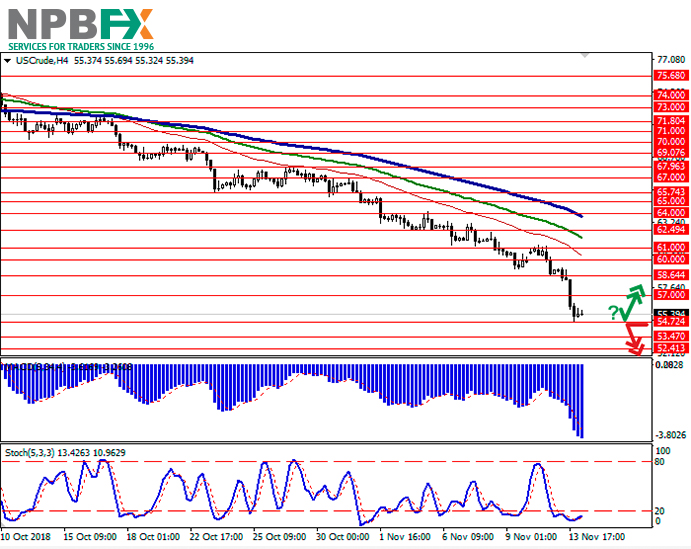
Resistance levels: 57.00, 58.64, 60.00, 61.00.

Support levels: 54.72, 53.47, 52.41.

7-2.jpg


8-1.jpg


Trading tips

Long positions can be opened after a rebound from the level of 54.72 and a breakout of the level of 57.00 with the target at 60.00 or 61.00. Stop loss is 55.50. Implementation period: 2–3 days.

Short positions can be opened after the breakdown of the level of 54.72 with the targets at 52.41–52.00. Stop loss is 56.00. Implementation period: 1–2 days.

Use more opportunities of the NPBFX analytical portal: glossary. Beginning traders certainly face a lot of specialized concepts and lexicon on FOREX, which are often not fully been understood. Swap, tick, hedge, margin calls are often unfamiliar to beginning traders. But the lack of knowledge of these fundamentals make a competent market vision impossible. So glossary on the NPBFX analytical portal could be an excellent helper in this case, which contains all the main definitions with explanations in a compact and accessible form. All concepts are arranged in alphabetical order, so that you can easily and quickly find and explore a new concept for yourself.

If you have any questions about trading instruments, you can always ask an analyst in the online chat on the portal and get a free consultation of an experienced specialist.

Use the current recommendations of analysts on WTI Crude Oil and trade efficiently with NPBFX.
 
USD/CAD: wave analysis 16.11.2018

Good afternoon, dear forum visitors!

NPBFX offers the latest release of analytics on the USD/CAD for a better understanding of the current market situation and more efficient trading.

Current trend

The pair may grow.

On the 4-hour chart, the downward correction of the higher level developed as a wave 2, and the formation of the third wave 3 began. Now the first wave of the lower level i of 3 is developing, within which the wave (iii) of I is forming. If the assumption is correct, the pair will grow to the level of 1.3390. In this scenario, critical stop loss level is 1.3053.

usdcad161118-44.png


usdcad161118-66.png


Main scenario

Long positions will become relevant during the correction, above the level of 1.3053 with the target at 1.3390. Implementation period: 7 days and more.

Alternative scenario

The breakdown and the consolidation of the price below the level of 1.3053 will let the pair go down to the level of 1.2887.

Use more opportunities of the NPBFX analytical portal:trading signals.

Make right trade decisions on sell or buy USD/CAD and other popular instruments using trading signals on the NPBFX portal. All registered users have free access to signals from the top 10 trading indicators (MA10, BBands, Ichimoku, Stochastic, ZigZag, etc.) with also general recommendations on the portal.

If you have any questions about trading instruments, you can always ask an analyst in the online chat on the portal and get a free consultation of an experienced specialist.

Use the current recommendations of analysts on USD/CAD and trade efficiently with NPBFX.
 
NZD/USD: instrument consolidates 19.11.2018

Good afternoon, dear forum visitors!

NPBFX offers the latest release of analytics on the NZD/USD for a better understanding of the current market situation and more efficient trading.

Current trend

During the Asian session, NZD is in a “bearish” trend, being corrected after strong growth and the renewal of the highs since June 26 last week.

On Friday, USD was under pressure by statements by United States Secretary of Commerce Wilbur Ross. He noted that the US administration intends to increase tariffs on Chinese exports further, and at the meeting of President Trump and Chairman Xi Jinping at the G20 summit in Argentina, only a framework agreement can be concluded, which will serve a basis for further negotiations. Currently, the US administration suggested a list of 142 requirements from China, China submitted a list of possible concessions but, according to Bloomberg, it will not satisfy the US.

NZD is supported by strong data. October Manufacturing PMI rose from 51.7 to 53.5 points, which was better than the average experts' forecasts.

Support and resistance

On the daily chart, Bollinger bands are actively growing. The price range narrows, reflecting the development of correctional dynamics at the beginning of the week. MACD indicator is growing, keeping a strong buy signal (the histogram is above the signal line). Stochastic reached its highs and reversed horizontally, reflecting that NZD is strongly overbought in the super-short and short term.

The formation of a full downward trend is possible in the next few days.

Resistance levels: 0.6882, 0.6920, 0.6954.

Support levels: 0.6849, 0.6814, 0.6788, 0.6750.

nzdusd191118-77.png


nzdusd191118-88.png


Trading tips

Long positions can be opened after the breakout of the level of 0.6882 with the targets at 0.6954 or 0.6975. Stop loss is 0.6840.

Short positions can be opened after the breakdown of the level of 0.6814 with the target at 0.6704 or 0.6662. Stop loss is 0.6855.

Implementation period: 2–3 days.

Use more opportunities of the NPBFX analytical portal: e-book

If you just recently started to be interested in trading on FOREX and would like to deepen your knowledge, an electronic Beginner's Guide to FOREX Trading will be an excellent helper for you here. The book consists of 5 chapters and reflects fundamental concepts of the foreign exchange market to start successful trading. From the main chapters of the E-book you can learn about the concepts and history of FOREX, currencies and trend lines, technical indicators, types of orders, trading on news, psychology of trading, risk management and much more.

You can read a Beginner's guide to FOREX Trading online or download it free of charge from the NPBFX analytical portal in the "Education" section. In order to get unlimited access to the E-book and other useful instruments on the portal, you need to register on the NPBFX website.

If you have any questions about trading instruments, you can always ask an analyst in the online chat on the portal and get a free consultation of an experienced specialist.

Use the current recommendations of analysts on NZD/USD and trade efficiently with NPBFX.
 
USD/JPY: wave analysis 21.11.2018

Good afternoon, dear forum visitors!

NPBFX offers the latest release of analytics on the USD/JPY for a better understanding of the current market situation and more efficient trading.

The pair can decrease.

On the 4-hour chart, the local correction of the higher level develops as a wave 2 of (C). Now the wave c of 2 is forming, within which the wave of the lower level (i) of c has formed, and the correction (ii) of c is developing. If the assumption is correct, after the end of the correction the pair will fall to the level of 111.35. In this scenario, critical stop loss level is 114.22.

usdjpy21112018-77.png


usdjpy21112018-88.png


Main scenario

Short positions will become relevant during the correction, below the level of 114.22 with the target at 111.35. Implementation period: 7 days and more.

Alternative scenario

The breakout and the consolidation of the price above the level of 114.22 will let the pair grow to the level of 115.50.

Use more opportunities of the NPBFX analytical portal: glossary.

Beginning traders certainly face a lot of specialized concepts and lexicon on FOREX, which are often not fully been understood. Swap, tick, hedge, margin calls are often unfamiliar to beginning traders. But the lack of knowledge of these fundamentals make a competent market vision impossible. So glossary on the NPBFX analytical portal could be an excellent helper in this case, which contains all the main definitions with explanations in a compact and accessible form. All concepts are arranged in alphabetical order, so that you can easily and quickly find and explore a new concept for yourself.

If you have any questions about trading instruments, you can always ask an analyst in the online chat on the portal and get a free consultation of an experienced specialist.

Use the current recommendations of analysts on USD/JPY and trade efficiently with NPBFX.
 
WTI Crude Oil: oil prices continue declining 23.11.2018

Good afternoon, dear forum visitors!

NPBFX offers the latest release of analytics on the WTI Crude Oil for a better understanding of the current market situation and more efficient trading.

Current trend

WTI crude oil prices declined again on Thursday, returning to the downtrend after a corrective growth of the instrument on Wednesday.

The overall pressure on the quotes is provided by the EIA report published on Wednesday, which recorded a new increase in US oil reserves by 4.851M barrels. Thus, American oil reserves reached 446.91M barrels, the highest level since last December. Oil production remained at the same level of 11.7M barrels per day, while the strategic reserve continues to be sold: over the week, it fell by 0.8M, to 652.6M barrels.

Baker Hughes US Oil Rig Count reflected a decline in the number of platforms from 888 to 885 units, which, however, did not have a noticeable effect on the instrument dynamics.

Support and resistance

Bollinger Bands in D1 chart demonstrate a stable decrease. The price range is almost unchanged, but remains sufficiently spacious for the further development of the downtrend in the short term. MACD indicator is trying to reverse upwards again and to form a buy signal (the histogram should be located above the signal line). Stochastic approached its minimum levels, having reversed into a horizontal plane. The indicator still reflects a strong oversold of the instrument in the short and/or ultra-short term.

Existing short positions should be kept until the situation clears up.

Resistance levels: 54.72, 55.64, 57.00, 58.64.

Support levels: 52.41, 51.32, 50.30, 50.00.

7-3.jpg


8-2.jpg


Trading tips

To open long positions, one can rely on the rebound from the support level of 52.41 with the subsequent breakout of 54.30 or 54.72. Take profit — 58.64 or 60.00. Stop loss — 53.20. Implementation period: 2-3 days.

A breakdown of 52.41 may be a signal to further sales with target at 50.30 or 50.00. Stop loss — 53.40. Implementation period: 1-2 days.

Use more opportunities of the NPBFX analytical portal: аnalytics. You can find more actual analytical reviews on other popular currency pairs, metals and CFDs on the NPBFX online portal. Daily analytics with charts, current market prognoses and trading scenarios in the Feed section are available. Get free and unlimited access to the online portal after registering on the official website of NPBFX Company.

If you have any questions about trading instruments, you can always ask an analyst in the online chat on the portal and get a free consultation of an experienced specialist.

Use the current recommendations of analysts on WTI Crude Oil and trade efficiently with NPBFX.
 
EUR/USD: the Euro remains under pressure 26.11.2018

Good afternoon, dear forum visitors!

NPBFX offers the latest release of analytics on EUR/USD for a better understanding of the current market situation and more efficient trading.

Current trend

EUR declined against USD on Friday updating local lows of November 16.

EUR declines under the influence of negative statistics. The Q3 German economy has slowed down for the first time since 2015, the GDP indicator was –0.2%. The economy is under pressure of a reduction in German imports, which lasted from July to September. Preliminary November German and EU PMI also were negative. German Services PMI fell from 54.7 to 53.3 points, EU Services PMI decreased from 53.7 to 53.1 points. German Manufacturing PMI fell from 52.2 to 51.6 points, and EU one dropped from 52.0 to 51.5 points. The indicators approach the mid-point level of 50.0 points, below which sectors begin to reduce.

Today, EUR is trading in both directions. Investors are focused on the future results of the EU summit on Brexit, in particular, the speeches of the heads of the ECB and the Bank of England.

Support and resistance

Bollinger Bands in D1 chart decrease gradually. The price range is actively narrowing from above, reflecting the recovery of the "bearish" trend at the end of the previous trading week. MACD is declining keeping a weak sell signal (located below the signal line). Stochastic keeps the downtrend, but approaches its minimum levels, which indicates the risks of oversold euro in the short term.

Existing short positions should be kept until the situation is clear.

Resistance levels: 1.1357, 1.1400, 1.1432, 1.1460.

Support levels: 1.1325, 1.1300, 1.1266, 1.1231.

7-4.jpg


8-3.jpg


Trading tips

To open long positions, one can rely on the rebound from 1.1325 as from support with the subsequent breakout of 1.1357. Take profit — 1.1432. Stop loss — 1.1325.

A breakdown of 1.1325 may be a signal to further sales with target at 1.1266 or 1.1231. Stop loss — 1.1357.

Implementation period: 2-3 days.

Use more opportunities of the NPBFX analytical portal:trading signals.

Make right trade decisions on sell or buy XAU and other popular instruments using trading signals on the NPBFX portal. All registered users have free access to signals from the top 10 trading indicators (MA10, BBands, Ichimoku, Stochastic, ZigZag, etc.) with also general recommendations on the portal.

If you have any questions about trading instruments, you can always ask an analyst in the online chat on the portal and get a free consultation of an experienced specialist.

Use the current recommendations of analysts on EUR/USD and trade efficiently with NPBFX.
 
NZD/USD: New Zealand dollar is in the correction 28.11.2018

Good afternoon, dear forum visitors!

NPBFX offers the latest release of analytics on NZD/USD for a better understanding of the current market situation and more efficient trading.

Current trend

Yesterday, NZD rose against USD, continuing the development of the corrective “bullish” impulse formed at the beginning of the week, due to quite strong data on New Zealand exports and a weak US macroeconomic background.

Thus, in October, exports from New Zealand increased from 4.25 billion dollars to 4.86 billion, which was slightly better than the average market forecasts. Imports increased even more: from 5.85 billion dollars to $6.15 billion, which led to a worsening of the trade deficit. The October figure reached –5.79 billion YoY against –5.33 billion YoY in September.

Today, the pair is strengthening, waiting for new drivers to appear. Investors are focused on the speech of the head of the RBNZ, Adrian Orr, and a block of US statistics, followed by the speech of the Fed Governor Jerome Powell.

Support and resistance

On the daily chart, Bollinger bands reverse horizontally. The price range narrows, reflecting the ambiguous trade nature of the recent days. MACD indicator is reversing upwards, keeping the sell signal (the histogram is below the signal line). The dynamics of Stochastic are similar, which indicates the potential for the development of corrective growth in the super-short term.

It is better to wait for the final formation of the "bullish" signal.

Resistance levels: 0.6815, 0.6849, 0.6882.

Support levels: 0.6760, 0.6748, 0.6704, 0.6662.

6-5.jpg


7-5.jpg


Trading tips

Long positions can be opened after the breakout of the level of 0.6815 with the target at 0.6882 or 0.6900. Stop loss is 0.6780.

Short positions can be opened after the breakdown of the level of 0.6748 with the targets at 0.6662–0.6650. Stop loss is 0.6780.

Implementation period: 2–3 days.

Use more opportunities of the NPBFX analytical portal:E-book.

If you just recently started to be interested in trading on FOREX and would like to deepen your knowledge, an electronic Beginner's Guide to FOREX Trading will be an excellent helper for you here. The book consists of 5 chapters and reflects fundamental concepts of the foreign exchange market to start successful trading. From the main chapters of the E-book you can learn about the concepts and history of FOREX, currencies and trend lines, technical indicators, types of orders, trading on news, psychology of trading, risk management and much more.

You can read a Beginner's guide to FOREX Trading online or download it free of charge from the NPBFX analytical portal in the "Education" section. In order to get unlimited access to the E-book and other useful instruments on the portal, you need to register on the NPBFX website.

If you have any questions about trading instruments, you can always ask an analyst in the online chat on the portal and get a free consultation of an experienced specialist.

Use the current recommendations of analysts on NZD/USD and trade efficiently with NPBFX.
 
AUD/USD: wave analysis 30.11.2018

Good afternoon, dear forum visitors!

NPBFX offers the latest release of analytics on AUD/USD for a better understanding of the current market situation and more efficient trading.

The pair may grow.

On the 4-hour chart, the upward correction develops as a wave 2 of (5). Now wave a of 2 is developing, within which the waves (i) and (ii) of a have formed. If the assumption is correct, the pair will grow to the levels of 0.7450–0.7587. In this scenario, critical stop loss level is 0.7197.

5-6.jpg


6-6.jpg


Main scenario

Long positions will become relevant during the correction, above the level of 0.7197 with the targets at 0.7450–0.7587. Implementation period: 7 days and more.

Alternative scenario

The breakdown and the consolidation of the price below the level of 0.7197 will let the pair go down to the levels of 0.7020–0.6950.

Use more opportunities of the NPBFX analytical portal: glossary.

Beginning traders certainly face a lot of specialized concepts and lexicon on FOREX, which are often not fully been understood. Swap, tick, hedge, margin calls are often unfamiliar to beginning traders. But the lack of knowledge of these fundamentals make a competent market vision impossible. So glossary on the NPBFX analytical portal could be an excellent helper in this case, which contains all the main definitions with explanations in a compact and accessible form. All concepts are arranged in alphabetical order, so that you can easily and quickly find and explore a new concept for yourself.

If you have any questions about trading instruments, you can always ask an analyst in the online chat on the portal and get a free consultation of an experienced specialist.

Use the current recommendations of analysts on AUD/USD and trade efficiently with NPBFX.
 
GBP/USD: wave analysis 03.12.2018

Good afternoon, dear forum visitors!

NPBFX offers the latest release of analytics on GBP/USD for a better understanding of the current market situation and more efficient trading.

The pair may decrease.

On the 4-hour chart, the downward correction of the higher level develops as a wave 2. Now the wave C of 2 is developing, within which the fifth wave of the lower level v of C is forming. If the assumption is correct, the pair will fall to the level of 1.2600. In this scenario, critical stop loss level is 1.2850.

3.jpg


4.jpg


Short positions will become relevant during the correction, below the level of 1.2850 with the target at 1.2600. Implementation period: 5–7 days.

Alternative scenario

The breakout and the consolidation of the price above the level of 1.2850 will let the pair grow to the level of 1.3305.

Use more opportunities of the NPBFX analytical portal: economic indicators

Regular monitoring of global economic indicators plays an important role in trading, because of their strong influence on FOREX market and possibility to provoke significant price fluctuations. For the convenience of traders the "Education" section on the NPBFX portal contains the most popular and significant world economic indices with a detailed description, their possible impact on the economy and exchange rates (GDP, consumer price index, unemployment rate, Nonfarm Payrolls (NFP), etc.).

If you have any questions about trading instruments, you can always ask an analyst in the online chat on the portal and get a free consultation of an experienced specialist.

Use the current recommendations of analysts on GBP/USD and trade efficiently with NPBFX.
 
EUR/USD: wave analysis 06.12.2018

Good afternoon, dear forum visitors!

NPBFX offers the latest release of analytics on EUR/USD for a better understanding of the current market situation and more efficient trading.

The pair may grow.

On the 4-hour chart, a downward correction of the higher level develops as a wave (2), within which the wave C of (2) forms. Now an upward correction is developing as a second wave ii of C, within which the wave (c) of iii is developing. If the assumption is correct, the pair will grow to the levels of 1.1511–1.1586. In this scenario, critical stop loss level is 1.1266.

5.jpg


6.jpg


Main scenario

Long positions will become relevant during the correction, above the level of 1.1266 with the targets at 1.1511–1.1586. Implementation period: 5–7 days.

Alternative scenario

The breakdown and the consolidation of the price below the level of 1.1266 will let the pair go down to the levels of 1.1200–1.1150.

Use more opportunities of the NPBFX analytical portal: analytics.

You can find more actual analytical reviews on other popular currency pairs, metals and CFDs on the NPBFX online portal. Daily analytics with charts, current market prognoses and trading scenarios in the Feed section are available. Get free and unlimited access to the online portal after registering on the official website of NPBFX Company.

If you have any questions about trading instruments, you can always ask an analyst in the online chat on the portal and get a free consultation of an experienced specialist.

Use the current recommendations of analysts on EUR/USD and trade efficiently with NPBFX.
 
Back
Top